Rep:Mod:ms7109 module2
Structure and Bonding of Inorganic Complexes
MO analysis of BH3
Geometry Optimisation
The general method to optimise a molecule involves solving the Schrodinger equation for the electron density and energy at a given position of the nuclei (SCF). Under the Born-Oppenheimer approximation the momenta of the nuclei is neglected due to their slow speed relative to electrons, thus their position is repetitively changed and the process above repeated until the lowest energy geometry is identified, this will be the minimum on a potential energy surface curve.
On gaussview the molecule is drawn and its geometry altered to B-H bond lengths of 150 pm. The optimisation calculation is set up to a B3LYP model, this determines the approximations in solving the Schrodinger equation, and a low accuracy but fast 3-21G basis set.


| Summary of Optimisation Results | |
|---|---|
| B-H Bond Length | 1.19Å |
| H-B-H Bond angle | 120.0° |
| File type | .log |
| Calculation type | FOPT |
| Calculation method | RB3LYP |
| Basis set | 3-21G |
| Spin | singlet |
| Final Energy | -26.46 a.u. |
| Gradient | 2.07 x 10⁻⁴ a.u. |
| Dipole Moment | 0.00 D |
| Point Group | D3h |
| Time taken for calculation | 7 s |
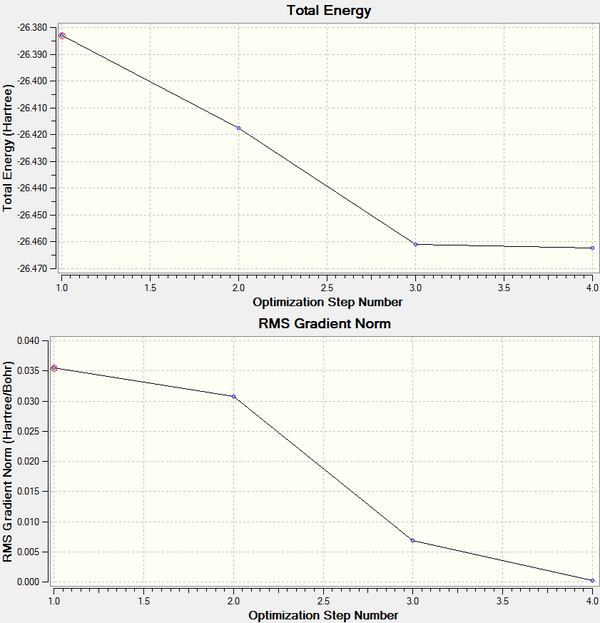
The root mean square gradient is the rate of change of total energy with respect to displacement of each atom in the x, y and z directions, in other words if the position of the nuclei is given as coordinate R and the energy as E(R), the gradient is equal to dE(R)/dR. To check that the optimization has successfully been completed the gradient should be tending to zero or at least be lower than 0.001, another way is to open the original text based .log file and assess the convergence of Forces and Displacements. Both confirm that the molecule has been optimised as the gradient < 0.001 and all convergence outcomes are YES (Fig. 1). Further analysis of the optimisation reveals that it underwent 4 iterations, starting from the least stable geometry of -26.382 a.u. and reaching what looks to be a minimum for the fourth optimisation step number (Fig. 2).
 |
 |
Nonetheless, the stationary point could still be a maximum, therefore there is a need to calculate the second derivative d2E(R)/dR2 which is given by the sign in the vibrational frequencies.
Vibrational Analysis
To determine the vibrational modes of the BH3 molecule a similiar calculation to that of the optimisation is carried out. B3LYP and 3-21G are used as the method and basis set respectively thus keeping the accuracy and energies analogous to the previous part.
| Summary of Frequency Results | |
|---|---|
| File type | .log |
| Calculation type | FREQ |
| Calculation method | RB3LYP |
| Basis set | 3-21G |
| Spin | singlet |
| Final Energy | -26.46 a.u. |
| Gradient | 2.07 x 10⁻⁴ a.u. |
| Dipole Moment | 0.00 D |
| Point Group | D3h |
| Time taken for calculation | 15 s |
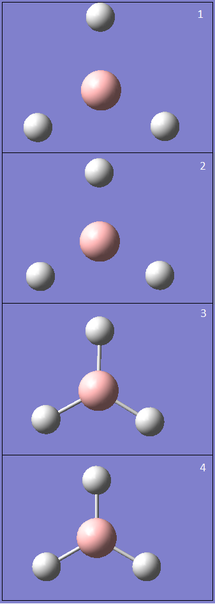
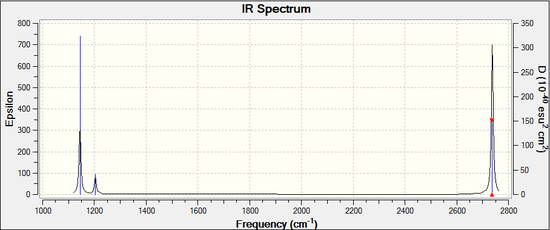
The summary for the frequency calculation shows that a D3h point group (trigonal planar) is preserved and the final energy of the molecule is equivalent to the optimised one at -26.46 a.u. From the table above it is clear that all frequencies are positive and the stationary point during optimisation must be a minimum. All molecules have 3N-6 degrees of vibrational modes, in this case there are 4 atoms therefore BH3 will have 3(4)-6 = 6 vibrational modes as calculated, however, one has to consider which are IR active. Only the modes associated with a change in the dipole will be detected by IR spectroscopy, as a result symmetric stretching (vibration number 4) will not come up in the spectrum due to a retention of symmetry. In addition, scissoring (2) and rocking (3) occur at identical energies in the same way as asymmetrical stretches, these are termed degenerate modes generating a single IR absorption. The spectrum in figure 4 demonstrates the presence of 3 peaks: a medium one at 1144.2 cm-1 for wagging, a weak one at 1203.6 cm-1 for the degenerate scissoring and rocking and a final strong peak at 2737.4 cm-1 originating from asymmetric stretching. An advantage of using computational IR characterization is that it determines all vibrational modes whereas experimental spectroscopy gives you a less informative spectrum containing only IR active modes.
Molecular Orbital Diagram
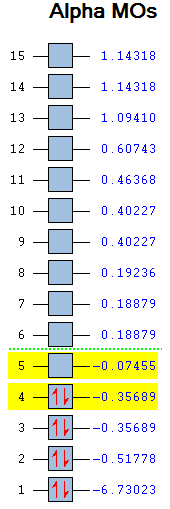
A convenient outcome of computationally solving electron density is the resulting Molecular Orbitals. These are calculated quantitatively and can be compared to the approximate molecular orbitals by evaluating their corresponding MO diagrams. Once more the same B3LYP method and 3-21G basis set are used, this time running an energy calculation specifically asking for MO analysis and generating full NBO's. DOI:10042/to-10982
 |
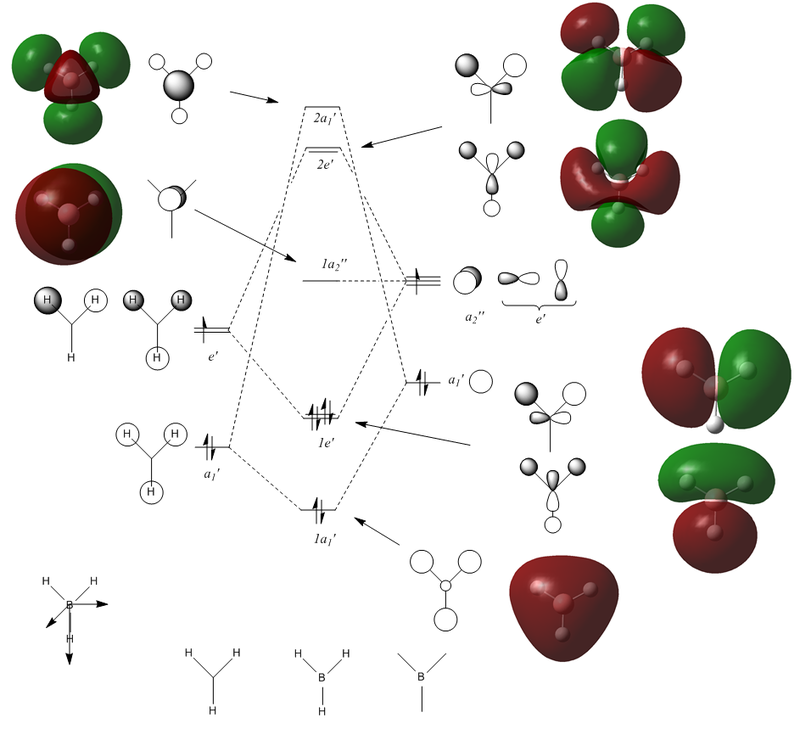 |
Molecular orbital 1 in figure 5 is not shown in the diagram because its energy is too low whereas MO's 9 and above are also not shown since they are not significant in the bonding. Compared to the qualitative MO diagram there is one major difference, this is the position of the 2e' (6 and 7) and 2a1' (8) orbitals which swap around when computed. Nonetheless, the graphical MO's match very well with the LCAO MO's suggesting that qualitative MO theory is very useful when describing simple molecules but would be too difficult for more complex ones.
Natural Bond Orbitals analysis
NBO's help to determine the most accurate Lewis structure of BH3 or what is more commonly known as the 2c-2e bonding picture with the electron density localized on atoms and bonds. Gaussview can only give a graphical representation of charge distribution but the original .log file entails a lot more such as hybridization or orbital mixing.
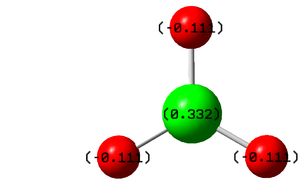
The diagram and the table above inform us about the charge distribution in BH3, Boron is highly positively charged reflecting its Lewis deficient character whilst the hydrogen atoms are negatively charged holding a third of the charge each.
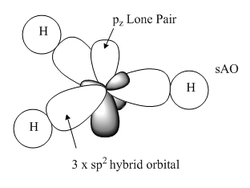
The hybridization of the molecule is clearly explained; each bond is described according to the contribution of boron and hydrogen together with the corresponding s and p character of their bonding orbitals. There are 3 hybrid sp2 orbitals interacting with three hydrogen sAO's, a core 1sAO of boron and a lone pair which should be 100% p character but it has been calculated as 100% s character due to a lower accuracy basis set.
Second Order Perturbation Theory Analysis of Fock Matrix in NBO Basis
    Threshold for printing:   0.50 kcal/mol
                                                  E(2)  E(j)-E(i) F(i,j)
        Donor NBO (i)          Acceptor NBO (j) kcal/mol a.u.   a.u.
=====================================================================
within unit  1
  4. CR (   1) B   1     / 10. RY*(   1) H   2    1.51   7.54   0.095
  4. CR (   1) B   1     / 11. RY*(   1) H   3    1.51   7.54   0.095
  4. CR (   1) B   1     / 12. RY*(   1) H   4    1.51   7.54   0.095
|
Natural Bond Orbitals (Summary):
                     Principal Delocalizations
          NBO                        Occupancy    Energy
============================================================
Molecular unit  1  (H3B)
    1. BD (   1) B   1 - H   2          1.99853    -0.43712
    2. BD (   1) B   1 - H   3          1.99853    -0.43712
    3. BD (   1) B   1 - H   4          1.99853    -0.43712
    4. CR (   1) B   1                  1.99903    -6.64476
    5. LP*(   1) B   1                  0.00000     0.67666
    6. RY*(   1) B   1                  0.00000     0.37177
    7. RY*(   2) B   1                  0.00000     0.37177
    8. RY*(   3) B   1                  0.00000    -0.04532
    9. RY*(   4) B   1                  0.00000     0.43446
   10. RY*(   1) H   2                  0.00032     0.90016
   11. RY*(   1) H   3                  0.00032     0.90016
   12. RY*(   1) H   4                  0.00032     0.90016
   13. BD*(   1) B   1 - H   2          0.00147     0.41201
   14. BD*(   1) B   1 - H   3          0.00147     0.41201
   15. BD*(   1) B   1 - H   4          0.00147     0.41201
      -------------------------------
             Total Lewis    7.99463  ( 99.9329%)
       Valence non-Lewis    0.00441  (  0.0551%)
       Rydberg non-Lewis    0.00097  (  0.0121%)
      -------------------------------
           Total unit  1    8.00000  (100.0000%)
          Charge unit  1    0.00000
|
The first table predicts any possible mixing between molecular orbitals, however, it is only significant if its higher than 20 kcal mol-1 which none are. The second summarises all the orbital occupancies and energies showing that all bonds are made up of two electrons as does the boron 1s non-bonding orbital.
Structural analysis of TlBr3
Geometry Optimisation
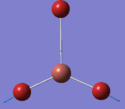
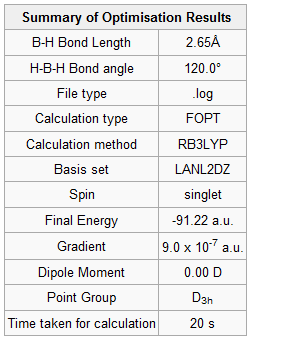
Both Thallium and Bromine atoms have many more electrons than relatively simple BH3, this means calculating their electron density and energies would take too much time. As a result pseudo potentials are used to avoid solving the Schrodinger equation for the core electrons since they are not involved in bonding. Initially the molecule is constrained to a D3h symmetry and then it is optimized with B3LYP and LANL2DZ; a medium accuracy basis set which employs Los Alamos ECP pseudo-potentials on heavier elements such as Thallium. DOI:10042/to-10973
 |
 |
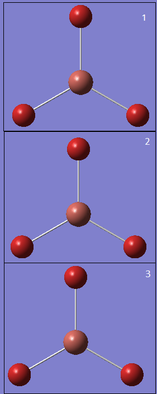 |
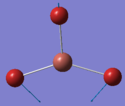
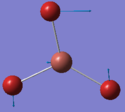
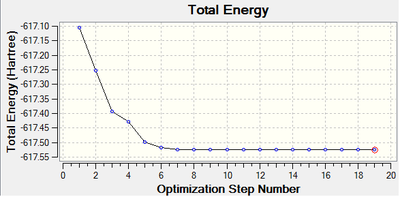
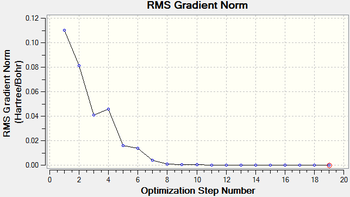
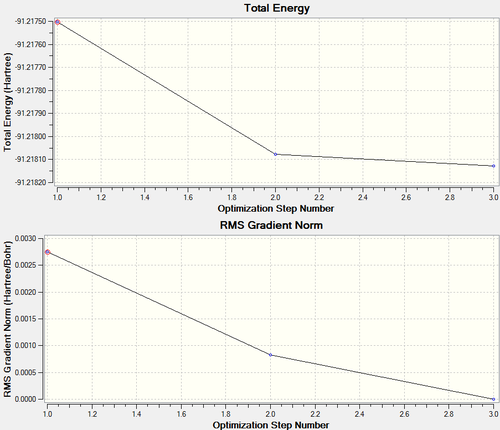
Figure 6 and 7 show how the optimization occured, the molecule geometry underwent three iterations resulting in a very close to zero gradient at the third. As discussed for the previous example this stationary point could be a minimum or maximum and vibrational analysis is needed to prove which one it is.
Vibrational Analysis
To determine the vibrational modes of TlBr3, DFT-B3LYP is still used as the method and LANL2DZ as the basis set just like in the optimisation above.
| Summary of Frequency Results | |
|---|---|
| File type | .log |
| Calculation type | FREQ |
| Calculation method | RB3LYP |
| Basis set | LANL2DZ |
| Spin | singlet |
| Final Energy | -91.22 a.u. |
| Gradient | 8.8 x 10⁻⁷ a.u. |
| Dipole Moment | 0.00 D |
| Point Group | D3h |
| Time taken for calculation | 21 s |
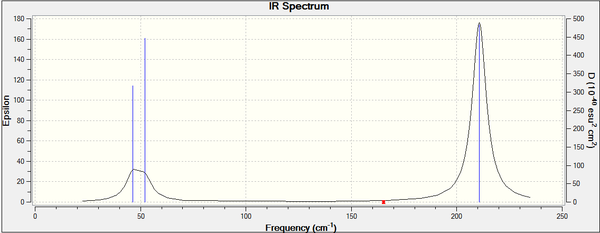
Values in the frequency calculation summary match those of the optimisation so it was completed successfully. The IR spectrum is similar to that of BH3 with three peaks, two of which superimpose and broaden the overall peak, this is expected since both molecules have the D3h point group. All vibrational modes are tabulated below and again their similarity to BH3 is obvious, symmetric stretching is IR inactive and the two degenerate pairs are present too. The frequencies are lower in energy concurring with the longer bond lengths of 2.69Å (c.f. 1.93Å) and therefore weaker Tl-Br bonds .
Low frequencies ---   -3.4213   -0.0026   -0.0004    0.0015    3.9367    3.9367
Low frequencies ---   46.4289   46.4292   52.1449
The first line of low frequencies comes from the motion of the centre of mass and should be a lot lower than the "real" normal modes. In this case the largest "zero" frequency is close to 4 and the lowest "real" mode is 46.4 cm-1, this is only a tenth but this low accuracy arises from the poor level of the method used. Nonetheless, all frequencies are positive confirming the minimum during optimisation.
A chemical bond is the sharing of electrons between two atoms leading to a molecule which is more stable than the individual atoms. A whole spectra of bond strengths exists depending on the stabilisation of the bonding orbital, this is proportional to the bond length. Gaussview has a predefined value for bond distance and when a bond is greater than this value it is not shown as for BH3. Nonetheless a bond is better considered as localized electron density between two atoms thus the absence of a bond "line" makes no difference during MO/frequency calculations because electron density is taken into account.
Cis and Trans Isomers of MO(CO)4(PPh3)2
Geometry Optimisation
MO(CO)4(PPh3)2 may have two triphenylphosphine groups in a cis or trans conformation. Since these complexes are too computationally demanding, the PPh3 groups will be replaced by PCl3 which are sterically just as large and contribute to bonding in a similar manner. Optimising the ground state structures begins by drawing the two complexes on gaussview and running an optimization with B3LYP and LANL2MB (minimal) basis set for each. Pseudo Potentials must be used again to model the core electrons and a loose convergence is established to get the rough geometry.DOI:10042/to-10976 and DOI:10042/to-10981
| Trans | FOPT | RB3LYP | LANL2MB | singlet | -617.5 | 5.9 x10⁻⁵ | 0.00 | C1 | 8min 10s |
| |||
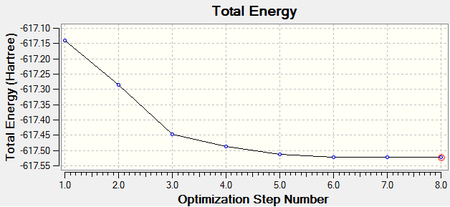 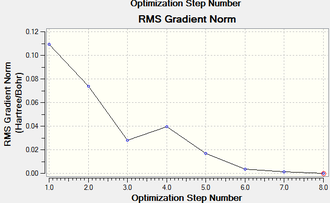 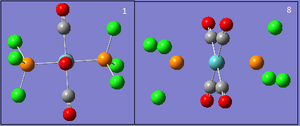
| |||||||||||||

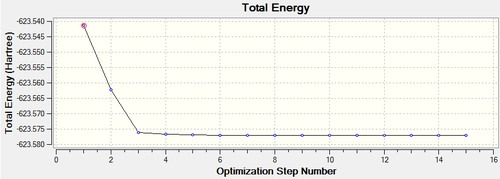
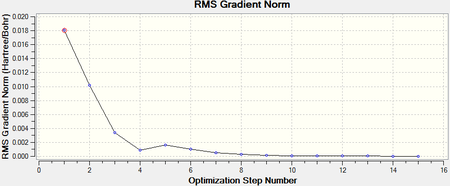
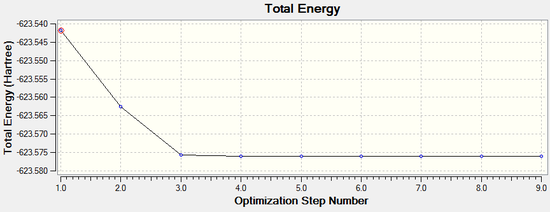
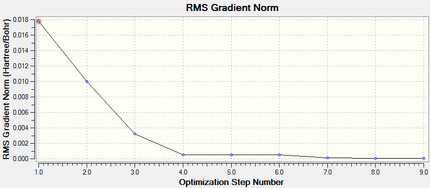
Both isomers reach the same final energy of -16.1 x 10⁶ kJ mol-1. Cis has a dipole moment of 8.47D whereas Trans does not due to its high symmetry along the P-Mo-P plane. The energy curve shows 19 iterations for cis isomer, on the fourth an unstable geometry is isolated, however a stationary point is finally reached. For the trans isomer, optimization underwent only 8 iterations shown by a smooth curve and a resulting minimum. Since a low level method is used, unless the orientation of the PCl3 groups is close to the ideal geometry, it will optimise until a zero gradient is obtained, however this could be a local minimum on the PES curve and a lower energy geometry might exist. The best orientation for PCl3 in both isomers is shown in figure 8 and can be applied to the molecules in gaussview by altering torsional angles. For the cis conformer the Cl atoms in one group are rotated so that one points up parallel to the axial bond and on the other group the same is done but with a Cl pointing down. For the trans, PCl3 are rotated until they eclipse and one Cl from each group lies on top of a C-O bond. After dihedral modification a more accurate optimization is carried out with a better pseudo-potential, basis set LANL2DZ and tighter convergence criteria. DOI:10042/to-10982 and DOI:10042/to-10986
| Summary of Improved Optimisation Results | |||||||||||||
|---|---|---|---|---|---|---|---|---|---|---|---|---|---|
| Isomer | Calculation type | Calculation method | Basis set | Spin | Final Energy (a.u.) | Gradient (a.u.) | Dipole Moment (D) | Point Group | Time taken for calculation | Structure | |||
| Cis | FOPT | RB3LYP | LANL2DZ | Singlet | -623.58 | 1.02 x10⁻⁵ | 1.31 | C1 | 1hr 3min 49s |
| |||
| |||||||||||||
| Isomer | Calculation type | Calculation method | Basis set | Spin | Final Energy (a.u.) | Gradient (a.u.) | Dipole Moment (D) | Point Group | Time taken for calculation | Structure | |||
| Trans | FOPT | RB3LYP | LANL2DZ | singlet | -623.58 | 3.7 x10⁻⁵ | 0.31 | C1 | 47min 38s |
| |||
| |||||||||||||
The more accurate optimisation has resulted in a lower energy minimum for both isomers, a decrease of 15800 kJ mol-1 and therefore a more stable geometry. Even the gradients are closer to zero confirming the tighter convergence of the calculation. Now it is time to verify the optimisation by analysing vibrational frequencies.
Vibrational Analysis
In this section I will analyze in more detail a) the structure, b) The relative energies and c) the vibrations of both the cis and trans isomers and relate this to their symmetry. Frequency calculation is carried out as shown below following the same parameters as the optimisation. A minimum is reached since final energy values stay constant. DOI:10042/to-10988 and DOI:10042/to-10989
| Summary of Frequency Results | ||
|---|---|---|
| Isomer | Cis | Trans |
| Calculation type | FREQ | FREQ |
| Calculation method | RB3LYP | RB3LYP |
| Basis set | LANL2DZ | LANL2DZ |
| Final Energy (a.u.) | -623.577 | -623.576 |
| Gradient (a.u.) | 1.03 x 10⁻⁵ | 3.73 x 10⁻⁵ |
| Dipole Moment (D) | 1.31 | 0.31 |
| Point Group | C1 | C1 |
| Time taken for calculation | 27min 13s | 30min 37s |
Structure
Geometric parameters of the isomers are tabulated below together with literature values to compare with. The cis isomer is compared with the bond lengths and angles determined from the crystal structure of the experimentally synthesised molecule[1]. However, literature data for the trans isomer was not available so a similar structure with chromium replacing molybdenum was used to compare to the computed results[2]. Cr and Mo are both in group 6, they have the same number of valence electrons and form analogous complexes.


Bond lengths for Cis conformer are slightly different, they tend to be higher than reported values except for the Mo-P bond which is shorter, yet they are within a ±0.05Å error. Bond angles are similar too but P-Mo-P is 10° smaller because Cl atoms were used instead of phenyl groups thus leading to less steric strain between two cis PPh3. For trans isomer the lengths are all longer with a greater error of ±0.1Å which is expected since chromium is the metal centre and being smaller than molybdenum it forms shorter Cr-P and Cr-C bonds. Nonetheless bond angles agree very well with literature. These geometric parameters confirm the structure and corresponding point groups of both complexes; C2v and D4h for the cis and trans forms respectively.
Relative Energies
There is a very small difference between the two isomers of 2.63 KJ mol-1 and therefore no certain conclusion can be made on which isomer is more stable. This small preference for the cis isomer can be rationalized on the fact that two PPh3 trans to each other will experience less steric repulsion, but the trans effect on cis stabilises this geometry.
Vibrations
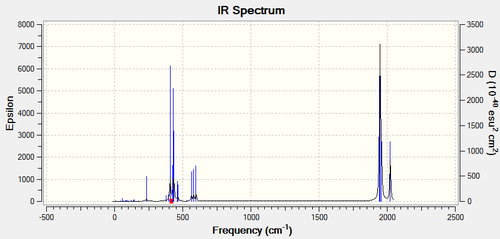
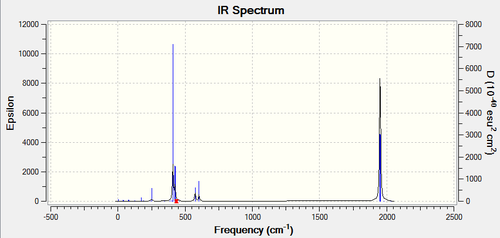
Both complexes have exactly 45 vibrational modes, most of them being IR inactive with low intensity. Looking at the IR spectra, the cis isomer has more peaks due to a lower symmetry and higher dipole moment of 1.31D. At very low frequencies below 20 cm-1 two modes arise from the rotation of the Chlorine atoms away from their ideal orientation. These are low energy vibrations which are excited at room temperature and can be understood as oscillations at the minimum in the PES. All frequencies are positive thus a minima was reached during optimisation.
| Cis Isomer | Trans Isomer | ||||||
 |
 | ||||||
| Mode number | Frequency (cm-1) | Intensity | Vibration | Mode number | Frequency(cm-1) | Intensity | Vibration |
| 1 | 10.7 | 0.03 | 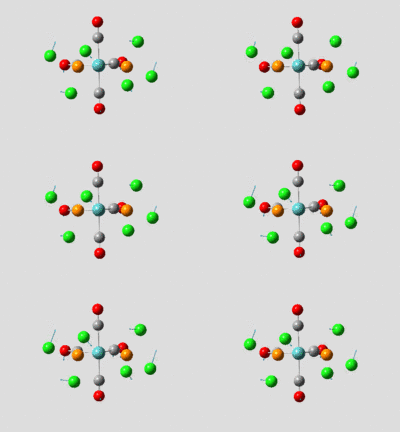 |
1 | 4.9 | 0.09 | 
|
| 2 | 17.6 | 0.01 | 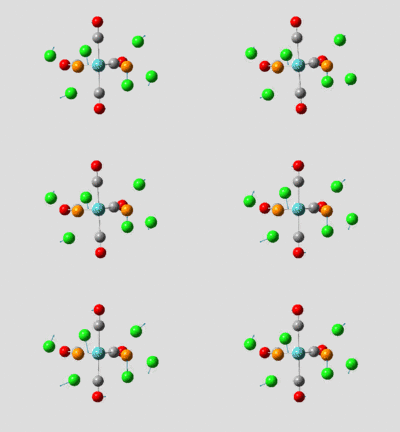 |
2 | 6.1 | 0 | 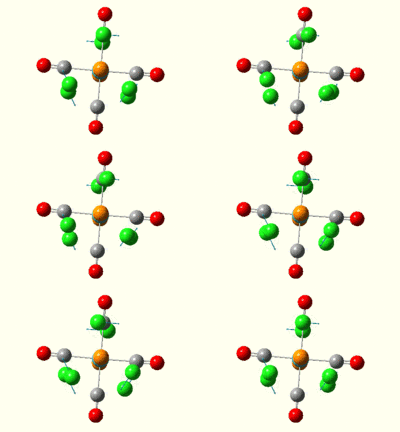
|
| C-O Vibrational modes | |||||||
| 42 | 1945 | 763 | 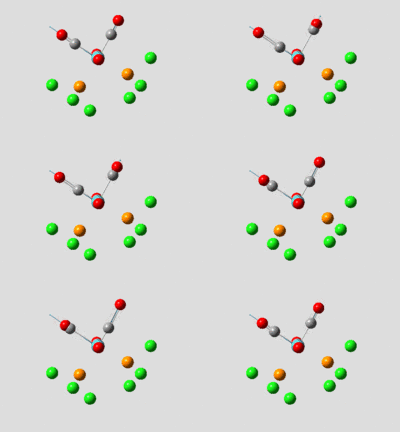 |
42 | 1951 | 1475 | 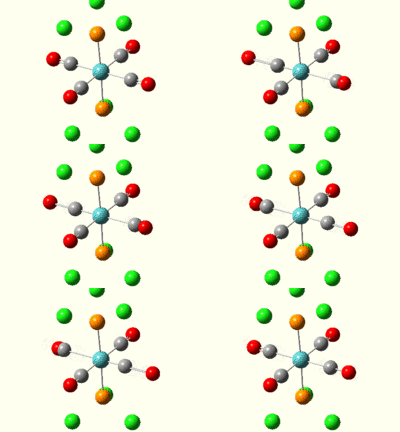
|
| 43 | 1949 | 1499 | 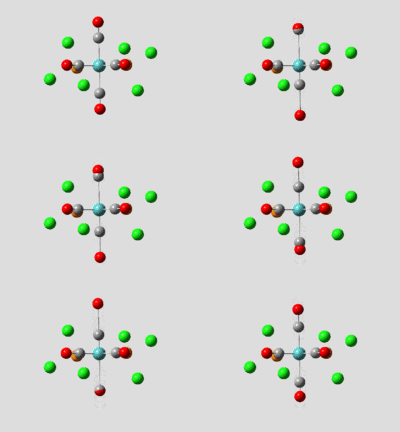 |
43 | 1951 | 1467 | 
|
| 44 | 1958 | 633 |  |
44 | 1977 | 0.64 | 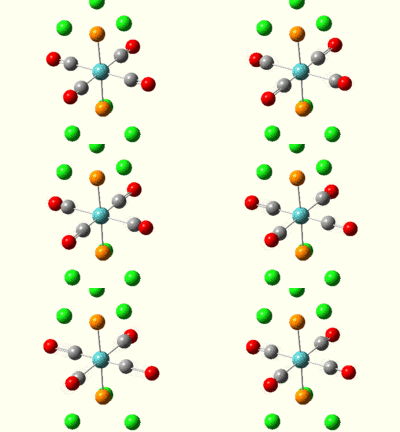
|
| 45 | 2023 | 598 |  |
45 | 2031 | 3.77 | 
|
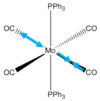
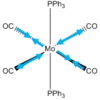
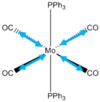
The vibrational modes of the carbonyl stretches can help us verify the geometry of the molecule. For the cis isomer, the 4 C-O vibrations are IR active as they show high intensities in the spectrum, whereas for the trans isomer two are degenerate and yield a single peak and the other two are inactive with very low intensities. Since IR inactive vibrations force no change in the dipole moment of the molecule the symmetry has to be higher for the trans complex. Using the character table for the two point groups these modes can be assigned to a specific symmetry.
| Molecular symmetry | Cis (C2v) | Trans (D4h) | ||||||
| Vibration Frequency cm-1 | 1945 | 1949 | 1958 | 2023 | 1951 | 1951 | 1977 | 2031 |
| Literature Frequency cm-1 | 1941 | 1948 | 1965 | 2049 | 1943 | 1943 | 1985 | 2050 |
| Stretch vectors |  |
 |
 |
 |
 |
 |
 |
|
| Stretch type | asymmetric cis | asymmetric trans | symmetric cis and trans (out of phase) | All symmetric | Asymmetric trans | Asymmetric Trans | Both symmetric (out of phase) | All symmetric |
| Vibration symmetry | B2 | B1 | A1 | A1 | Eu | Eu | B1g | A1g |
Computed frequencies relate very well to the reported values[3] even though P(OC6H5)3 is used instead of triphenyl phosphine.
Miniproject: Sulphur Tetrafluoride
SF4, the simplest known sulfurane, is a gas at room temperature and is used as a flourinating agent in the synthesis of organofluorine compounds. Sulphur is present in the +4 oxidation state with two electrons forming a lone pair. Having 10 electrons overall in its valence shell makes it hypervalent and therefore an interesting molecule to analyse both structurally and electronically.
Geometry
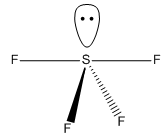
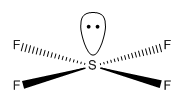
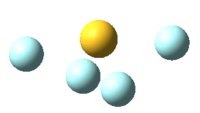
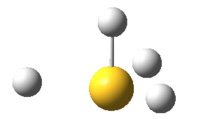
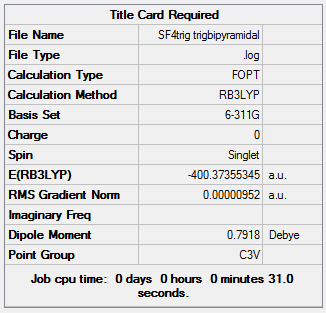
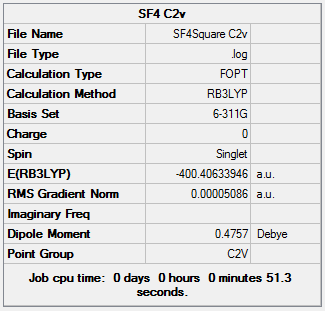
Its geometry is essentially described as trigonal bipyramidal with a lone pair occupying one of the equatorial sites. VSEPR theory predicts it to be pseudo see-saw shaped since the lone pair pushes the two equatorial and two axial fluorine atoms away reducing all F-S-F bond angles. Even though it is less likely that the lone pair occupies the axial position it is worth considering it as a possible structure. Lastly, it is known that SF4 is isoelectronic with ClF4+ so another option would be square pyramidal with the lone pair occupying the axial site. All these geometries can be optimized computationally using DFT-B3LYP as the method and a high accuracy 6-311G basis set. By not constraining the molecules to a specific point group the lowest energy configurations for all 3 geometries can be obtained, these are tabulated below: DOI:10042/to-10990 , DOI:10042/to-10991 and DOI:10042/to-10992
| See-Saw | Trigonal bipyramidal | Square pyramidal |
 |
 |
|
 |
 |

|
 |
 |
|
The see-saw geometry is by far the most stable having an energy 1.04 x 10⁶ kJ mol-1 lower than the other two and nearly twice as stable. This is expected since the lone pair destabilises trigonal and square pyramidal by repelling fluorine atoms away from the equatorial plane. The geometric parameters below prove the discussion above, for example bond angle Fax-S-Feq in trigonal bipyramidal structure is 83° instead of being 90°.
| S-F axial | 1.82Å | S-F axial | 1.36Å | S-F | 1.46Å |
| S-F equatorial | 1.75Å | S-F equatorial | 1.70Å | ||
| F-S-F axial | 165.9° | Fax-S-Feq | 83.0° | F-S-F trans | 162.8° |
| F-S-F equatorial | 107.2° | F-S-F equatorial | 119.3° | F-S-F cis | 88.7° |
Values for the see-saw geometry can be compared with literature[4], S-F axial and equatorial bonds are reported to be 1.73Å and 1.64Å respectively suggesting that the computed bond lengths are about 0.1Å higher, yet axial and equatorial lengths are different. The bond angles are quite similar with axial being 173° and equatorial 102°, again the basis set has overestimated the size of bond angles because it probably doesn't take into account how the lone pair affects the electron density around the molecule.
Vibrational analysis
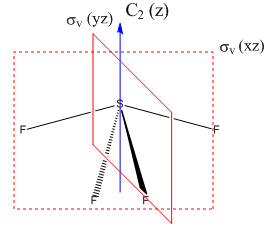
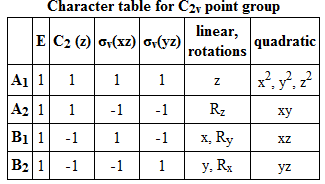
By calculating the vibrational modes and the IR spectrum of SF4 one can confirm to which point group the molecule belongs to. If the see-saw geometry (C2v symmetry) is used for the calculation then the modes are given themselves a symmetry belonging to that particular point group. A mode which doesn't alter the dipole moment of the molecule has zero intensity in the spectrum, thus a comparison of the experimental spectrum with the computed one can confirm which geometry it has. Frequency calculation is carried out with identical method and basis set as the optimisation (B3LYP and 6-311G) and specifying a full population analysis. DOI:10042/to-10993
|
|
|
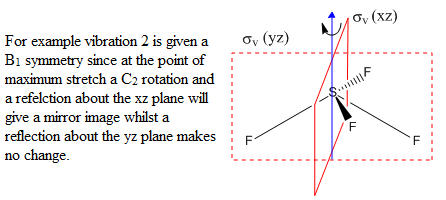
| Vibrational number | Frequency (cm-1) | Intensity | Literature frequency (cm-1) | Vibrational mode | Form of vibration | Symmetry C2v point group |
|---|---|---|---|---|---|---|
| 1 | 97 | 0.87 | 228 | axial deformation | 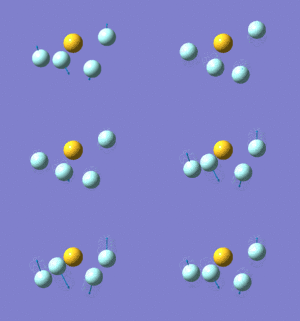 |
A1 |
| 2 | 254 | 16.64 | 353 | axial deformation | 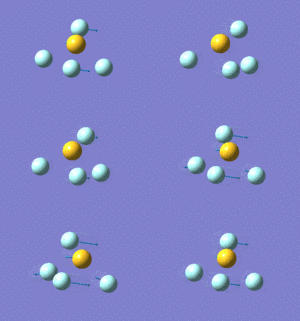 |
B1 |
| 3 | 327 | 0.00 | 414 | twist | 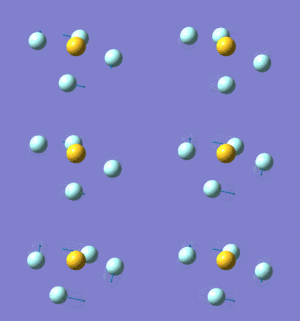 |
A2 |
| 4 | 351 | 30.39 | 475 | SF2eq deformation | 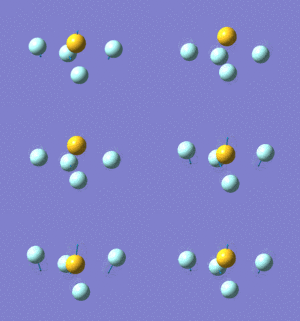 |
A1 |
| 5 | 361 | 4.34 | 532 | FSF2eq deformation | 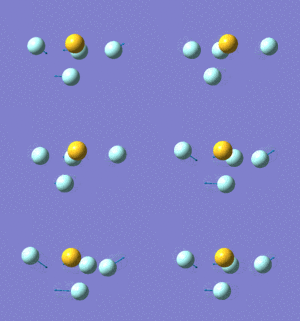 |
B2 |
| 6 | 498 | 2.11 | 558 | Symmetric S-F stretch (axial fluorines) | 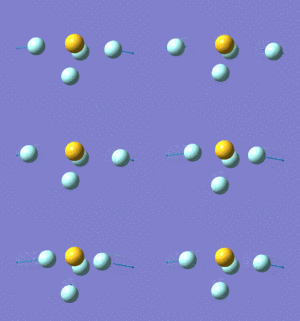 |
A1 |
| 7 | 683 | 49.16 | 730 | Symmetric S-F stretch (equatorial fluorines) | 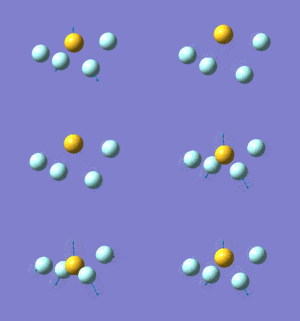 |
A1 |
| 8 | 697 | 98.94 | 867 | Asymmetric S-F stretch (equatorial fluorines) | 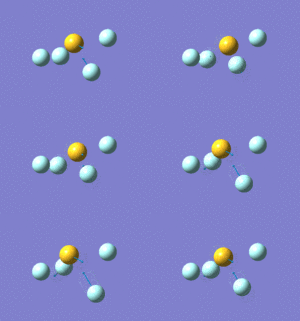 |
B1 |
| 9 | 737 | 323.43 | 892 | Asymmetric S-F stretch (axial fluorines) | 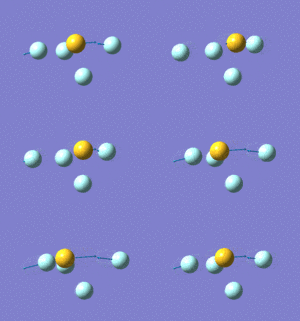 |
B2 |
|
|
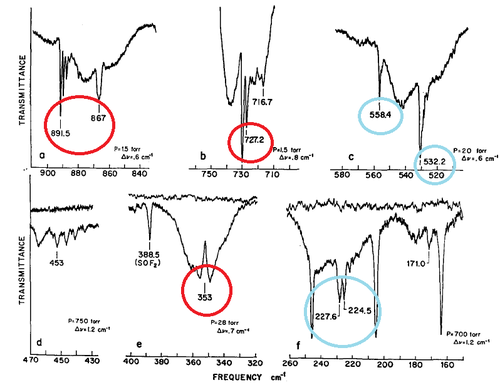
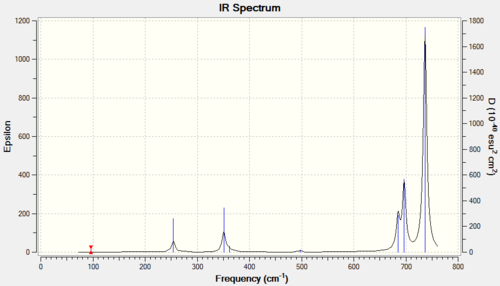
The spectrum on the left is taken from the same paper as the reference values[5]. Comparing computed frequencies with the literature shows that they are all lower than expected by approximately 100cm-1. This systematic error may arise from insufficient accuracy of the calculation. Out of the nine vibrations only five come up in the spectrum on the right, the remaining four have intensities below 5 and are thus IR inactive. I have highlighted in red the peaks which show up in both spectra, these are vibrations 2,7,8 and 9. Vibration 4 should also be present in the reported spectrum at 475cm-1. The peaks highlighted in blue are the ones which are IR inactive and are dubbed as weak.
Low frequencies ---  -21.6902   -0.0034   -0.0006    0.0019   14.1694   31.3250
Low frequencies ---   96.5510  254.2327  326.9733
An explanation for why the frequencies are off the reported values could be because the highest "zero" frequency of -22 cm-1, originating from the motion of the center of mass, is very high relative to the lowest vibration of 97 cm-1. All frequencies are positive so the minimization has converged to a minimum.
Molecular Orbital analysis
A molecular orbital diagram of sulfur tetrafluoride can be computationally prepared by calculating the energies of the molecular orbitals. Even graphic representations of these orbitals can be made and then compared with the LCAO'S. To work out the qualitative MO's the SF4 molecule is split up into two fragments; SF2 and F-·-F which represents the axial fluorine atoms. Bringing the orbitals of the same symmetry together can produce good approximates of the graphical MO's as done in this journal[6]. The energy calculation is run with B3LYP and 6-311G basis set together with pop="full" and full NBO.DOI:10042/to-10994
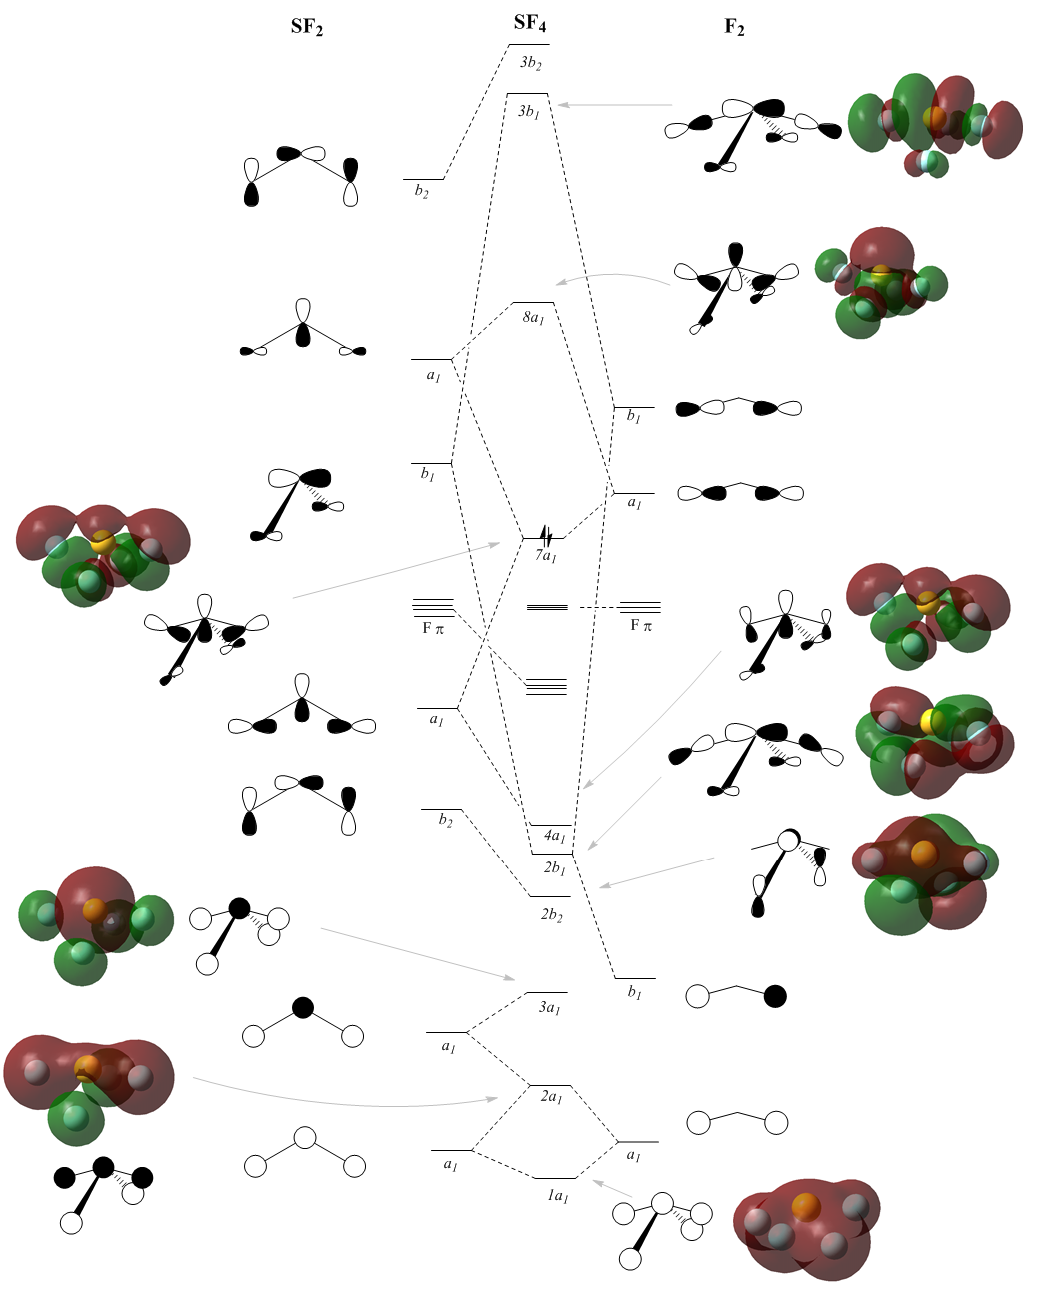
The calculation resulted in a total of 73 orbitals, most of them anti bonding and insignificant since the HOMO is the 26th. Out of the bonding orbitals the lowest energy ones are the s, px, py and pz of the sulphur atom only, these range from -8.3 to -6.2. Then between -1.30 to -1.18 there are four orbitals: one with all atoms in full s character, two with S p and F s and the fourth with all s but axial antibonding. Consequently the fluorine atoms also adopt p character and explaining the MO's becomes very difficult. The diagram is a simplification as it excludes many of the confusing orbitals. For example Fπ orbitals whereby sulphur is non-bonding but fluorine atoms bond with their p orbitals are not included. The Fπ molecular orbitals are shown below. The HOMO (7a1) agrees very well with the literature[6] as do other computed MO's.

NBO analysis
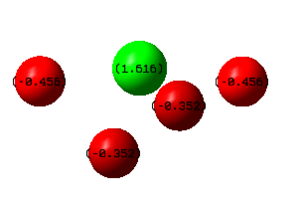
Running the energy calculation for MO analysis also gives us information on the natural bond orbitals of SF4. The table below taken directly from the .log file shows how all of the positive charge is concentrated on the Sulphur atom. Negative charge is distributed unevenly between axial and equatorial fluorines, the former having a greater negative charge, which makes sense as S-F axial bond lengths are longer.
Summary of Natural Population Analysis:
                                       Natural Population
               Natural  -----------------------------------------------
   Atom  No    Charge         Core      Valence    Rydberg      Total
-----------------------------------------------------------------------
     S    1    1.61567      9.99995     4.35450    0.02989    14.38433
     F    2   -0.45567      1.99999     7.45346    0.00222     9.45567
     F    3   -0.35216      1.99999     7.34984    0.00233     9.35216
     F    4   -0.45567      1.99999     7.45346    0.00222     9.45567
     F    5   -0.35216      1.99999     7.34984    0.00233     9.35216
|
|
(Occupancy) Bond orbital/ Coefficients/ Hybrids
---------------------------------------------------------------------------------
    1. (1.82959) BD ( 1) S   1 - F   2
               ( 17.53%)   0.4186* S   1 s( 18.31%)p 4.46( 81.69%)
                                           0.0000  0.0000 -0.1506  0.4003 -0.0105
                                          -0.0006  0.0000  0.0000  0.0000  0.0000
                                           0.0000  0.0000 -0.7062  0.0362  0.0066
                                          -0.0012  0.0000  0.2968  0.4750  0.0559
                                           0.0120
               ( 82.47%)   0.9082* F   2 s(  4.90%)p19.40( 95.10%)
                                           0.0000 -0.2213 -0.0059  0.0005  0.0000
                                           0.0000  0.0000  0.9738  0.0021 -0.0012
                                          -0.0510 -0.0005  0.0005
    2. (1.91229) BD ( 1) S   1 - F   3
               ( 28.04%)   0.5296* S   1 s(  8.73%)p10.45( 91.27%)
                                           0.0000  0.0000  0.2410  0.1709 -0.0062
                                          -0.0004  0.0000 -0.7061  0.0378  0.0021
                                           0.0013  0.0000  0.0000  0.0000  0.0000
                                           0.0000  0.0000 -0.5738  0.2870  0.0307
                                           0.0080
               ( 71.96%)   0.8483* F   3 s(  5.01%)p18.95( 94.99%)
                                           0.0000  0.2239 -0.0002 -0.0006  0.7938
                                           0.0006 -0.0010  0.0000  0.0000  0.0000
                                           0.5655  0.0008 -0.0010
    3. (1.82959) BD ( 1) S   1 - F   4
               ( 17.53%)   0.4186* S   1 s( 18.31%)p 4.46( 81.69%)
                                           0.0000  0.0000  0.1506 -0.4003  0.0105
                                           0.0006  0.0000  0.0000  0.0000  0.0000
                                           0.0000  0.0000 -0.7062  0.0362  0.0066
                                          -0.0012  0.0000 -0.2968 -0.4750 -0.0559
                                          -0.0120
               ( 82.47%)   0.9082* F   4 s(  4.90%)p19.40( 95.10%)
                                           0.0000  0.2213  0.0059 -0.0005  0.0000
                                           0.0000  0.0000  0.9738  0.0021 -0.0012
                                           0.0510  0.0005 -0.0005
    4. (1.91229) BD ( 1) S   1 - F   5
               ( 28.04%)   0.5296* S   1 s(  8.73%)p10.45( 91.27%)
                                           0.0000  0.0000 -0.2410 -0.1709  0.0062
                                           0.0004  0.0000 -0.7061  0.0378  0.0021
                                           0.0013  0.0000  0.0000  0.0000  0.0000
                                           0.0000  0.0000  0.5738 -0.2870 -0.0307
                                          -0.0080
               ( 71.96%)   0.8483* F   5 s(  5.01%)p18.95( 94.99%)
                                           0.0000 -0.2239  0.0002  0.0006  0.7938
                                           0.0006 -0.0010  0.0000  0.0000  0.0000
                                          -0.5655 -0.0008  0.0010
   14. (1.99866) LP ( 1) S   1           s( 83.78%)p 0.19( 16.22%)
                                           0.0000  0.0000  0.9152  0.0157 -0.0001
                                           0.0000  0.0000  0.0000  0.0000  0.0000
                                           0.0000  0.0000  0.0000  0.0000  0.0000
                                           0.0000  0.0000  0.4020  0.0260 -0.0023
|
The axial S-F bonds seem to have less electron density that equatorial S-F bonds whereas the lone pair holds 2 electrons precisely. Fluorine atoms are highly electron withdrawing so that almost 75% of electron density is pulled towards them. The hybridization of the sulfur is hard to determine yet a qualitative way to approach it is to assume that see-saw geometry mimics trigonal bipyramidal and therefore sulfur is sp3d hybridized. However, it is important to avoid sulfur 3d orbital participation and better model would be a 3c-4e- description of the axial F-S-F bond.
References
- ↑ F. Albert Cotton, Donald J. Darensbourg, Simonetta Klein, and Brian W. S. Kolthammer, Inorg. Chem., 21, (1982), p294-299
- ↑ Dennis W. Bennett, Tasneem A. Siddiquee, Daniel T. Haworth, Shariff E. Kabir and Farzana Camellia. J. Chem. Cryst., 34 (6) (2004) p353-359
- ↑ F. Albert Cotton, Donald J. Darensbourg, Simonetta Klein, and Brian W. S. Kolthammer,Inorg. Chem., 21, (1982), p294-299. DOI:10.1021/ic00131a055
- ↑ L. Radom and H.F. Schaefer, Aust. J. Chem., 28, 1975, p294-2992069-2072
- ↑ C.V. Berney, J. Mol. Structure, 12, 1972, 87-97
- ↑ 6.0 6.1 A.H. Cowley, M. Lattman, M.L. Walker, J. Am. Chem. Soc., 101-15, 1978, 4074-4080


