Rep:Mod:mp1614MgO
The Thermal Expansion of MgO
Introduction
Studying vibrations is important as it allows us to determine the properties of various materials and assess their suitability for use in a specified role. Modelling vibrations allows us to determine important properties of a sample such as phase transitions, thermal conductivity, superconductivity and the free energy. This experiment aimed to use computer simulations in order to model the thermal expansion of a crystal of magnesium oxide (MgO) and determine the value of its thermal expansion coefficient , where is given by an equation with the form
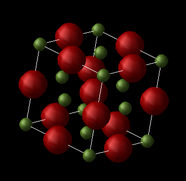
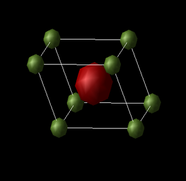
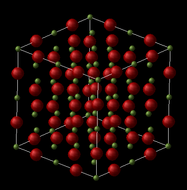
MgO is an ionic compound consisting of ions of Mg2+ and O2- being held together in a crystalline structure by electrostatic forces. The crystal structure of MgO can be described as a face centered cubic (fcc) lattice of Mg2+ ions with O2- ions occupying all the octahedral holes. While the structure can be represented as an fcc conventional cell as shown, an alternative representation is that of the primitive cell, which can be used to generate the whole crystal solely by translation of the rhombohedron cell. MgO can also be shown in a supercell representation, in which 64 atoms are found, compared to the 8 atoms in the conventional cell, and 2 in the primitive cell.
 |
 |
 |
|---|
Translation of the primitive cell along the principle axes provides us with the entire crystal structure, and this periodic repetition of structure also means that the local physical properties are invariant under translation of the cell. This means we can re-write the properties in terms of a Fourier series which takes into account the periodic nature of the crystal, allowing us to define the cell in reciprocal space, where the reciprocal space representation is the Fourier transform of the real-space lattice. The reciprocal representation is also known as k-space, where k is the wave vector whose value represents different combinations of the atomic orbitals that produce the final reciprocal space representation, and is defined in 3D by its value in the x, y, and z directions, as shown.
In the case of modelling the thermal expansion of MgO, we are interested in the vibrations, and by using the reciprocal representation of the crystal we can define a relationship between the vibrational frequency,, and k.
When atoms in a crystal vibrate, they do so collectively, and these coupled vibrations in crystals are called phonons, which are essentially discrete units of vibrational mechanical energy, similar to how photons are discrete units of light energy. This definition allows us to describe the vibrational states in a crystal as a phonon dispersion that varies with different values of k. A k-value exists for every possible vibration of the crystal, and these vibrations can be counted by summing over k. As the value of k increases the frequency of vibration increases.
To model the thermal expansion of MgO, and hence obtain a value for , two different models will be used. The first is the quasi-harmonic approximation model, and the second model is one based on molecular dynamics.
The quasi-harmonic approximation model is based upon the harmonic phonon model of lattice dynamics, in which all interatomic forces are said to be purely harmonic. However, in the quasi-harmonic approximation, phonon frequencies are treated as volume dependent in order to account for thermal effects, thus allowing the value of the thermal expansion coefficient to be found. The molecular dynamics model involves allowing a group of atoms/molecules to interact for a fixed period of time to view how the system dynamically evolves. Properties such as interatomic forces are calculated by numerically solving Newton's equations of motion for the system of interacting atoms/molecules. This model essentially simulates the motions of the atoms in the real material, but it does not rely on the harmonic approximation.
As the quasi-harmonic is based on quantum mechanics, its thermodynamic properties must take the results of quantum mechanics into account, as seen in the equation for Helmholtz free energy, which takes into account the zero-point energy of the system as shown:
in which is the internal energy of the crystal lattice, is the vibrational zero-point energy , is the temperature, is the volume and is the entropy. Molecular dynamics does not include a term for the zero-point energy due to it being based on classical mechanics.
Results and Discussion
The phonon modes of MgO
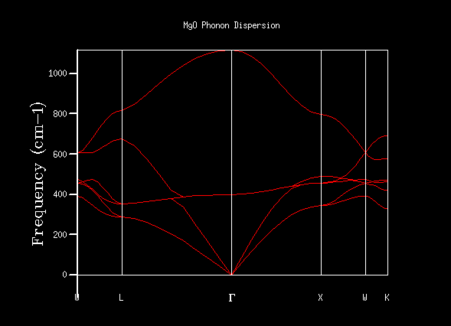
In order to find how many vibrational states exist at the k-points in the crystal along with their energies, the phonon dispersion graph was produced using a simulation. By looking at the curve produced in the graph, the effect of changing the chosen k-point on the vibrations and their corresponding energies can be seen, with the energies of the vibrations at certain symmetry points shown below.
 |
 |
 |
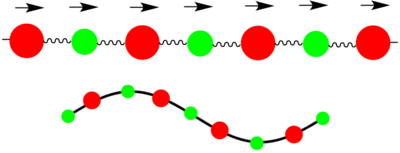
Two types of phonons can be seen in dispersion relationships for crystal structures such as MgO which have 2 or more atoms in their primitive cell. These two types of phonons are either optical or acoustic, and result in optical and acoustic branches in the phonon dispersion curve. Optical phonons are a result of out-of-phase vibrations between neighbouring atoms in the crystal lattice, with the 'optical' part of the name arising from the fact that they can be excited by electromagnetic radiation due to one atom moving in one direction while the next atom moves in the opposite direction. Acoustic phonons result from in-phase vibrations of the neighbouring atoms, with the 'acoustic' part arising from the long wavelength vibrations these phonons give rise to.[1] These vibrations can be visualised as seen in the diagram above.
In order to optimise the grid size for consequent calculations using the quasi-harmonic approximation, graphs for the density of states (DOS) were produced. As the grid size used in the calculations was increased, the resolutions of the graphs increases, with greater detail being found for grid sizes of 32x32x32 and 64x64x64. As the graph produced by the 32x32x32 grid size shows the same amount of detail as the graph for a 64x64x64 grid, the 32x32x32 grid was used in all calculations in the quasi-harmonic model due to it requiring less processing power and time to run. The trend shown for increased detail as grid size increases is to be expected, as when the grid size is increased, a greater number of points in k-space are sampled and used to calculate the DOS. For a grid size of 1x1x1, the k-point used to compute the DOS corresponds to (1/2,1/2,1/2), which is given the critical point label L. The DOS curves are related to the phonon dispersion curve by their frequencies, with the peaks at certain frequencies corresponding to a particular k-value on the phonon dispersion graph.
| Grid size | DOS graph | Grid size | DOS graph |
|---|---|---|---|
| 1x1x1 | 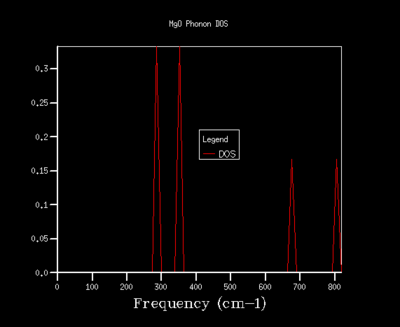 |
8x8x8 | 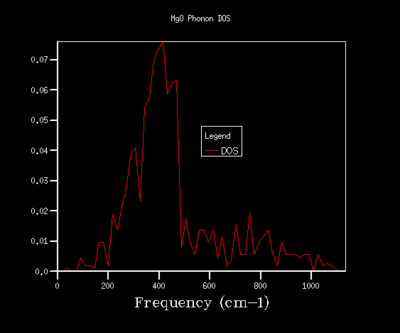 |
| 2x2x2 | 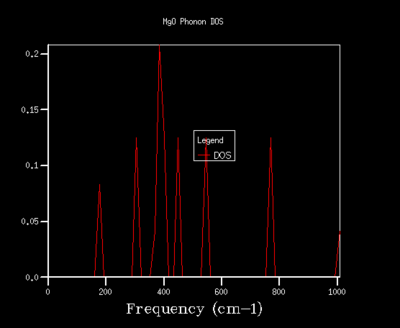 |
16x16x16 | 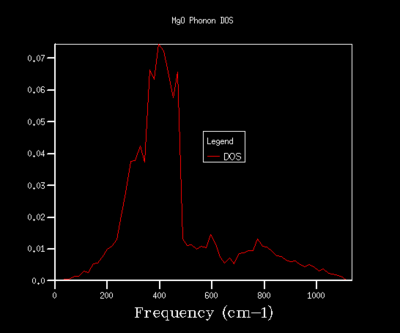 |
| 3x3x3 |  |
32x32x32 | 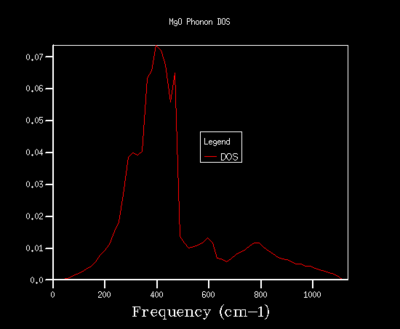 |
| 4x4x4 | 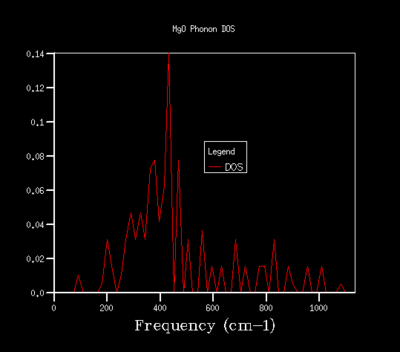 |
64x64x64 |  |
By using the results of these calculations, it is possible to determine the optimal grid sizes for other crystal structures. For similar oxides such as CaO, the same grid size as used for MgO (32x32x32) would be the optimum as its primitive cell would be similar to that of MgO. For a zeolite such as Faujasite, a smaller grid size could be used to produce a detailed DOS graph. This is due to the fact that Faujasite has a much larger primitive cell than MgO, with a lattice parameter of 24.7 Å compared to a value of 4.212 Å for MgO. Therefore, the cell in reciprocal space will be smaller than the cell of MgO in reciprocal space, meaning less points in k-space need to be sampled and hence a smaller grid size should provide a detailed description of the DOS. If we were to perform calculations on a simple metal such as lithium, it is also expected that a larger grid size than that used for MgO, due to the primitive cell for lithium being smaller in real space, meaning its cell in reciprocal space will be larger and therefore more k-points will be needed to gain a higher accuracy.
The free energy of MgO
As the grid size is increased and more points in k-space are sampled, the Helmholtz free energy can be seen to increase. To achieve calculations accurate to 1 meV a grid size of 32x32x32 should be used. To achieve an accuracy of 0.1 meV, a grid size of 64x64x64 should be used. For an accuracy of 0.5 meV a grid size between 32x32x32 and 64x64x64 should be used.
| Grid size | Helmholtz Free Energy (eV) |
|---|---|
| 1x1x1 | -40.930301 |
| 2x2x2 | -40.926609 |
| 3x3x3 | -40.926432 |
| 4x4x4 | -40.92645 |
| 8x8x8 | -40.926478 |
| 16x16x16 | -40.926482 |
| 32x32x32 | -40.926483 |
| 64x64x64 | -40.926483 |
The Thermal Expansion of MgO: Quasi-Harmonic Approximation
The first model used to calculate a value for the thermal expansion coefficient of MgO is the quasi-harmonic model, whereby vibrations in the crystal are simulated using calculations to determine the vibrational energy levels of MgO. This is done by using the DOS and phonon dispersion for MgO to calculate the energy levels. The effect of changing temperature on the Helmholtz free energy, lattice constant, and cell volume can be seen below.
| Temperature (K) | Helmholtz Free Energy (eV) | Lattice constant (Å) | Cell volume (ų) |
|---|---|---|---|
| 0 | -40.90190629 | 2.986563 | 18.836496 |
| 100 | -40.90241981 | 2.986657 | 18.838266 |
| 200 | -40.90937745 | 2.987604 | 18.856201 |
| 300 | -40.92812483 | 2.98939 | 18.890024 |
| 400 | -40.95859432 | 2.991629 | 18.932507 |
| 500 | -40.99943614 | 2.994134 | 18.98011 |
| 600 | -41.04931565 | 2.99682 | 19.031221 |
| 700 | -41.10711950 | 2.999643 | 19.085057 |
| 800 | -41.17189216 | 3.002587 | 19.141316 |
| 900 | -41.24301846 | 3.005634 | 19.199638 |
| 1000 | -41.31984872 | 3.008783 | 19.260042 |
 |
 |
 |
|---|
The Helmholtz free energy can be seen to decrease as temperature increases, which is to be expected just from looking at the equation for the Helmholtz free energy in the quasi-harmonic approximation, specifically the final term. Increasing temperature leads to the final term becoming larger as entropy also increases due to its temperature dependency, hence the obtained value of free energy becoming more negative. The lattice parameter shows the opposite trend to the Helmholtz free energy, increasing with temperature. The cell volume also shows this trend of increasing with increasing temperature, simply due to it being the lattice constant raised to the power of 3. Using the graph of Cell volume vs Temperature, a value for
can be obtained from the gradient of the line of best fit, and when substituted back into the equation for , a thermal expansion coefficient of 2.6010x10⁻⁵ K-1 is found. The calculated value is fairly similar to the literature value of the thermal expansion coefficient, which was found to be 3.706x10⁻⁵ K-1. [2]
The main approximations in these calculations include assuming that the interatomic potential can be modelled using a Morse potential, and that the Mg2+ and O2- ions can be represented as charged hard spheres without taking into account the electrons. It is also assumed that the crystal is perfect and has no defects or impurities which affect its physical properties. Other approximations include treating vibrations in the crystal as if they did not interact, and taking the crystal system to be equivalent to a collection of independent harmonic oscillators, the energies of which can be described by a quadratic function.
The physical origin of thermal expansion arises from an increasing temperature resulting in the increase in the average amplitude of atomic vibrations. For an anharmonic interaction potential, this corresponds to the increase in the average value of interatomic separation leading to thermal expansion. For a diatomic molecule with an exactly harmonic potential, the bond length would not increase with temperature and there would be no thermal expansion as the average value of interatomic separation does not change.
As the temperature approaches the melting point of MgO (3,125 K), the phonon modes would not represent the actual ion movements fairly well, as the quasi-harmonic approximation does not allow bonds to break, and would simply model the crystal as if it still expanded once the melting point had been reached.
The Thermal Expansion of MgO: Molecular Dynamics
The second model used to calculate the thermal expansion coefficient of MgO is the molecular dynamics model, in which vibrations in the crystal are simulated by giving the atoms velocities, allowing them to move, and then numerically solving the equations of motion for each of the atoms in the crystal cell. Due to the classical treatment of the system, a larger cell is needed in order to take into account the fact that the movement of atoms is no longer periodic. Therefore a supercell of MgO containing 32 MgO units is used in the calculations instead.
As for the quasi-harmonic model, we can plot a graph of Temperature against Cell volume in order to work out a value for the thermal expansion coefficient using the gradient. The thermal coefficient value given by the molecular dynamics model is 3.2643x10⁻⁵ K-1. This value is much more similar to the literature value than the value calculated using the quasi-harmonic model.
 |
|---|
By plotting the change of cell volume with temperature for both the models used, it can be seen that the both quasi-harmonic and molecular dynamics show the same trend of cell volume increasing with temperature. The results for both models seem to agree most at around 800 K where both trend lines coincide. One reason for the variation in trends for both models lies in the fundamental way both models operate. Molecular dynamics involves random motion of atoms and thus requires a supercell to allow us to observe long-wavelength fluctuations in atomic movements and produce all the possible vibrations. The quasi-harmonic model meanwhile, models the vibrations using harmonic oscillators which can be described by periodic functions and only requires a primitive cell.
 |
|---|
Conclusion
The quasi-harmonic and molecular dynamics models both provided values for the thermal expansion coefficient for MgO which were fairly similar to the value found in literature, with the coefficient found using the molecular dynamics model showing more agreement to the literature value than the value obtained using the quasi-harmonic model.
To determine an optimal grid size to use in the calculations needed by the quasi-harmonic model, the phonons of MgO were computed by producing the phonon dispersion curve in order to observe information about the number of vibrational states at various points in k-space in the crystal and corresponding energies. DOS curves were then generated for a range of grid sizes, with grids of 32x32x32 and 64x64x64 giving the curves of similar detail, leading a size of 32x32x32 being used in all calculations in the quasi-harmonic model due to it requiring less computing power to run, yet still giving a high amount of detail. The results obtained from this model fit the expected results, namely the trends of an increase in temperature leading to a lowering of the Helmholtz free energy and increase in the lattice constant and cell volume.
The molecular dynamics model relies on treating MgO classically, by solving the equations of motion to determine the volume of expansion. For this model, it was not necessary to compute the phonons to determine an optimal grid size due to this classical treatment. The results obtained from using this model showed the trend of an increase in temperature causing an increase in cell volume. When compared to the changes in cell volume determined using the quasi-harmonic model, both trend lines are quite similar but differ at higher and lower temperatures which reflect the different approaches both models take. At low temperatures such as 0 K, the molecular dynamics model is not able to produce a value for the final cell volume, whereas the quasi-harmonic model can. At high temperatures, the quasi-harmonic model breaks down due to its inability to take into account the facts that bonds can break, and assumes they still follow harmonic motion. [3] Molecular dynamics does not suffer from this approach, and can account for bonds breaking when calculating the cell volume.
