Rep:Mod:mom780
Week 1
Optimisation of Trigonal Planar Molecules
BH3: B3LYP/3-21G
Optimising a molecule involves finding the bond lengths and bond angles in which the molecule possesses the lowest possible energy. This is done by fixing a position for the nuclei and by solving the Schrödinger equation for the electrons, finding the energy of this particular configuration of nuclei. The nuclei are then moved slightly and the Schrödinger equation solved again. If this energy is found to be lower the system then adopts this configuration until a lower energy system is found. The final output is the equilibrium position for the system, the lowest energy configuration.
To optimise a molecule of borane (BH3) in GuassView a molecule of (BH3) was created and the B-H bond lengths set at 1.53Å, 1.54Å and 1.55Å. Using the B3LYP method and 3-21G basis set the molecule was optimised. The 3-21G basis set is a particular set of functions to model the system. It is a small basis set and therefore gives less accurate results than using a larger basis set but the calculation runs a lot faster so this is a good starting point.
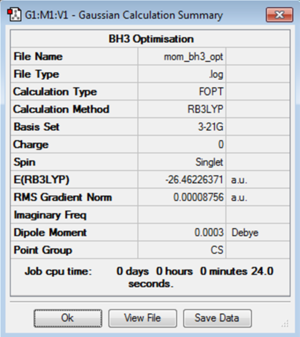
The log file for the BH3 optimisation using 3-21G basis set is File:MOM BH3 OPT.LOG
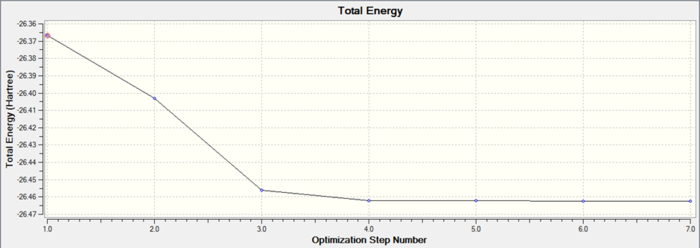
It is very important to check whether the programme has completed the optimisation correctly. This can be done by considering the convergence data. This should state that forces on the molecule have converged and displacing the molecule slightly from the position will not give a change in the overall energy. Differentiating potential energy gives force so at a stationary point it would be expected that the force to be zero, as the gradient at a stationary point is zero. This can be shown in the summary data output that the gradient is zero. The graph below demonstrates the energy convergence of the system. During the optimisation the energy decreases and converges to a value, shown by the graph. The gradient of this graph goes to zero as expected. The minimum energy point of the system is the stationary point in the potential energy curve for the molecule. This finds the stable equilibrium point of the system.
Data for bond lengths and bond angles can then be interpreted from the optimised molecule. The three bond length outputs were found to be 1.19482Å, 1.19467Å and 1.19444Å. The bond angles were found to be 119.998, 120.017 and 119.995 degrees. The output data however only has a certain degree of accuracy which means that the bond lengths are quoted to two decimal places and bond angles to one decimal place. This gives a B-H bond length as 1.19Å and H-B-H bond angle of 120.0 degrees.
BH3: B3LYP/6-31G(d,p)
To get a more accurate optimisation of BH3 a larger basis set can be used. This optimisation of BH3 was calculated with the same B3LYP method but instead with the 6-31G(d,p) basis set. This gave a different energy output to the first calculation with the smaller basis -26.62a.u. in comparison to -26.46a.u. The energy that the system calculates is dependent upon the functions used in the basis sets so this means two energies calculated with different basis sets cannot be directly compared. Absolute energies therefore don't mean a lot on their own. The energy calculated can be used in comparisons and calculations of energy differences when the same basis set is used but not otherwise.
Again it is important to check that the system has converged, which it did and is shown below.
| Jmol | Convergence Data | Calculation Summary | |||
|---|---|---|---|---|---|
|
Item Value Threshold Converged? Maximum Force 0.000012 0.000450 YES RMS Force 0.000008 0.000300 YES Maximum Displacement 0.000066 0.001800 YES RMS Displacement 0.000039 0.001200 YES |

|
The log file for the second BH3 optimisation, using the 6-31G(d,p) basis set is File:MOM BH3 OPT 631G(DP).LOG
GaBr3: B3LYP/LanL2DZ
Due to the large nature of the gallium and bromine atoms in GaBr3 the method of pseudopotentials is used. This is a method where the inner electrons of large atoms are modelled such that their energy is the same regardless of the bonding. Only the valence electrons are considered to be involved in the bonding. This is especially important in calculations involving large molecules as it simplifies considerably the calculations where all electrons are considered. This is however an approximation and it has been reported[1] that the technique doesn't always give the accuracy necessary.
Here the molecule GaBr3 is optimised. The symmetry is set to D3h point group before the optimisation is run, with a high tolerance. This keeps the symmetry as D3h during the optimisation calculation. The LanL2DZ basis set was used for this calculation, using pseudo-potentials.
| Jmol | Convergence Data | Calculation Summary | |||
|---|---|---|---|---|---|
|
Item Value Threshold Converged? Maximum Force 0.000000 0.000450 YES RMS Force 0.000000 0.000300 YES Maximum Displacement 0.000003 0.001800 YES RMS Displacement 0.000002 0.001200 YES |

|
The link to the D Space for the optimisation of GaBr3 is DOI:10042/31159
BBr3: B3LYP/6-31G(d,p)LANL2DZ
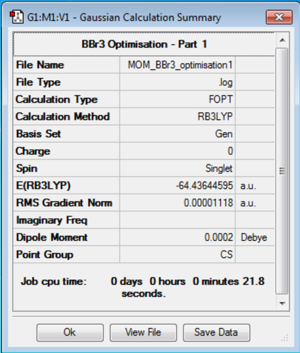
The optimising of a molecule of BBr3 requires the use of both full basis sets for the smaller boron atom and also pseudopotentials for the larger bromine atoms. Here the 6-31G(d,p) basis set was used and also the LANL2DZ pseudopotential for the bromine atoms.
| Jmol | Convergence Data | Calculation Summary | |||
|---|---|---|---|---|---|
|
Item Value Threshold Converged? Maximum Force 0.000024 0.000450 YES RMS Force 0.000010 0.000300 YES Maximum Displacement 0.000154 0.001800 YES RMS Displacement 0.000074 0.001200 YES |
|
The link to the D Space for the optimisation of BBr3 is DOI:10042/31162
Analysis of Results
The equilibrium bond lengths and bond angles for the three molecules BH3, BBr3 and GaBr3 were found from the optimisation calculations and are shown in the table below. All the molecules are trigonal planar and adopt a bond angle of 120° however the bond lengths vary.
| BH3 | BBr3 | GaBr3 | |
|---|---|---|---|
| r(E-X) / Å | 1.19 | 1.93 | 2.35 |
| θ(X-E-X) / ° | 120.0 | 120.0 | 120.0 |
There are a number of things to consider when analysing the length of a chemical bond. A stronger covalent bond often correlates with a shorter equilibrium bond distance so bond strength is important, as well as the size of the atoms involved in the bonding. The choice of ligand, in this case hydrogen or bromine has an effect on the strength of the bond. Size is important here, bromine is much larger than hydrogen so has much more diffuse orbitals. This means that the orbital overlap will be weaker and so the bond also will be weaker and longer. This is shown as the bond length of BBr3 is greater than BH3. Back-donation is an effect that is important in BBr3. The boron centre is lewis acidic and so the bromine can donate some electron density into the empty p-orbital on the boron atom. This strengthens the B-Br bond. This cannot occur for BH3 as hydrogen has no filled p-orbitals to be able to donate electrons to the boron centre. This effect doesn't however overcome the effect that size has on the bond length, it only makes the B-Br bond slightly shorter.
The central atom also has an effect on the length of the bond. Boron and gallium are both group three elements but gallium is substantially larger than boron, giving a greater Ga-Br bond length. The larger size also means that the orbitals on gallium are more diffuse. This causes poorer overlap and contributes to the reason why the Ga-Br bond is weaker than the B-Br bond.
A bond is essentially the sharing of electrons between atoms. This could be anywhere between purely ionic, where one electron is transferred completely from one atom to another or purely covalent where two atoms equally share an electron. However chemical bonding is more complicated than this simplistic picture. Chemical bonds cannot just be considered as 2 centre - 2 electron bonds or even the more complex systems of multiple centre bonding. The more accurate picture is to model a cloud of electrons that cover the entire molecule. Here distinct bonds don't exist, instead the bonding is spread throughout the molecule.
It is therefore difficult to define where a bond exists. In Guassview a bond is considered to have formed if the atoms are below a certain distance apart. There are however bonding interactions that take place at longer distances, such as hydrogen bonding. Here there is definitely a bonding interaction between atoms but not necessarily at a short enough distance for this to be considered a bond in the Gaussview software.
When considering the strength of covalent bonds it is important to consider size of the atoms, orbital overlap and factors such as electronegativity. H-H is one of the strongest single covalent bonds at around 430KJ/mol. This is because the hydrogen atoms are very small so the centres can approach eachother very closely, giving a strong bond. A particularly weak covalent bond is the I-I bond at 150KJ/mol. This is because the iodine atoms are very large with diffuse orbitals. This causes poor orbital overlap and this leads to a weak bond. An intermediate covalent bond is the C-Cl bond (340KJ/mol). Neither atom is particularly large here and the electronegative nature of the chlorine atom pulls the electron density and therefore the carbon atom slightly closer. This strengthens the bond and gives a similar bond strength to a C-C bond(350KJ/mol), even though the chlorine atom is larger than the carbon.
Frequency Analysis
BH3
A frequency analysis is used to make sure the optimisation has found the minimum energy point. It is possible that instead of the energy minimum on the potential curve it has found another stationary point. This can be confirmed by calculating the second differential at the stationary point found. This corresponds to the frequency. If the frequency outputs are all positive it can be said that the minimum energy has been found and optimisation has successfully found the minimum energy state. However if there are one or more negative frequencies in the output it could be that instead a transition state has been found or that optimisation has not been successful.
It is important that the molecule has the correct symmetry before running a frequency analysis. Therefore here the optimisation of BH3 was rerun so that it had D3h symmetry after optimisation. The optimisation was run with the B3LYP method and 6-31G(d,p) basis set as before. It is again important to use the same method and basis set for carrying out the optimisation and the frequency analysis as energies that have been calculated with different basis sets cannot be compared. The frequency analysis is studying the output from the optimisation so if a different basis set is used the results will be meaningless.
| Jmol | Convergence Data | Calculation Summary | |||
|---|---|---|---|---|---|
|
Item Value Threshold Converged? Maximum Force 0.000015 0.000450 YES RMS Force 0.000010 0.000300 YES Maximum Displacement 0.000058 0.001800 YES RMS Displacement 0.000038 0.001200 YES |

|
The log file for the optimisation of BH3 with D3h symmetry is File:MOM BH3 FREQUENCY.LOG
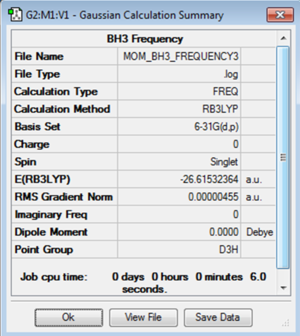
The frequency analysis was then run on the optimised structure of BH3 with D3h symmetry. The output energy should be compared to the energy of optimisation to make sure the energy of the molecule has remained the same. Here it is exactly the same and the point group was maintained during the optimisation. It is then important to consider the 'low frequencies' output. In a non-linear molecule there are 3N-6 modes of vibration. In a trigonal planar molecule with four atoms, such as BH3, it is expected that there will be six vibrational modes. The first six given in the table of low frequencies are the six vibrational modes of the centre of mass. These should therefore all be zero. If the difference between the greatest and smallest is greater than fifteen it is considered too large and the optimisation should then be run again. The closer to zero these are, the better the optimisation.
| Low Frequency Data / cm-1 | Summary Data |
|---|---|
Low frequencies --- -13.9036 -13.8989 -9.9793 -0.0006 0.0183 0.3607 Low frequencies --- 1162.9564 1213.1268 1213.1270 |
|
The log file for the frequency analysis of BH3 is File:MOM BH3 FREQUENCY3.LOG
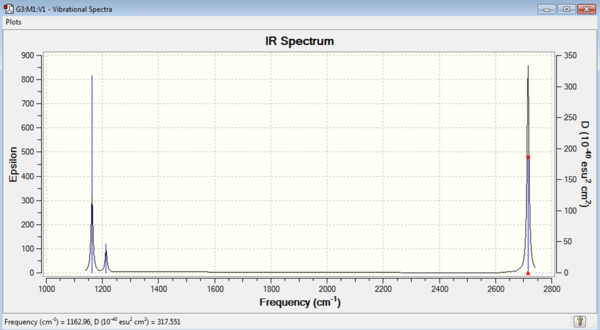
| Mode no. | Frequency | Intensity | Type | IR active |
|---|---|---|---|---|
| 1 | 1163 | 93 | Bend | Yes |
| 2 | 1213 | 14 | Bend | Low |
| 3 | 1213 | 14 | Bend | Low |
| 4 | 2583 | 0 | Stretch | No |
| 5 | 2716 | 126 | Stretch | Yes |
| 6 | 2716 | 126 | Stretch | Yes |
The frequency outputs are shown on the table on the right. All the frequencies are positive so the optimisation has successfully found a minimum. An IR can be plotted using these output frequencies and their intensities. Not all of the frequencies are IR active. This is because for a vibrational mode to be IR active there must be a change in dipole in the molecule. If there is no change in dipole the frequency won't be visible on the IR spectrum as can be seen by the stretch at 2583 cm-1. This stretch is completely symmetric and therefore there is no change in dipole moment and the stretch isn't visible.
GaBr3
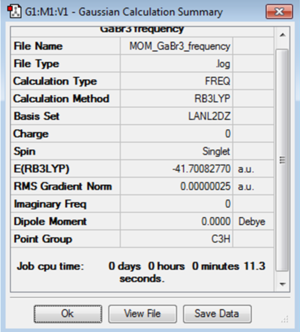
The same method can be carried out for confirming that optimisation has been successful for GaBr3. The frequency analysis method used was B3LYP and the basis set 6-31G(d,p). The point group for GaBr3 was already set to D3h before optimisation so there was no need to rerun the optimisation here. The low frequencies have a very small range around zero as shown in the table below which suggests a good optimisation.
| Low Frequency Data / cm-1 | Summary Data |
|---|---|
Low frequencies --- -1.4878 -0.0015 -0.0002 0.0096 0.6540 0.6540 Low frequencies --- 76.3920 76.3924 99.6767 |
|
The link to the D Space for the frequency analysis of GaBr3 is DOI:10042/31231
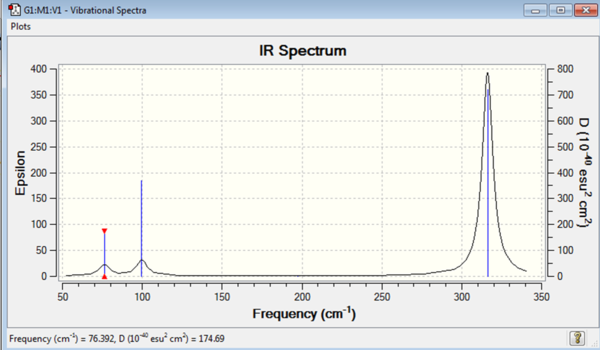
| Mode no. | Frequency | Intensity | Type | IR active |
|---|---|---|---|---|
| 1 | 76 | 3 | Bend | Low |
| 2 | 76 | 3 | Bend | Low |
| 3 | 100 | 9 | Bend | Low |
| 4 | 197 | 0 | Stretch | No |
| 5 | 316 | 57 | Stretch | Yes |
| 6 | 316 | 57 | Stretch | Yes |
All the frequencies give a positive output so a minimum energy point has been found during the optimisation.
Analysis of Results
Both IR spectra of BH3 and GaBr3 have the expected six vibrational modes. 3N-6=6 as N in both of these cases is four. The frequency at the which these vibrational modes are found is however very different. The range for the GaBr3 vibrational modes is from 76cm-1 to 316cm-1 whereas for BH3 the range is from 1163cm-1 to 2716cm-1. The frequency at which the vibrational mode occurs is dependent upon the energy of the vibration as E=hν. The vibrations of the B-H bonds are therefore more energetic than the vibrations of the Ga-Br bonds. This makes sense as the bond strength of the B-H bond is much greater than the bond strength of the Ga-Br bond.
The types of vibrations in both BH3 and GaBr3 are the same and both show that the three vibrational 'bends' occur at lower frequencies than the 'stretches'. The order that the modes occur though is different. In BH3 the lowest energy vibrational mode is the umbrella motion 'bend'. Considering the displacement vectors for this particular mode shows that the greatest displacement occurs for the hydrogen atoms and the boron in the centre doesn't move much during the vibration. In GaBr3 this umbrella motion is instead the third vibrational mode, above the degenerate scissoring and rocking motion. Here the greatest displacement vector for the motion comes from the Gallium atom in the middle. The lower vibrational modes have the greatest movement from the bromine during the vibration. The gallium centre is larger and heavier than the bromine ligands so a greater energy is required to move the gallium than the bromine. This corresponds to a higher frequency at which the vibration occurs. This also explains the difference in order of vibrational modes in BH3 and GaBr3. The umbrella motion occurs at lower energy in BH3 because here it is the smaller and lighter hydrogens that undergo the greatest displacement. In GaBr3, however, the gallium is the atom that undergoes greatest displacement during the vibration and so this occurs at relatively higher frequency.
The stretching modes occur in the same order in both BH3 and GaBr3, with the symmetric stretch being lower in energy than the degenerate asymmetric stretches. The other difference between the spectra are the intensities of the vibration. The vibrations of the BH3 molecule occur at much greater intensities than the vibrations of GaBr3. The intensity of the stretch in the IR is dependent upon the extent of the change in dipole during the vibration. In BH3 the displacements of the atoms during the vibration are large and this leads to a large change in dipole and therefore a greater intensity on the IR. In GaBr3 the displacements are smaller and the change in dipole much less. The extent of the displacement of the atoms in the molecule is dependent upon the energy supplied to the vibration. As the energies at which the vibrations occur for GaBr3 are lower and the atoms are heavier the displacements will be less. This explains the smaller intensities inthe IR of GaBr3 compared with BH3.
Molecular Orbitals of BH3
The molecular orbitals for BH3 can be calculated using Gaussian and then these compared to the orbitals predicted by the linear combination of atomic orbitals. This is shown in the diagram below.
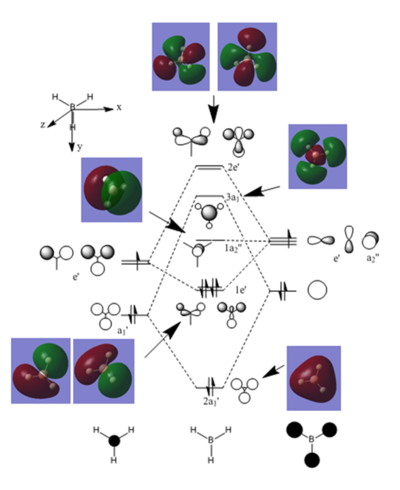
The link to the D Space for the MO calculations for BH3 is DOI:10042/31232
The first MO calculated doesn't appear on MO diagram. This is because it is a core orbital and far too low in energy to contribute to the bonding. Only valence orbitals appear on the LCAO MO diagram. LCAO theory predicts degeneracy in two of the orbitals. The calculations also produce degenerate orbitals of similar shape to as those predicted by LCAO.
The LCAO approach gives much more distinct shaped orbitals, based on the atomic orbitals from the contributing atoms. The molecular orbitals calculated by Gaussian show that actually the electron density spreads across the entire molecule. Comparing the calculated molecular orbitals to the LCAO MOs shows that the LCAO gives an approximate shape for the orbitals and does manage to place them in the correct order of energy. It is therefore useful as an initial approach to predict the MOs for a molecule. However if a more accurate picture is necessary the calculations should be performed to find the shape of the molecular orbitals spread over the whole molecule.
NH3
Optimisation
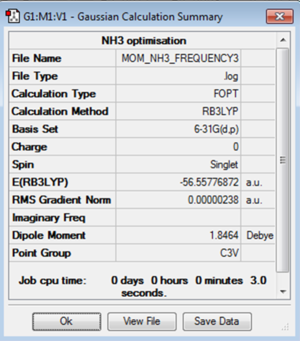
Using the B3LYP and 6-31G(d,p) basis set the ammonia molecule was optimised. For this optimisation the point group was set to C3v. The bond length was found to be 1.02Å and the bond angle 105.8°.
| Jmol | Convergence Data | Calculation Summary | |||
|---|---|---|---|---|---|
|
Item Value Threshold Converged? Maximum Force 0.000024 0.000450 YES RMS Force 0.000012 0.000300 YES Maximum Displacement 0.000079 0.001800 YES RMS Displacement 0.000053 0.001200 YES |
|
The log file for the optimisation of NH3 is File:MOM NH3 OPTIMISATION.LOG
Frequency Analysis
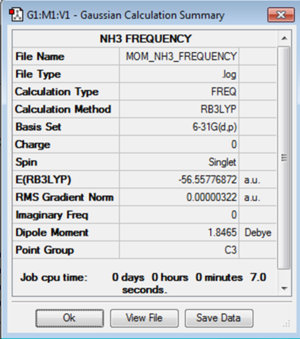
To check that the optimisation had found a minimum in the potential energy curve a frequency analysis was carried out. The low frequencies were in the range of 15cm-1 as required and the six vibrational frequencies found were all positive. This confirms that the minimum energy configuration for the molecule has been found.
| Low Frequency Data / cm-1 | Summary Data |
|---|---|
Low frequencies --- -13.9036 -13.8989 -9.9793 -0.0006 0.0183 0.3607 Low frequencies --- 1162.9564 1213.1268 1213.1270 |
|
The log file for the frequency analysis of NH3 is File:MOM NH3 FREQUENCY.LOG

| Mode no. | Frequency | Intensity | Type | IR active |
|---|---|---|---|---|
| 1 | 1089 | 145 | Bend | Yes |
| 2 | 1694 | 14 | Bend | Low |
| 3 | 1694 | 14 | Bend | Low |
| 4 | 3461 | 1 | Stretch | No |
| 5 | 3590 | 0 | Stretch | No |
| 6 | 3590 | 0 | Stretch | No |
The IR spectrum above shows the characteristic N-H bend that would be expected at around 1600cm-1 experimentally. The characteristic stretch at around 3500cm-1 isn't shown computationally whereas this would be expected to been seen in experiment. This is due to the symmetry of the stretch. Computationally the prediction is that there isn't a change in dipole of the molecule significant enough for the stretch to show on the IR. In reality however the stretches do appear.
MOs
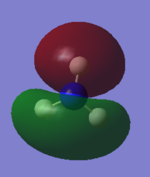
The first six molecular orbitals of NH3 are shown below with their energies. These are the molecular orbitals up to the LUMO, at 0.080a.u. The first orbital at -14.31a.u. is a core orbital. It corresponds to the 1s orbitals and is so low in energy that it has no effect on any of the bonding in the molecule. The other orbitals are involved with the bonding in the molecule. The two orbitals at -0.45 a.u. are degenerate and are bonding orbitals. The orbital at -0.25a.u. is the HOMO and contains two electrons. The LUMO is the first antibonding orbital and has energy of 0.08a.u.
| Orbital Energy Level | Orbital Image | |
|---|---|---|
| -14.31 | 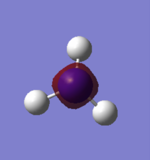
| |
| -0.84 | 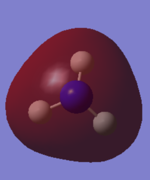
| |
| -0.45 |  |
|
| 0.080 | 
|
The log file for the MO calculations of NH3 is File:MOM NH3 MOs.chk
Natural Bond Orbital Analysis (NBO) NH3
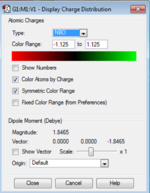
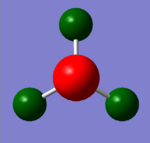
NBO (Natural Bond Orbital Analysis) is a way of viewing the bonding between the atoms in the structure as two centre - two electron bonds rather than orbitals over the whole structure. It calculates the charge on each atom in the molecule and this is shown for ammonia pictorially in the image below. The charge on the hydrogen is +0.375 and the charge on the nitrogen is -1.125. This is as expected as the nitrogen is more electronegative than the hydrogen. The bond is polarised with the negative charge on the nitrogen and the positive charge on hydrogen with no overall charge on the molecule.
 |
|
| NH3 Charge Distribution | NH3 NBO |
The log file for the NBO calculations of NH3 is File:MOM NH3 MOS.LOG
The NBO analysis also calculates the bond orbital coefficients. This gives the localisation of the charge on each atom in the bond. For ammonia this shows that 69% of the bond is localised on the nitrogen and 31% on hydrogen. This is also due to the electronegativity of the nitrogen and describes the extent of polarisation of the nitrogen-hydrogen bond. The hybridisation of the bonding is also described by the NBO analysis. It shows that the contribution from the nitrogen atom in the N-H bond is split between 25% from the nitrogen 2s orbital and 75% by the nitrogen 2p orbital. The nitrogen can therefore be considered to be sp3 hybridised.
NH3BH3
Optimisation
A more complicated example would be to optimise a molecule such as ammonia-borane. Here there is a dative bond between the nitrogen and boron atoms. This can be considered as the nitrogen 'donating' a pair of electrons to the boron atom. By finding the lowest energy configuration of the molecule and comparing this to the energies of the separate BH3 and NH3 molecules the nature of the bonding can be investigated.
The molecule was optimised using the B3LYP method and 6-31G(d,p) basis set. The point group of the molecule was set to be C3V.
| Jmol | Convergence Data | Calculation Summary | |||
|---|---|---|---|---|---|
|
         Item               Value     Threshold  Converged?
 Maximum Force            0.000002     0.000015     YES
 RMS     Force            0.000001     0.000010     YES
 Maximum Displacement     0.000009     0.000060     YES
 RMS     Displacement     0.000002     0.000040     YES
|

|
The log file for the NH3BH3 optimisation isFile:MOM BH3NH3 OPTIMISATION1.LOG
Frequency Analysis
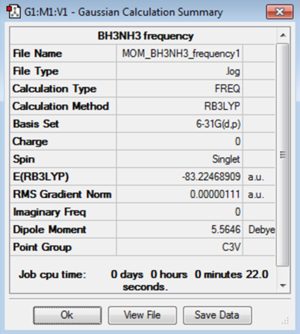
A frequency analysis was then performed to confirm that a minimum had been found. The low frequencies show a small range and the frequencies are all positive which confirm the optimsation was successful and the minimum energy was found.
| Low Frequency Data / cm-1 | Summary Data |
|---|---|
Low frequencies --- -5.3923 -0.3765 -0.0577 -0.0008 0.9370 1.0527 Low frequencies --- 263.2935 632.9557 638.4557 |
|
The log file for the NH3BH3 frequency analysis is File:MOM BH3NH3 FREQUENCY1.LOG
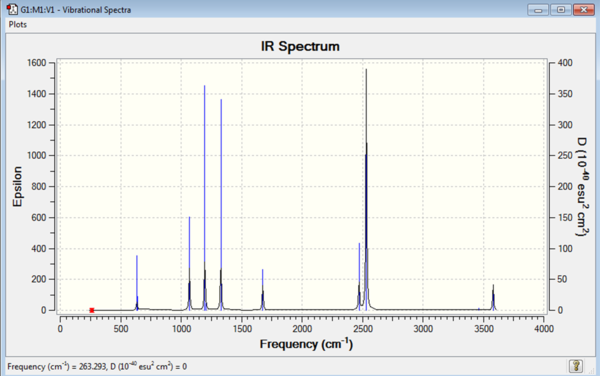
| Mode no. | Frequency | Intensity | Type | IR active |
|---|---|---|---|---|
| 1 | 263 | 0 | Bend | No |
| 2 | 633 | 14 | Stretch | Low |
| 3 | 638 | 4 | Bend | No |
| 4 | 638 | 4 | Bend | No |
| 5 | 1069 | 41 | Bend | Low |
| 6 | 1069 | 41 | Bend | Low |
| 7 | 1196 | 109 | Bend | Yes |
| 8 | 1204 | 3 | Bend | No |
| 9 | 1204 | 3 | Bend | No |
| 10 | 1329 | 114 | Bend | Yes |
| 11 | 1676 | 28 | Bend | Low |
| 12 | 1676 | 28 | Bend | Low |
| 13 | 2472 | 67 | Stretch | Yes |
| 14 | 2532 | 231 | Stretch | Yes |
| 15 | 2532 | 231 | Stretch | Yes |
| 16 | 3464 | 3 | Stretch | No |
| 17 | 3581 | 28 | Stretch | Low |
| 18 | 3581 | 28 | Stretch | Low |
Due to the more complex nature of the molecule there are many more vibrational modes. There are eight atoms in the molecule so 3N-6=18 so 18 vibrational modes are expected and this is what has been calculated.
Bond Dissociation Analysis
It is then possible to calculate the bond dissociation energy for the B-N dative bond. This is due to the fact that the same method (B3LYP) and basis set (6-31G(d,p)) were used for the optimisations of NH3, BH3 and NH3BH3. The energies of the optimal structures can therefore be directly compared.
E(NH3)= -56.56 au
E(BH3)= -26.62 au
E(NH3BH3)= -83.22 au
Energy change in formation of B-N dative bond is:
ΔE=E(NH3BH3)-[E(NH3)+E(BH3)]
ΔE = -83.22 + (26.61+56.56)
ΔE = -0.0526au
=-138KJ/mol
Comparing this the literature value of -115KJ/mol [2] gives an error of 20%. Considering the limitations of the accuracy of the calculations, only accurate to 10KJ/mol which means the literature value lies just outside the error in the calculation. The error here is caused by the basis set that was used to optimise the molecule. Using a larger basis set would give a better optimisation and a more accurate figure for the enthalpy. Considering the strengths of other bonds gives an idea of whether this figure is in the right range. A C-C covalent bond is strong with a bond enthalpy of approximately 350KJ/mol. A dative bond would be expected to be significantly weaker than this, more in the range of the weakest covalent bonds. A bond of similar strength to this is an I-I bond of approximately 150KJ/mol.
Ionic Liquids Project
Part 1: Comparison of selected 'onium' cations
[N(CH3)4]+
Optimisation
A molecule of [N(CH3)4]+ was optimised using the B3LYP method and 6-31G(d,p) basis set. This gave C-N-C bond angles of 109.5° and C-N bond length of 1.51Å. It also gave the H-C-H bond angle of 110.0° and a C-H bond length of 1.09Å. The C-N-C bond angle suggests perfect sp3 hybridisation at the nitrogen centre but slight distortion at the carbon. This could be due to the steric bulk of the -(CH3) groups. This could then lengthen the C-N bond slightly and distort the bond angles of the substituents on the carbon.
| Jmol | Convergence Data | Calculation Summary | |||
|---|---|---|---|---|---|
|
Item Value Threshold Converged? Maximum Force 0.000009 0.000015 YES RMS Force 0.000003 0.000010 YES Maximum Displacement 0.000047 0.000060 YES RMS Displacement 0.000015 0.000040 YES |

|
The log file for the [N(CH3)4]+ optimisation is File:MOM NCH34 OPTIMISATION.LOG
Frequency Analysis
A frequency analysis was carried out on the [N(CH3)4]+ molecule using the B3LYP method and 6-31G(d,p) basis set. This gave small frequencies as the 'low frequencies' which suggests good optimisation. All the frequencies were found to be positive which means that it is a minimum that has been found.
| Low Frequency Data / cm-1 | Summary Data |
|---|---|
Low frequencies --- -5.4142 -0.0620 -0.0381 0.0074 4.8623 4.8958 Low frequencies --- 183.9024 288.5242 289.6094 |

|
The log file for the [N(CH3)4]+ frequency analysis is File:MOM NCH34 FREQUENCY.LOG
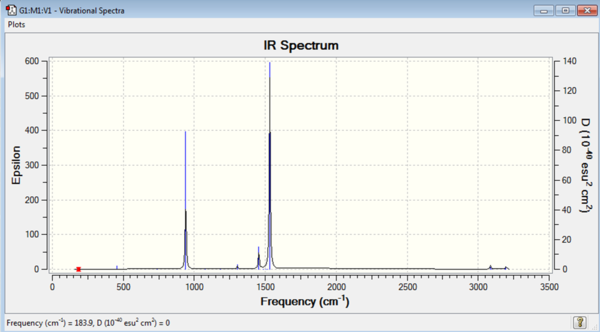 |

|
| [N(CH3)4]+ IR Spectrum | [N(CH3)4]+ IR Vibrations |
MOs
Five of the occupied molecular orbitals of [(CH3)4]+ were chosen and analysed to consider the bonding and antibonding interactions in the ion. The lowest energy core orbitals weren't considered as these orbitals take no part in the bonding of the molecule as they are too low in energy. A selection of other orbitals were chosen which show interesting features. The molecular orbitals can be considered to be comprised of atomic orbitals (LCAO approach) and so these orbitals are mentioned when considering the bonding interactions. The first two orbitals shown are a degenerate pair so therefore must contain the same amount of bonding and antibonding character.
| MO Energy / a.u. | MO Image | Comment |
|---|---|---|
| -0.57934 | 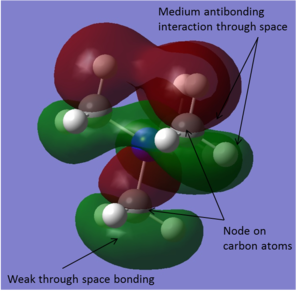
|
This molecular orbital is overall weakly bonding and contains both bonding and antibonding interactions. There are strong through bond bonding interactions where the sp3 hybrid orbitals on the nitrogen and the carbon are interacting to from the C-N bonds. There is also some weak through space bonding character. Here the part of the molecular orbital created from the overlapping sp3 hybrid carbon orbital and hydrogen 1s orbital is quite diffuse so bonding interactions occur in that region. There are nodes on each of the carbon atoms where the phase changes. This means there is a fairly large amount of antibonding character in the molecular orbital. This is made up of the through space antibonding interactions between the different phase atomic orbitals. |
| -0.57934 | 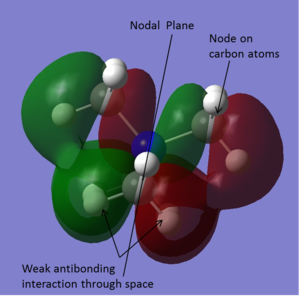
|
This orbital is degenerate with the orbital above. The molecular orbitals however look quite different. This molecular orbital has a plane of symmetry located at the same place as the nodal plane, running through the centre of the molecule. There is through bond bonding interactions at six of the twelve C-H bonds. There is also some weak bonding character through space between the hydrogen atoms. There is however also a fair amount of through space antibonding character. There are nodes on each carbon atom where the plase changes. This means there are antibonding interactions from the lobes of the orbital on either side of the node. |
| -0.58035 | 
|
This is a bonding molecular orbital showing the bonding in the CH3 groups. There are three CH3 groups covered by this molecular orbital and each have a nodal plane running through them, as shown in the diagram. The lobes of the orbitals come from the sp3 hybrid carbon orbitals interacting with the 1s orbitals of hydrogen. These are therefore strong through bond interactions. The lobes are also quite compact and display some antibonding character through space. |
| -0.80746 | 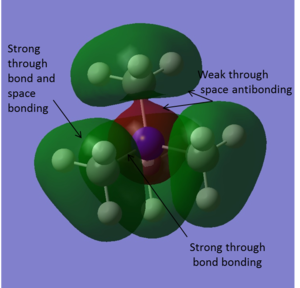
|
This is a strongly bonding molecular orbital. Here the 2s orbital on the nitrogen interacts with the sp3 hybrid orbitals on the carbons. There is a spherical node, not shown in the image, around the nitrogen orbital where there is a change in phase in the molecular orbital. The orbital around the CH3 groups is diffuse. Here there is through bond and through space bonding between the carbon and hydrogen atoms. There is a strong bonding interaction through the C-N bond, where the 2s orbital of the nitrogen overlaps with the sp3 hybridised carbon orbital. There is also some through space antibonding interactions on either side of the spherical node. |
| -0.92556 | 
|
This is a strongly bonding molecular orbital with very low energy. There is a nodal plane that cuts through the centre of the ion, through the nitrogen atom. On the left of the image the part of the orbital shown in green contains two CH3 groups and half of the nitrogen atom. On the other side of the nodal plane the orbital shown in red contains one other CH3 group. The orbital is quite diffuse and includes multiple bonding interactions. There are C-H and C-N through bond bonding interactions. The C-N bonding comes from the sp3 hybridised nitrogen orbitals interacting with the sp3 hybridised carbon orbitals. There is a small amount of antibonding character through space between the two phases of the orbital but this is only a weak interaction. The fourth CH3 group is not contained in the molecular orbital. |
The log file for the [N(CH3)4]+ MO analysis is File:MOM NCH34 MOs.chk
NBO
An NBO analysis was carried out on the molecule giving the charges on the atoms as:
Nitrogen = -0.295
Carbon= -0.483
Hydrogen = 0.269
Images of the charge distribution can be found below in the comparison section.
The log file for the [N(CH3)4]+ NBO calculation is File:MOM NCH34 MOS.LOG
[P(CH3)4]+
Optimisation
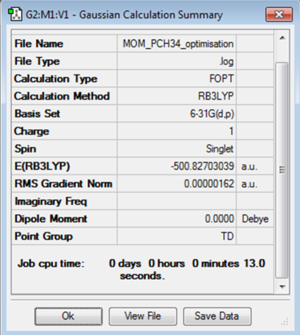
A molecule of [P(CH3)4]+ was optimised using the B3LYP method and 6-31G(d,p) basis set. The C-P-C bond angle was found to be 109.5° and the C-P bond length found to be 1.82Å. The H-C-H bond angle was found to be 109.0° and the C-H bond length as 1.09Å. This shows sp3 hybridisation at the phosphorus giving a perfect tetrahedral structure. At the carbon the hybridisation is slightly distorted from the expected sp3. This could however be just due to the inaccuracy caused by the limitations of the basis set used.
| Jmol | Convergence Data | Calculation Summary | |||
|---|---|---|---|---|---|
|
Item Value Threshold Converged? Maximum Force 0.000003 0.000450 YES RMS Force 0.000001 0.000300 YES Maximum Displacement 0.000012 0.001800 YES RMS Displacement 0.000003 0.001200 YES |
|
The log file for the [P(CH3)4]+ optimisation is File:MOM PCH34 OPTIMISATION.LOG
Frequency Analysis
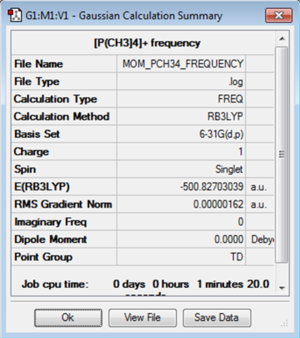
A frequency analysis was carried out on the [P(CH3)4]+ molecule using the B3LYP method and 6-31G(d,p) basis set. The low frequencies here are slightly higher than expected and this is due to the soft vibrational modes that occur. Even though the point group was set with a high tolerance to tetrahedral this optimisation couldn't have found a better structure. A larger basis set would be required to get a better optimisation but here this would mean that comparisons couldn't be made between the three structures.
| Low Frequency Data / cm-1 | Summary Data |
|---|---|
Low frequencies --- 0.0010 0.0030 0.0041 24.7261 24.7262 24.7262 Low frequencies --- 160.0247 194.7666 194.7666 |
|
The log file for the [P(CH3)4]+ frequency analysis is File:MOM PCH34 FREQUENCY.LOG
 |

|
| [P(CH3)4]+ IR Spectrum | [P(CH3)4]+ IR Vibrations |
NBO
An NBO analysis was carried out on the molecule giving the charges on the atoms as:
Phosphorus = 1.667
Carbon = -1.060
Hydrogen = 0.298
Images of the charge distribution can be found below in the comparison section.
The file for the [P(CH3)4]+ NBO calculation is File:MOM P(CH3)4 MOs.chk
The log file for the [P(CH3)4]+ MO analysis is File:MOM P(CH3)4 MOS.LOG
[S(CH3)3]+
Optimisation
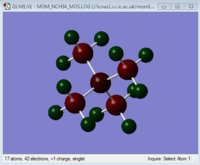
A molecule of [S(CH3)3]+ was optimised using the B3LYP method and 6-31G(d,p) basis set. This gave a C-S-C bond angle of 102.7° and a C-S bond length of 1.82Å. The H-C-H bond angle was found to be 111.1° and the C-H bond length as 1.09Å. In this structure the sulphur contains a lone pair. This distorts the sp3 hybridisation by repelling the -(CH3) groups and decreases the bond angle for the perfect tetrahedral structure.
| Jmol | Convergence Data | Calculation Summary | |||
|---|---|---|---|---|---|
|
Item Value Threshold Converged? Maximum Force 0.000027 0.000450 YES RMS Force 0.000007 0.000300 YES Maximum Displacement 0.000322 0.001800 YES RMS Displacement 0.000105 0.001200 YES |

|
The log file for the [S(CH3)3]+ optimisation is File:MOM SCH33 OPTIMISATION.LOG
Frequency Analysis
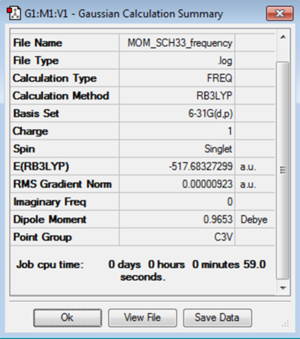
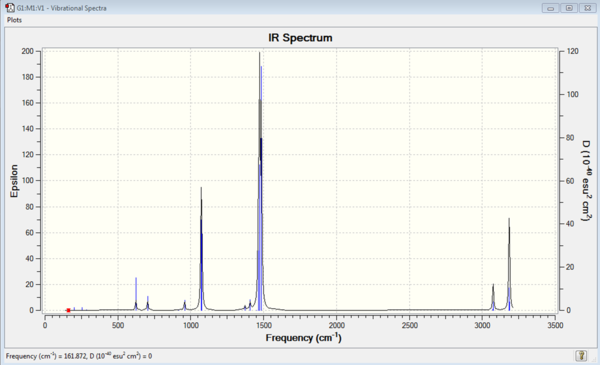
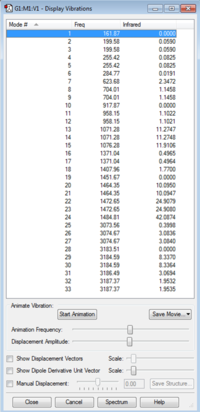
A frequency analysis was carried out on the molecule of [S(CH3)3]+ using the B3LYP method and 6-31G(d,p) basis set. This found the low frequency vibrations close to zero and gave all frequencies as positive. This confirms that a minimum on the potential energy surface has been found and the optimisation has been successful.
| Low Frequency Data / cm-1 | Summary Data |
|---|---|
Low frequencies --- -7.0062 -6.7036 -6.6999 0.0007 0.0020 0.0103 Low frequencies --- 161.8721 199.5756 199.5756 |
|
The log file for the [S(CH3)3]+ frequency analysis is File:MOM SCH33 FREQUENCY.LOG
 |
|
| [S(CH3)3]+ IR Spectrum | [S(CH3)3]+ IR Vibrations |
NBO
An NBO analysis was carried out on the molecule giving the charges on the atoms as:
Sulphur = 0.917
Carbon = -0.846
Hydrogen = 0.297
Images of the charge distribution can be found below in the comparison section.
The file for the [S(CH3)3]+ NBO calculation is File:MOM SCH33 MOs.chk
The log file for the [S(CH3)3]+ MO analysis is File:MOM SCH33 MOS.LOG
Analysis of Results
The C-X-C bond angles, where X is the central atom, are the same for [N(CH3)4]+ and [P(CH3)4]+. They show that both central atoms are sp3 hybridised and both have perfect tetrahedral structures. The [S(CH3)3]+ ion however has a smaller bond angle. This is due to the lone pair on the sulphur. It repels the -(CH3) groups and this decreases the bond angle to 102.7°, less than the tetrahedral 109.5°. The C-X bond length also varies depending upon the central atom. The shortest bond length of the three is 1.51Å, where nitrogen is the central atom. [P(CH3)4]+ and [S(CH3)3]+ both have C-X bond lengths as 1.82Å. This is larger than the N-C bond as sulphur and phosphorus have an extra shell of electrons, making the bond length longer. Phosphorus and sulphur are adjacent to eachother on the periodic table which makes them a very similar size and therefore the C-X bond lengths are the same.
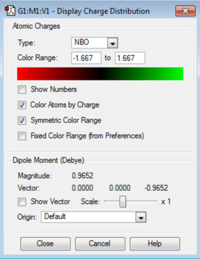
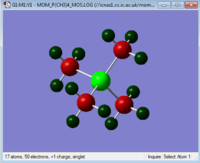
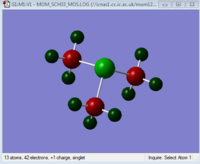
The charges on each atom are shown in the table below. The scale for the images is the same for each so the images can be compared to see how changing the central atom affects the charges.
| Charge Distribution Summary | [N(CH3)4]+ | [P(CH3)4]+ | [S(CH3)3]+ |
|---|---|---|---|
|
|
|
|
     Nitrogen = -0.295
     Carbon= -0.483
     Hydrogen = 0.269
|
      Phosphorus = 1.667
      Carbon = -1.060
      Hydrogen = 0.298
|
      Sulphur = 0.917
      Carbon = -0.846
      Hydrogen = 0.297
|
In all three ions the most negatively charged atom is the carbon. The other atoms in the ion contain various charges depending upon the central atom. All three molecules carry an overall positive charge and this is very important to consider when analysing the charge distribution. Formally in all three ionss the positive charge would be considered to be lying on the central atom as this is the atom from which the electron has been removed. The location of this positive charge however varies depending on the ions and each needs to be considered individually.
In [N(CH3)4]+ both the carbon and nitrogen are negatively charged and each hydrogen carries positive charge. This is maybe not what would be expected from drawing the traditional structure of [N(CH3)4]+, where the positive charge is considered to be on the nitrogen. Electronegativity is important in explaining this discrepancy. Nitrogen is one of the most electronegative elements and so strongly draws electron density towards itself. Even though it is missing an electron it still pulls electron density enough to have an overall negative charge. The electronegativity of the nitrogen can be demonstrated by considering the contribution of the carbon and nitrogen atoms to the C-N bond. The NBO analysis calculates that 66% of the electron density is localised on the nitrogen and 34% on the carbon. This shows the difference in electronegativities between the atoms. The electron cloud has been polarised towards the nitrogen. The hydrogens in the ion are the atoms which contain the positive charge as these are the least electronegative atom. This means that the depiction of [NR4]+, where R is an alkyl group is incorrect. The positive charge should actually lie on the alkyl groups, not on the nitrogen.
When considering [P(CH3)4]+ it is apparent that the greatest positive charge lies on the central phosphorus. The carbons have a large negative charge and the hydrogens a small positive charge. Again due to the charge on the molecule the phosphorus is considered to have lost an electron, giving it an overall positive charge. The charge on the phosphorus atom is +1.667, greater than the +1 charge which would have be gained by losing one electron. In this ion the carbons are the most electronegative atom and are substantially more electronegative than phosphorus. They therefore draw electron density away from the phosphorus centre, further increasing the positive charge. This is the opposite way around to [N(CH3)4]+ where the nitrogen is more electronegative than the carbon. The NBO shows where the electron density sits on the P-C bond. 60% of the bond is on the carbon and 40% on the phosphorus and this confirms the theory as to why the positive charge on the phosphorus is particularly high. The hydrogens again are positively charged as the carbons are more electronegative than the hydrogen, polarising the C-H bond.
In [S(CH3)3]+ again it is the central atom that has the highest positive charge. However only +0.917, lower than the charge on the phosphorus atom in [P(CH3)4]+. It is also lower that +1, the overall charge of the ion. This means that the sulphur inductively draws electrons towards itself, slightly decreasing the positive charge on the atom. Considering electronegativities sulphur is slightly more elctronegative than carbon and this can be seen in the NBO calculation. In the C-S bond 49% on the electron density lies on the carbon and 51% on the sulphur. This very small difference in polarisation in the bond explains why the charge on the sulphur is close to +1. It only withdraws a small amount of density from the C-S bond towards itself. The carbon remains negatively charged, as in the previous two structures and the hydrogen positively charged.
Part 2: Influence of functional groups
[N(CH3)3(OH)]+
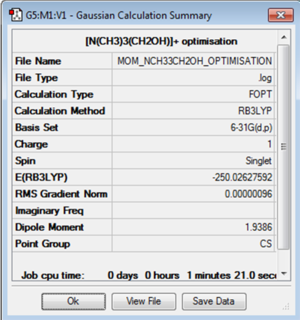
The molecule of [N(CH3)3(OH)]+ was optimised using the B3LYP method and 6-31G(d,p) basis set.
Optimisation
| Jmol | Convergence Data | Calculation Summary | |||
|---|---|---|---|---|---|
|
Item Value Threshold Converged? Maximum Force 0.000003 0.000015 YES RMS Force 0.000001 0.000010 YES Maximum Displacement 0.000012 0.000060 YES RMS Displacement 0.000004 0.000040 YES |
|
The log file for the [N(CH3)3(OH)]+ optimisation is File:MOM NCH33CH2OH OPTIMISATION.LOG
Frequency Analysis
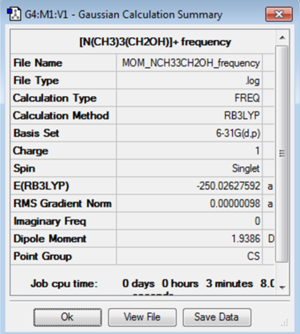
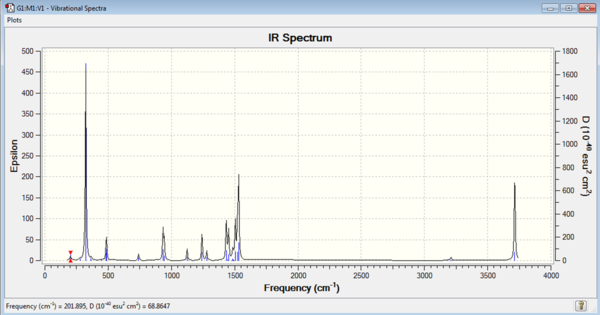
The optimisation was confirmed by carrying out a frequency analysis using the B3LYP method and 6-31G(d,p) basis set. The low frequencies were found to be close to zero and frequencies of vibrations were found to be positive. This confirmed that optimisation had completed and a minimum on the potential surface was found.
| Low Frequency Data / cm-1 | Summary Data |
|---|---|
Low frequencies --- -7.2194 -5.1221 -4.3067 -0.0008 -0.0003 0.0010 Low frequencies --- 201.8952 276.9002 280.5348 |
|
The log file for the [N(CH3)3(OH)]+ frequency analysis is File:MOM NCH33CH2OH FREQUENCY.LOG
 |

|
| [N(CH3)3(CH2OH)]+ IR Spectrum | [N(CH3)3(OH)]+ IR Vibrations |
[N(CH3)3(CH2CN)]+
Optimisation
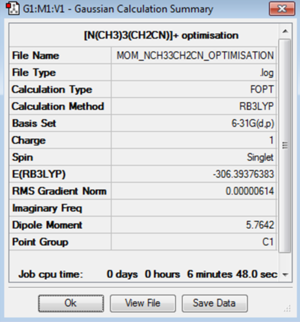
The molecule of [N(CH3)3(CH2CN)]+ was optimised using the B3LYP method and 6-31G(d,p) basis set.
| Jmol | Convergence Data | Calculation Summary | |||
|---|---|---|---|---|---|
|
Item Value Threshold Converged? Maximum Force 0.000020 0.000450 YES RMS Force 0.000004 0.000300 YES Maximum Displacement 0.000443 0.001800 YES RMS Displacement 0.000122 0.001200 YES |
|
The log file for the [N(CH3)3(CH2CN)]+ optimisation is File:MOM NCH33CH2CN OPTIMISATION.LOG
Frequency Analysis
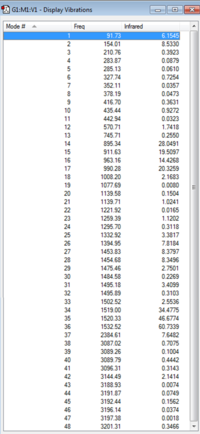
A frequency analysis was performed to check that the molecule had optimised successfully. The B3LYP method and 6-31G(d,p) basis set was used and the low frequencies were all found to be close to zero. All the frequencies of the vibraional modes were positive and this confirmed that a minimum energy point had been found.
| Low Frequency Data / cm-1 | Summary Data |
|---|---|
Low frequencies --- -2.6539 -0.0009 -0.0007 0.0002 7.1407 9.6450 Low frequencies --- 91.7383 154.0136 210.7605 |

|
The log file for the [N(CH3)3(CH2CN)]+ frequency analysis is File:MOM NCH33CH2CN FREQUENCY.LOG
 |
|
| [N(CH3)3(CH2CN)]+ IR Spectrum | [N(CH3)3(CH2CN)]+ IR Vibrations |
Analysis of Results
NBO Analysis
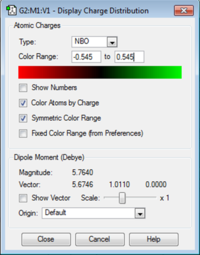
The effects on the charge distribution of adding an electron donating or electron withdrawing group as a ligand were investigated. '-OH' is an electron donating group so it would be expected that electron donation into the central nitrogen atom would be observed. The reverse should be true for the electron withdrawing group '-CN'. The problem with direct comparison here though is there is no additional -(CH2) group in the [N(CH3)3(OH)]+ molecule and this changes both the reactivity and the charge density on the atoms.
| Charge Distribution Summary | [N(CH3)3(OH)]+ | [N(CH3)3(CH2CN)]+ |
|---|---|---|
|

|

|
Oxygen = -0.545 -(OH) Hydrogen = 0.514 Carbon = -0.490 Hydrogen = 0.278 Nitrogen = 0.009 |
-(CH3)Carbon = -0.489 -(CH2)Carbon = -0.358 Nitrile Carbon = 0.209 Hydrogen = 0.271 -(CH2) Hydrogen = 0.309 Central Nitrogen = -0.289 Nitrile Nitrogen = -0.186 |
When considering the charge distribution from the cyanide substituted ion it is possible to see that it does indeed act as an electron withdrawing group. Comparing the -(CH3) carbons and the -(CH2) carbon, adjacent to the cyanide group a difference in charge can be seen. The -(CH3) carbon has a charge of -0.489 but the -(CH2) carbon has a smaller negative charge of -0.358. This shows that electron density has been polarised towards the cyanide group. Also comparing the charge on the central nitrogen atom in [N(CH3)3(CH2OH)]+ to [N(CH3)4]+ it can be observed there is a smaller negative charge on the nitrogen in the cyanide substituted complex. Charge on nitrogen in [N(CH3)3(CH2OH)]+ is -0.289 compared to nitrogen in [N(CH3)4]+ which is -0.295. This difference is however quite small and care should be taken with this result due to the inaccuracies caused by the limitations of the basis set used.
The charge distribution on the [N(CH3)3(CH2OH)]+ ion shows that when the -(OH) group is directly attached to the central atom it doesn't act as an electron donating group as may be expected. Instead because the oxygen is more electronegative than the nitrogen, when they sit adjacent to eachother electrons are withdrawn from the central nitrogen, giving nitrogen and overall charge of +0.009. This shows that the position of the electron withdrawing or donating group is important. When it is not directly bonded to the central atom the donating or withdrawing inductive properties that the group possesses is observable. However when it is directly bonding other factors such as electronegativity become the overriding factor.
The data shows that when an electron withdrawing group is substituted onto a molecule, not adjacent to the central atom, it's affects can be seen in the charge distribution in the molecule. However if the group is bonded directly to the metal centre other factors become more important, such as electronegativities.
The file for the [N(CH3)3(CH2OH)]+ NBO calculation is File:MOM NCH33CH2OH MOs.chk
The file for the [N(CH3)3(CH2CN)]+ NBO calculation is File:MOM NCH33CH2CN MOs.chk
Molecular Orbital Comparisons
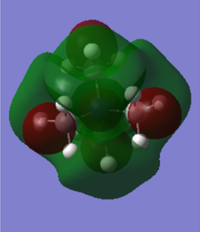
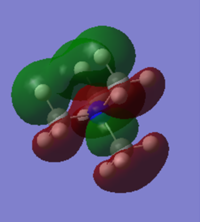
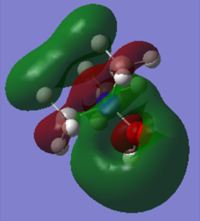
The molecular orbitals for [N(CH3)4]+, [N(CH3)3(CH2OH)]+ and [N(CH3)3(CH2CN)]+ were compared to see what the effect of an electron donating or electron withdrawing substituent has on the HOMO and LUMO of the molecule and so how the reactivity of the molecule is affected.
| Structure | HOMO | LUMO | HOMO/LUMO Gap |
|---|---|---|---|
| [N(CH3)4]+
|
-0.57933a.u |
-0.13302a.u. |
0.44631a.u. |
| [N(CH3)3(CH2OH)]+ | 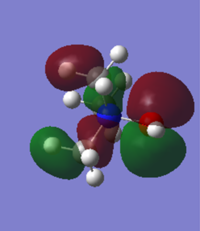
-0.52093a.u. |
-0.15247a.u. |
0.34846a.u. |
| [N(CH3)3(CH2CN)]+ | 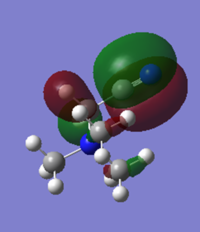
-0.50048a.u. |

-0.18183a.u. |
0.31865a.u. |
[N(CH3)4]+ has quite a diffuse HOMO and LUMO. The molecular orbital is spread over the entire molecule and there isn't a particularly large coefficient of the orbital localised on any of the particular atoms. This means that there isn't a particular site on the molecule where it is either susceptible to nucleophilic attack on the LUMO or is likely to attack as a nucleophile, from the HOMO.
The electron withdrawing nature of the cyanide group increases the energy of the HOMO and decreases the energy of the LUMO and so the HOMO LUMO energy gap has decreased. The shape of both the HOMO and the LUMO have changes and the greatest coefficients of both now lie on the cyanide substuituent. The HOMO is dominated by the C-N π orbital and so this is where nucleophilic attack by the N(CH3)3(CH2OH)]+ ion would occur. The LUMO is dominated by the C-N π* orbital and the electron density around the central nitrogen atom. In reactivity terms this means that under nucleophilic attack electrons would be donated into the π* orbital, breaking the π bond between the carbon and nitrogen.
As OH is electron donating, the HOMO and LUMO of [N(CH3)3(CH2OH)]+ would be expected to increase in energy. However because the oxygen is so electronegative actually both the HOMO and the LUMO decrease in energy. The group therefore acts as a weak electron withdrawing group and then same trend is seen as in the cyanide substituted ion. The HOMO increases in energy and the LUMO decreases, decreasing the HOMO/LUMO gap but not to the same extent as the cyanide substituent does. The largest electron density on the LUMO lies around the oxygen and on the HOMO it is the O-N π* antibonding orbital.
The file for the [N(CH3)3(CH2OH)]+ MO analysis is File:MOM NCH33CH2OH MOS.LOG
The file for the [N(CH3)3(CH2CN)]+ MO analysis is File:MOM NCH33CH2CN MOS.LOG

