Rep:Mod:mod2scientiadecusettutamen
Welcome to the inorganic computational lab project of Christopher Kaye.
Introduction
This project uses computational chemistry to predict and understand chemical properties such as structure, bonding, energies, molecular orbitals and charge distributions of molecules.
1st Part
BH3
Initial optimisation using B3LYP method and 3-21g basis set

BH3 was drawn in Gaussview and Gaussian was used to run calculations. The B-H bond lengths were initially set to 1.5 Å and, using DFT method and B3LYP fuctional method and a 3-21g basis set, the molecule was optimised, as confirmed by the root-mean-square (RMS) gradient in the log file being a value below the threshold of 0.000300.
The calculated B-H bond lengths are 1.19 Å and the H-B-H bond angles are 120 degrees. The bond length compares very well to a literature value of 1.19 Å [1]. The 120 degree angle is consistant with D3H symmetry.
| Summary | BH3 optimisation |
|---|---|
| File Name | BH3_OPTtrololol |
| File Type | .log |
| Calculation Type | FOPT |
| Calculation Method | RB3LYP |
| Basis Set | 3-21G |
| Charge | 0 |
| Spin | Singlet |
| E(RB3LYP) | -26.46226338 a.u. |
| RMS Gradient Norml | 0.00020672 a.u. |
| Dipole Moment | 0.0000 Debye |
| Point Group | D3H |
| Job cpu time: | 0 days 0 hours 0 minutes 30.0 seconds. |
From the log file, it can be seen that the optimisation successfully converged:
     3.14159   0.00000   0.00000   0.00000   0.00000   3.14159
         Item               Value     Threshold  Converged?
 Maximum Force            0.000413     0.000450     YES
 RMS     Force            0.000271     0.000300     YES
 Maximum Displacement     0.001610     0.001800     YES
 RMS     Displacement     0.001054     0.001200     YES
 Predicted change in Energy=-1.071764D-06
 Optimization completed.
    -- Stationary point found.
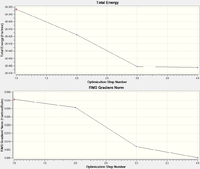

Subsequent optimisation using 6-31G(d,p) basis set
Gave bond distance 1.19 Å and bond angle 120.0 degrees again. The energy for the optimised structure was slightly higher in magnitude than with the lower order basis set. It can also be seen that the RMS gradient is much smaller than with the lower order basis set, which indicates the optimisation was more successful.
| Summary | BH3 optimisation (2) |
|---|---|
| File Name | BH3_OPT_631G_TROLOL |
| File Type | .log |
| Calculation Type | FOPT |
| Calculation Method | RB3LYP |
| Basis Set | 6-31G(d,p) |
| Charge | 0 |
| Spin | Singlet |
| E(RB3LYP) | -26.61532363 a.u. |
| RMS Gradient Norml | 0.00000235 a.u. |
| Dipole Moment | 0.0000 Debye |
| Point Group | D3H |
| Job cpu time: | 0 days 0 hours 0 minutes 5.0 seconds. |
And confirmation that the molecule had converged
         Item               Value     Threshold  Converged?
 Maximum Force            0.000005     0.000450     YES
 RMS     Force            0.000003     0.000300     YES
 Maximum Displacement     0.000019     0.001800     YES
 RMS     Displacement     0.000012     0.001200     YES
 Predicted change in Energy=-1.304899D-10
 Optimization completed.
    -- Stationary point found.
Comparison of energies from the two different Basis Sets
| Basis Set used | Energy / au | Energy / kJ mol-1 | Energy difference / kJ mol-1 |
|---|---|---|---|
| 3-21G | -26.46226338 | -69476.6725 | |
| 6-31G(d,p) | -26.61532363 | -69878.53219 | 401.8596906 |
The magnitude of the difference in energies (converted from Hartrees into kJ mol-1 using the standard conversion factor) from optimisation using the two basis sets shows that it is no possible to compare molecules from different basis sets. As the 6-31G basis set is more powerful, it is assumed to produce the more 'accurate' result.
TlBr3 optimisation
DOI:10042/23342 link to D-Space
A molecule of TlBr3 was created in GaussView. Symmetry of the molecule was restricted to D3H with a Very Tight tolerance of 0.0001 and point group symmetry was turned-on. Optimisation was performed, again using DFT method and B3LYP functional method, and also using LANL2DZ Basis Set and yielded the results below:
| Summary | TlBr3 optimisation |
|---|---|
| File Name | tlbr3logscan |
| File Type | .log |
| Calculation Type | FOPT |
| Calculation Method | RB3LYP |
| Basis Set | LANL2DZ |
| Charge | 0 |
| Spin | Singlet |
| E(RB3LYP) | -91.21812851 a.u. |
| RMS Gradient Norm | 0.00000090 a.u. |
| Imaginary Freq | |
| Dipole Moment | 0.0000 Debye |
| Point Group | D3H |
| Job cpu time: | 0 days 0 hours 0 minutes 38.7 seconds. |
Again, the log file was checked to ensure convergence.
         Item               Value     Threshold  Converged?
 Maximum Force            0.000002     0.000450     YES
 RMS     Force            0.000001     0.000300     YES
 Maximum Displacement     0.000022     0.001800     YES
 RMS     Displacement     0.000014     0.001200     YES
 Predicted change in Energy=-6.084035D-11
 Optimization completed.
    -- Stationary point found.
The Tl-Br bond length was found to be 2.65 Å which compared reasonably well to literature value of 2.52 Å in aqueous solution [2]
BBr3 optimisation
DOI:10042/23389 link to D-Space
A molecule of BBr3 was created using the previously created and optimised (using 6-31g(d,p) basis set) BH3 molecule. Then, using GEN basis set, which allows the use of specific basis sets for each individual atom, and 'pseudo=read gfinput' as an additional key word which turns-on pseudo potentials, the input file was saved. The saved input was then edited manually thus:
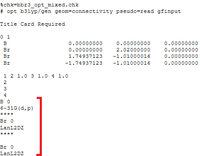
This yielded a computed B-Br bond length of 1.93 Å which compares well to literature value of 2.01 Å [3]. As with BH3 and TlBr3, the bond angle of 120 degrees compares well with D3H symmetry.
| Summary | BH3 optimisation |
|---|---|
| File Name | fixedbbr3scanhpc |
| File Type | .log |
| Calculation Type | FOPT |
| Calculation Method | RB3LYP |
| Basis Set | Gen |
| Charge | 0 |
| Spin | Singlet |
| E(RB3LYP) | -64.43645296 a.u. |
| RMS Gradient Norm | 0.00000382 a.u.. |
| Imaginary Freq | |
| Dipole Moment | 0.0000 Debye |
| Point Group | D3H |
| Job cpu time: | 0 days 0 hours 0 minutes 36.2 seconds. |
     Item               Value     Threshold  Converged?
 Maximum Force            0.000008     0.000450     YES
 RMS     Force            0.000005     0.000300     YES
 Maximum Displacement     0.000036     0.001800     YES
 RMS     Displacement     0.000023     0.001200     YES
 Predicted change in Energy=-4.026911D-10
 Optimization completed.
    -- Stationary point found.
Analysis of optimisation results
| Molecule | Bond length / Å | Literature / Å |
|---|---|---|
| BH3 | 1.19232 | 1.10 -1.16 (BH4- counter ion) [4] |
| TlBr3 | 2.65095 | 2.53 - 2.57 (TlBr4- counter ion)[5] |
| BBr3 | 1.93396 | 2.01 (BBr4- counter ion) [6] |
In chemistry, a bond is an electrostatic attraction between atoms that hold them together in space. The electrostatic attraction is as a result of the sharing of electrons between nuclei (covalent model) or the transfer of electrons (ionic model). In reality, most systems are 'in-between' cases.
There are also weaker bonding interactions between atoms and molecules, such as hydrogen bonding and Van der Waal's, which are of a much smaller magnitude than covalent or ionic bonds.
A bond is based on the overlap of orbitals, where the probability of 'finding' an electron is finite. Strong bonds, where there is good orbital overlap, have a high probability of finding electrons in that region of space. GaussView is a computer programme which, like all computer programmes, has limitations. In the process of optimising a molecule, it will either show a bond present or will not, based purely on distance criteria it is programmed to follow from its internal reference library of typical bond lengths. As the molecule approaches its energy minima in the optimisation process, GaussView will show a bond when a critical bond length is reached. Of course in reality at longer bond lengths, there may still be a strong bonding interaction below the critical dissociation limit.
Bond lengths are dependent on the effective orbital overlap between atoms bound in a molecule. Stronger bonds are shorter bonds where the orbital overlaps are good. From the table above, it can be seen that B-H is the strongest bond as it is shortest bond length. Accordingly, it can be said that Tl-Br is the weakest bond as it has the longest bond length. Boron and hydrogen are both small atoms with small, dense atomic orbitals (1s of hydrogen and 2s and 2p of boron) which goes some way to explaining this. Whereas for Br in BBr3, the 4p orbital of bromine is much larger and more diffuse. This size disparity results in less effective orbital overlap and a weaker bond.
Thallium, like Boron, is a group 13 element so possesses the same number of valance electrons as boron. However, due to its position in the periodic table (period 6 vs period 2 for boron), its orbitals are much more diffuse and hence have a worse overlap with bromine than boron does. Thallium also has a tendency to adopt a +1 oxidation state in preference to a +3 oxidation state, due to a large hybridisation energy (the "inert pair" effect).
Frequency analysis
Frequency analysis is used to ensure that the energy minimum is indeed a minimum. From basic mathematics, it is known that a gradient of 0 means one of three things: a minimum, a maximum, or a turning point (point of inflection). Hence we take the second derivative of the potential energy surface which, if it is positive, confirms that the energy minimum is a minimum. Frequency analysis also generates IR and Raman vibrational modes which can be compared to experimentally observed modes.
BH3
File:CHRISTOPHERKAYE BH3 FREQ.LOG
Using the same basis set as for the 2nd optimisation of BH3 (6-31G(d,p)) and with Job Type now selected as 'Frequency', the following was obtained in the output file.
The Low frequencies are within the required range of between -15 and 15 cm-1. The second lot of Low frequencies, which are 2nd derivatives, are all positive as should be the case for energy minima.
 Low frequencies ---   -0.9033   -0.7343   -0.0054    6.7375   12.2491   12.2824
 Low frequencies --- 1163.0003 1213.1853 1213.1880
 Harmonic frequencies (cm**-1), IR intensities (KM/Mole), Raman scattering
 activities (A**4/AMU), depolarization ratios for plane and unpolarized
 incident light, reduced masses (AMU), force constants (mDyne/A),
 and normal coordinates:
                     1                      2                      3
                    A2"                    E'                     E'
 Frequencies --  1163.0003              1213.1853              1213.1880
 Red. masses --     1.2531                 1.1072                 1.1072
 Frc consts  --     0.9986                 0.9601                 0.9601
 IR Inten    --    92.5478                14.0553                14.0589
  Atom  AN      X      Y      Z        X      Y      Z        X      Y      Z
     1   5     0.00   0.00   0.16     0.00   0.10   0.00    -0.10   0.00   0.00
     2   1     0.00   0.00  -0.57     0.00   0.08   0.00     0.81   0.00   0.00
     3   1     0.00   0.00  -0.57    -0.39  -0.59   0.00     0.14   0.39   0.00
     4   1     0.00   0.00  -0.57     0.39  -0.59   0.00     0.14  -0.39   0.00
                     4                      5                      6
                    A1'                    E'                     E'
 Frequencies --  2582.2624              2715.4311              2715.4323
 Red. masses --     1.0078                 1.1273                 1.1273
 Frc consts  --     3.9595                 4.8976                 4.8976
 IR Inten    --     0.0000               126.3307               126.3211
  Atom  AN      X      Y      Z        X      Y      Z        X      Y      Z
     1   5     0.00   0.00   0.00     0.11   0.00   0.00     0.00   0.11   0.00
     2   1     0.00   0.58   0.00     0.02   0.00   0.00     0.00  -0.81   0.00
     3   1     0.50  -0.29   0.00    -0.60   0.36   0.00     0.36  -0.19   0.00
     4   1    -0.50  -0.29   0.00    -0.60  -0.36   0.00    -0.36  -0.19   0.00
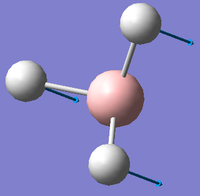
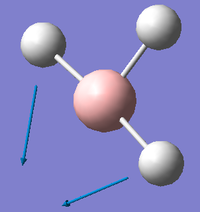
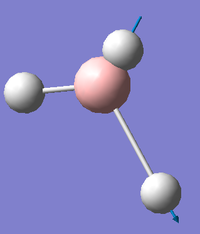
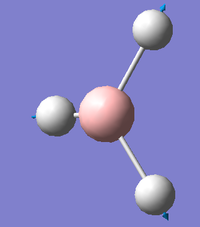
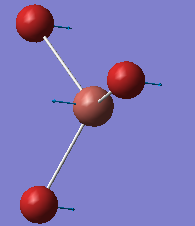
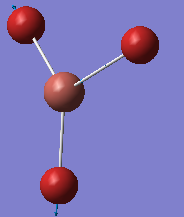
The resulting vibrational modes are displayed graphically and described in the table below.
The degeneracy of the peaks at 1163.0003 cm-1 and at 2715.4323 cm-1, as well as the symmetrical stretching at 2582.2624 cm-1 which has zero intensity due to having no change in dipole moment, means that the predicted IR spectrum will show only three peaks. The predicted IR spectrum of BH3 is shown below:

TlBr3
File:CHRISTOPHERKAYE TLBR3 FREQ.LOG
Using the optimised TlBr3 molecule and the same basis set as before (LANL2DZ), frequency analysis yielded low frequencies in the output file within range, and with 2nd derivative low frequencies which were positive.
Low frequencies ---   -3.4213   -0.0026   -0.0004    0.0015    3.9367    3.9367
 Low frequencies ---   46.4289   46.4292   52.1449
 Harmonic frequencies (cm**-1), IR intensities (KM/Mole), Raman scattering
 activities (A**4/AMU), depolarization ratios for plane and unpolarized
 incident light, reduced masses (AMU), force constants (mDyne/A),
 and normal coordinates:
                     1                      2                      3
                    E'                     E'                     A2"
 Frequencies --    46.4289                46.4292                52.1449
 Red. masses --    88.4613                88.4613               117.7209
 Frc consts  --     0.1124                 0.1124                 0.1886
 IR Inten    --     3.6867                 3.6867                 5.8466
  Atom  AN      X      Y      Z        X      Y      Z        X      Y      Z
     1  81     0.00   0.28   0.00    -0.28   0.00   0.00     0.00   0.00   0.55
     2  35     0.00   0.26   0.00     0.74   0.00   0.00     0.00   0.00  -0.48
     3  35     0.43  -0.49   0.00    -0.01  -0.43   0.00     0.00   0.00  -0.48
     4  35    -0.43  -0.49   0.00    -0.01   0.43   0.00     0.00   0.00  -0.48
                     4                      5                      6
                    A1'                    E'                     E'
 Frequencies --   165.2685               210.6948               210.6948
 Red. masses --    78.9183               101.4032               101.4032
 Frc consts  --     1.2700                 2.6522                 2.6522
 IR Inten    --     0.0000                25.4830                25.4797
  Atom  AN      X      Y      Z        X      Y      Z        X      Y      Z
     1  81     0.00   0.00   0.00     0.42   0.00   0.00     0.00   0.42   0.00
     2  35     0.00  -0.58   0.00     0.01   0.00   0.00     0.00  -0.74   0.00
     3  35     0.50   0.29   0.00    -0.55  -0.32   0.00    -0.32  -0.18   0.00
     4  35    -0.50   0.29   0.00    -0.55   0.32   0.00     0.32  -0.18   0.00
The table below shows graphically the IR motions with descriptions.
As with BH3's IR spectrum, three peaks are shown due to the two degenerate vibrational modes (46.43 and 210.69 cm-1) and also the symmetric stretch at 165.27 cm-1 in which the dipole moment remains unchanged.
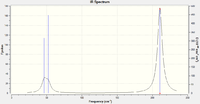
DOI:10042/23482 D-Space link to TlBr3 frequency analysis
Comparison of BH3 and TlBr3 frequency results
BH3, as expected, has larger IR stretching frequencies than TlBr3 because vibrational frequencies correlate with bond strength and inversely with reduced mass, μ, which is much smaller for BH3. For the reasons discussed above, the B-H bonds are much stronger than Tl-Br bonds. The comparison of IR frequencies here is acceptable because the same basis set was used for each calculation.
Each computed IR spectrum has three peaks. The spectra produced can be compared to experimentally obtained IR spectra.
Molecular Orbitals of BH3
DOI:10042/23449 link to D-Space BH3 MO calculation
The diagram below shows LCAO-predicted (ChemDraw-produced) MOs and also the computated MOs (GaussView-produced, 6-31G(d,p) basis set using DFT and B3LYP) for comparison.
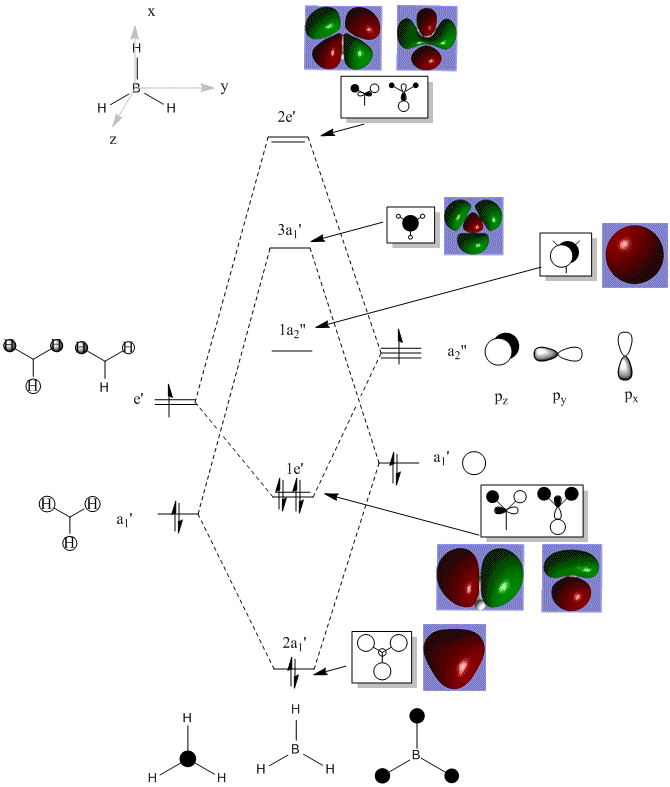
The LCAO and 'real' (computed) MOs look very similar which confirm the use of 'back of the envelope' LCAO as am accurate qualitative tool, particularly where mixing is not significant.
NBO analysis OF NH3
Optimisation of NH3
DOI:10042/23526 link to optimisation file on D-Space
N-H bond length = 1.01803 Å
H-N-H bond angle = 105.755°
| Summary | NH3 optimisation |
|---|---|
| File Name | NH3TOPTROLOLagain |
| File Type | .log |
| Calculation Type | FOPT |
| Calculation Method | RB3LYP |
| Basis Set | 6-31G(d,p) |
| Charge | 0 |
| Spin | Singlet |
| E(RB3LYP) | -56.55776854 a.u. |
| RMS Gradient Norm | 0.00003886 a.u. |
| Imaginary Freq | |
| Dipole Moment | 1.8463 Debye |
| Point Group | C1 |
| Job cpu time: | 0 days 0 hours 0 minutes 12.0 seconds. |
 Item               Value     Threshold  Converged?
 Maximum Force            0.000077     0.000450     YES
 RMS     Force            0.000044     0.000300     YES
 Maximum Displacement     0.000174     0.001800     YES
 RMS     Displacement     0.000112     0.001200     YES
 Predicted change in Energy=-1.601470D-08
 Optimization completed.
    -- Stationary point found.
Frequency analysis
DOI:10042/23524 link to file on D-Space
 Low frequencies ---   -9.5195   -0.0015   -0.0015   -0.0010   33.0111   39.6172
 Low frequencies --- 1089.7808 1694.1611 1694.3189
Population analysis
Charge distribution

Nitrogen, being a very electronegative element, is expected to draw electron density onto it making it possess the negative charge. Hydrogen by contrast is electropositive and so it expected to lose electron density to the N atom, as is the case here.
Hybridisation

The above output file shows that the majority of the N-H bond (69%) comes from the N atom's orbitals, and the remainder from the H atoms' orbitals. The N atom's orbitals are approximately 25% s character and 75% p character, which is consistent with the sp3 hybridisation expected. The H orbitals by contrast are 100% s character, also as expected.
Association energies : ammonia-borane
Bond lengths
| Bond | Length / Å | Literature / Å |
|---|---|---|
| N-H | 1.02 | 0.96 - 1.07 [7] |
| B-N | 1.67 | 1.59 [7] |
| B-H | 1.21 | 1.15-1.18 [7] |
Bond lengths are in good agreement with literature.
Optimisation
DOI:10042/23576 link to D-Space
Optimisation was performed in the traditional manner.
| Summary | NH3BH3 optimisation |
|---|---|
| File Name | NH3BH3OPTIMISATIONTROLOL |
| File Type | .log |
| Calculation Type | FOPT |
| Calculation Method | RB3LYP |
| Basis Set | 6-31G(d,p) |
| Charge | 0 |
| Spin | Singlet |
| E(RB3LYP) | -83.22468958 a.u. |
| RMS Gradient Norm | 0.00005841 a.u. |
| Imaginary Freq | |
| Dipole Moment | 5.5651 Debye |
| Point Group | C1 |
| Job cpu time: | 0 days 0 hours 0 minutes 51.0 seconds. |
The RMS gradient was seen to be below the threshold value of 0.000300, which indicated a successful convergence.
         Item               Value     Threshold  Converged?
 Maximum Force            0.000124     0.000450     YES
 RMS     Force            0.000057     0.000300     YES
 Maximum Displacement     0.000660     0.001800     YES
 RMS     Displacement     0.000304     0.001200     YES
 Predicted change in Energy=-1.649734D-07
 Optimization completed.
    -- Stationary point found.
Frequency analysis
DOI:10042/23578 link to D-Space
E(RB3LYP) = -83.22468984 which is the same as for optimisation, to two decimal places (as required).
 Low frequencies ---    0.0010    0.0014    0.0015   19.7999   23.8626   31.9992
 Low frequencies ---  265.1829  632.2597  639.1868
Calculation of dissociation energy
Using previously obtained energies of BH3 and NH3 (using the same basis sets):
ΔE / a.u. = E H3BNH3 - EBH3 - ENH3
= (-83.22468958) - (-26.61532363) - (-56.55776854) = -0.05159741
Converting to kJ mol-1 , E / kJ mol-1 = -135.469
This energy of B-N bond dissociation is of the right magnitude as would be expected for a covalent bond (typically a few hundreds of kJ per mole). For example, the bond dissociation energy for C-H in methane is 440 kJ mol-1.[8] Weaker bonding interactions, such as van der Waal's are typically 2 orders of magnitude smaller than this, and hydrogen bonding approximately 1 magnitude smaller.
2nd Part : Mini Project - Aromaticity
Aromaticity is a property which describes how certain conjugated ring systems of unsaturated bonds or lone pairs are more stable than anticipated. For a compound to be Huckel aromatic, the ring(s) should have 4n+2 π electrons (where n is an integer), the relevant atoms be co-planar, and the electrons be in a delocalised and conjugated π system.
Aromatic compounds, of which benzene is the most well-known example, are much more thermodynamically stable than similar, non-aromatic unsaturated compounds. For example cyclohexene, as an alkene, readily undergoes addition of bromine whereas benzene does not. Where benzene does react, it typically undergoes electrophilic aromatic substitution rather than addition and requires the use of a strong Lewis acid such as FeCl3.
Optimisations and frequency calculation outputs
Below are the data for the optimisation and frequency calculations of benzene and three of its analogues: boratabenzene, pyridinium and borazine. The 6-31G (d,p) basis set was used for each. In each case, the RMS gradient was checked, as was the log file, and the low frequencies, to ensure successful convergences.
Benzene

DOI:10042/23707 Link to D-Space optimisation of benzene
| Summary | Benzene optimisation with d6h symmetry |
|---|---|
| File Name | BENZENE_OPT_CKAYE_WITH_SYMM |
| File Type | .log |
| Calculation Type | FOPT |
| Calculation Method | RB3LYP |
| Basis Set | 6-31G(d,p) |
| Charge | 0 |
| Spin | Singlet |
| E(RB3LYP) | -232.25821387 a.u. |
| RMS Gradient Norm | 0.00008450 a.u. |
| Imaginary Freq | |
| Dipole Moment | 0.0000 Debye |
| Point Group | D6H |
         Item               Value     Threshold  Converged?
 Maximum Force            0.000199     0.000450     YES
 RMS     Force            0.000081     0.000300     YES
 Maximum Displacement     0.000847     0.001800     YES
 RMS     Displacement     0.000299     0.001200     YES
 Predicted change in Energy=-4.636845D-07
 Optimization completed.
    -- Stationary point found.
DOI:10042/23718 Link to D-Space frequency analysis
Low frequencies ---   -4.6046   -4.6046   -0.0088   -0.0042   -0.0042    9.6590
 Low frequencies ---  413.9386  413.9386  621.1428
Molecular Orbitals of benzene
DOI:10042/23861 link to D-Space
Boratabenzene
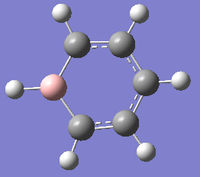
DOI:10042/23786 Link to optimisation on D-Space
| Summary | boratazene optimisation with c2v symmetry |
|---|---|
| File Name | boratazene_opt_ckaye |
| File Type | .log |
| Calculation Type | FOPT |
| Calculation Method | RB3LYP |
| Basis Set | 6-31G(d,p) |
| Charge | -1 |
| Spin | Singlet |
| E(RB3LYP) | -219.02052969 a.u. |
| RMS Gradient Norm | 0.00017333 a.u. |
| Imaginary Freq | |
| Dipole Moment | 2.8455 Debye |
| Point Group | C2V |
DOI:10042/23787 Link to frequency analysis on D-Space
         Item               Value     Threshold  Converged?
 Maximum Force            0.000224     0.000450     YES
 RMS     Force            0.000089     0.000300     YES
 Maximum Displacement     0.001086     0.001800     YES
 RMS     Displacement     0.000350     0.001200     YES
 Predicted change in Energy=-7.757370D-07
 Optimization completed.
    -- Stationary point found.
 Low frequencies ---  -16.1507    0.0003    0.0008    0.0008   17.3019   17.9918
 Low frequencies ---  371.5154  403.9804  565.1603
Molecular Orbitals of boratabenzene
DOI:10042/23860 link to D-Space
Pyridinium
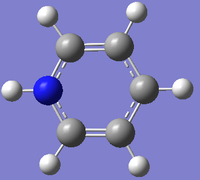
DOI:10042/23847 link to D-Space for optimisation of pyridinium
| Summary | pyridinium optimisation |
|---|---|
| File Name | pyridinium_opt_symm_ckaye |
| File Type | .log |
| Calculation Type | FOPT |
| Calculation Method | RB3LYP |
| Basis Set | 6-31G(d,p) |
| Charge | 1 |
| Spin | Singlet |
| E(RB3LYP) | -248.66807384 a.u. |
| RMS Gradient Norm | 0.00007441 a.u. |
| Imaginary Freq | |
| Dipole Moment | 1.8728 Debye |
| Point Group | C2V |
DOI:10042/23848 link to D-Space for frequency analysis of pyridinium
 Low frequencies ---   -7.2539   -0.0008    0.0005    0.0007   17.3642   18.5461
 Low frequencies ---  392.5078  404.0596  620.4781
Molecular Orbitals of pyridinium
DOI:10042/23859 link to D-Space
Borazine
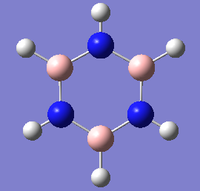
DOI:10042/23844 link to D-Space optimisation of borazine
| Summary | borazine optimisation |
|---|---|
| File Name | borazine_opt_ckaye |
| File Type | .log |
| Calculation Type | FOPT |
| Calculation Method | RB3LYP |
| Basis Set | 6-31G(d,p) |
| Charge | 0 |
| Spin | Singlet |
| E(RB3LYP) | -242.68458220 a.u. |
| RMS Gradient Norm | 0.00006421 a.u. |
| Imaginary Freq | |
| Dipole Moment | 0.0000 Debye |
| Point Group | D3H |
Item               Value     Threshold  Converged?
 Maximum Force            0.000085     0.000450     YES
 RMS     Force            0.000033     0.000300     YES
 Maximum Displacement     0.000251     0.001800     YES
 RMS     Displacement     0.000075     0.001200     YES
 Predicted change in Energy=-9.327721D-08
 Optimization completed.
    -- Stationary point found.
DOI:10042/23845 D-Space link to frequency analysis of borazine
 Low frequencies ---  -12.7051  -12.5402   -9.2469   -0.0099   -0.0090    0.0728
 Low frequencies ---  289.0949  289.1056  403.8434
Molecular Orbitals of borazine
DOI:10042/23846 Link to D-Space MOs of borazine
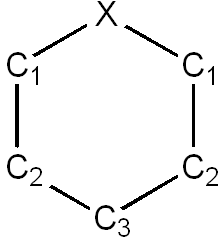
Bond lengths
| Compound | X-C1 / Å | C1-C2 / Å | C2-C3 / Å | X-C1 Literature bond length / Å | C1-C2 Literature bond length / Å | C2-C3 Literature bond length / Å |
|---|---|---|---|---|---|---|
| Benzene | 1.40 | 1.40 | 1.40 | 1.40 [9] | 1.40 [10] | 1.40 [11] |
| Boratabenzene | 1.51 | 1.40 | 1.41 | 1.47-1.50 (counter-ion)[12] | 1.37-1.39 (counter-ion)[13] | 1.38-1.39 (counter-ion)[14] |
| Pyridinium | 1.35 | 1.38 | 1.40 | 1.31-1.32 (counter ion) [15] | 1.37-1.38 (counter ion) [16] | 1.33 (counter ion) [17] |
Charge distributions
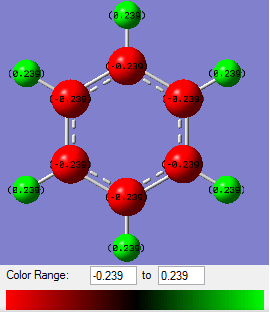
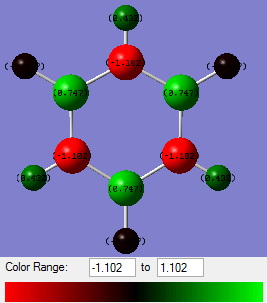
Using NBO analysis of the four compounds, the charge distributions of each have been calculated and are shown graphically below.
 |
 |
 |
 |
From benzene's NBO analysis it is seen that all the C atoms have equal negative charge and all the H atoms have equal positive charge. This is as expected.
In boratabenzene's case where [B-H]- has replaced a C-H, the molecule as a whole possesses a negative charge. The charge distribution across the molecule is no longer even. Instead, the two C1 atoms next to boron are the most negative; the furthest away carbon, C3, is slightly less negative, and the next-nearest neighbour carbons, C2, are the least negative of the carbon atoms. The boron atom itself, being electropositive, enjoys a positive charge. With the exception of the hydrogen attached to boron, the others are all slightly positive and approximately equal. The hydrogen attached to boron possesses a slight negative charge.
In pyridinium's case, where [N-H]+ has replaced a C-H, the molecule as a whole posseses a positive charge. The charge distribution is also no longer even. N, being very electronegative, possesses the bulk of the negative character. The attached hydrogen atom possesses a strong positive charge so is likely to be very Bronsted acidic in nature. The C1 atoms are slightly positive in nature. The C2 atoms are quite negative, and the C3 is slightly less strongly negative. The attached hydrogen atoms are positive and approximately equally so, but less so than that attached to the N atom.
Borazine
Borazine is comprised of electronegative N atoms and electropositive B atoms. The hydrogen atoms attached to N are more Bronstead acidic than the hydrogen atoms attached to B are hydridic.
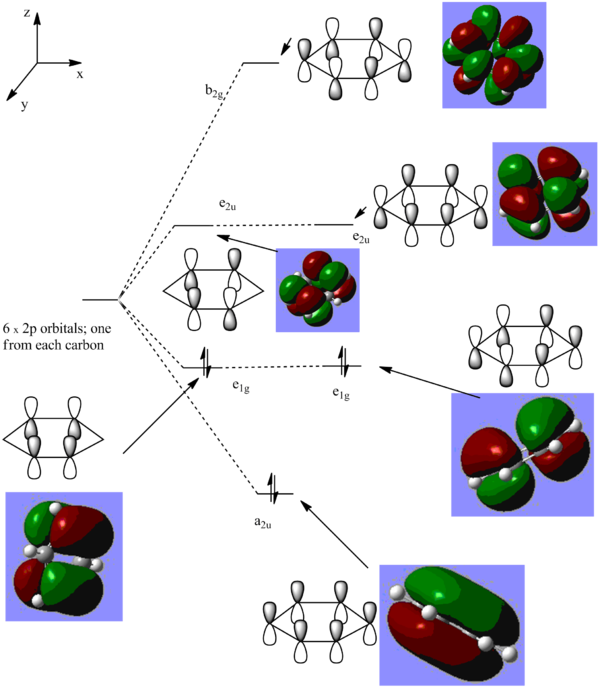
π- Molecular orbital diagram of benzene
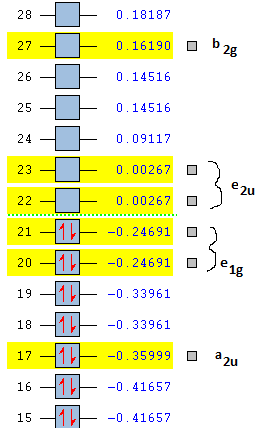
From the above diagram it can be seen how, from a linear combination of atomic orbitals from the 6 pz orbitals, 6 π-molecular orbitals are formed. It can also be seen that the HOMO-LUMO gap falls between the e1g MOs (which have 1 nodal plane) and the e2u MOs, which have 2 nodal planes, and are hence higher in energy.
Below it can be seen how the π-MOs lie in energy relative to each other. The numbers in a.u. are the relative (de)stabilisation energies of the π-MOs featured in the MO diagram.
Comparison of Molecular Orbitals of benzene and analogues
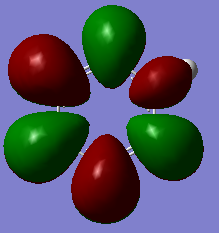
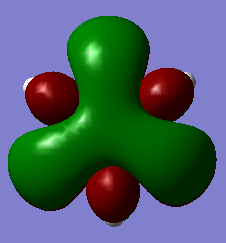
By looking at the lowest energy π-MO, and the highest energy π-MO, the effect of including a heteroatom in the ring can be examined.
| Lowest energy π-MO (1) | Highest energy π-MO (6) | |
|---|---|---|
| Benzene | 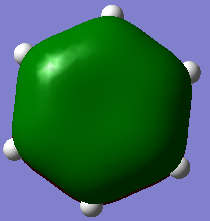 |

|
| Boratabenzene | 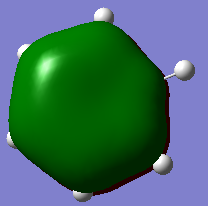 |

|
| Pyridinium | 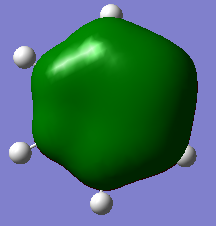 |
|
| Borazine | 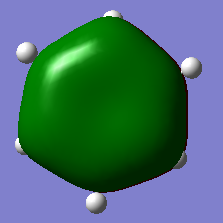 |
|
From the above table it can be seen that benzene has a even smearing of electron density in its molecular orbitals.
By contrast, for boratabenzene, boron pz contributes little to the bonding π-MO (1) and a lot to the antibonding π-MO (6). This is because boron is electropositive compared to carbon, as so the energy of (1) is raised.
For the pyridinium cationic compound, the electronegative N atom contributes strongly to (1) and so stablisises it..
HOMO
Boratabenzene and pyridinium have broken symmetry due to their heteroatom, which results in a break down of degeneracy of the MOs that was observed in benzene. For instance, the HOMO (MOs (2) and (3)) of benzene and borazine is degenerate whereas for boratazene and pyridinium MO (2) and (3) are no longer degenerate, and indeed swap in energy due to the electropositivity/negativity of the respective heteroatoms.
This can be seen in the diagram below.
N's greater contribution to the (3) MO, where N does not lie on the node, stabilises this MO relative to same MO of benzene. Likewise B's destabilises this MO relative to benzene, making MO (3) lie higher in energy.
Comparison of computed π-MO energies of analogues of benzene
| π-MO | Benzene | Borazine | Boratabenzene | Pyridinium |
|---|---|---|---|---|
| 1 | -0.35999 | -0.36129 | -0.13207 | -0.64067 |
| 2 | -0.24691 | -0.27590 | -0.03498 | -0.50844 |
| 3 (HOMO) | -0.24691 | -0.27590 | +0.01097 | -0.47886 |
| 4 (LUMO) | +0.00267 | +0.02422 | +0.21475 | -0.25839 |
| 5 | +0.00267 | +0.02422 | +0.23244 | -0.22034 |
| 6 | +0.16190 | +0.12498 | +0.37027 | -0.07319 |
It can be seen that indeed pyridinium MOs are indeed stabilised by the introduction of the N atom. Equally, that the opposite is true for boratabenzene by the introduction of B. The degeneracy of (2) and (3) is lost in both cases, as is the degeneracy of (3) and (4). For borazene, a distinct similarity to that of benzene is observed.
Conclusion
Computational chemistry techniques are a very useful tool to study chemistry outside of the laboratory. Results obtained have been compared to literature and have been found to be remarkably accurate. Here, by comparing analogues of benzene, it is seen that borazine is very similar to benzene which is in agreement with its reputation as 'inorganic benzene'. It is also seen how the introduction of electronegative and electropositive atoms into benzene destroy the high level of symmetry and have a dramatic effect on energy levels and molecular orbitals.
References
- ↑ M. Schuurman, W. Allen, H. Schaefer, Journal of Computational Chemistry, 2005, 26 (11), 1106
- ↑ Structure of Thallium(III) Chloride, Bromide, and Cyanide Complexes in Aqueous Solution Johan Blixt, Julius Glaser, Janos Mink, Ingmar Persson, Per Persson, and Magnus Sandstroem Journal of the American Chemical Society 1995 117 (18), 5089-5104
- ↑ H. Mansaray , A. Rowe , N. Phillips , J. Niemeyer , M. Kelly , D. Addy , J. Bates and S. Aldridge; Chem. Commun., 2011,47, 12295-12297
- ↑ T. Jaroń, W. Wegner, M.K. Cyrański, Ł. Dobrzycki, W. Grochala, Journal of Solid State Chemistry, 2012 191, 279-282
- ↑ A. Linden, M. James, M. Millikan,L. Kivlighon, A. Petridis B. James, Inorganica Chimica Acta 1999 , 284, (2), 215–222
- ↑ H. Mansaray , A. Rowe , N. Phillips , J. Niemeyer , M. Kelly , D. Addy , J. Bates and S. Aldridge; Chem. Commun., 2011,47, 12295-12297
- ↑ 7.0 7.1 7.2 DOI:10.1021/ja9825332
- ↑ Handbook of Bond Dissociation Energies in Organic Compounds By Yu-Ran Luo
- ↑ Essentials of Organic Chemistry by Paul M. Dewick
- ↑ Essentials of Organic Chemistry by Paul M. Dewick
- ↑ Essentials of Organic Chemistry by Paul M. Dewick
- ↑ Y. Yuan, et. al., Organometallics, 2011, 30 (16), 4330–4341
- ↑ Y. Yuan, et. al.,Organometallics, 2011, 30 (16), 4330–4341
- ↑ Y. Yuan, et. al.,Organometallics, 2011, 30 (16), 4330–4341
- ↑ D. Singh, et. al., Cryst. Growth Des., 2012, 12 (6), 3169–3180
- ↑ D. Singh, et. al.,Cryst. Growth Des., 2012, 12 (6), 3169–3180
- ↑ D. Singh, et. al., Cryst. Growth Des., 2012, 12 (6), 3169–3180

