Rep:Mod:mjb2018
BH3
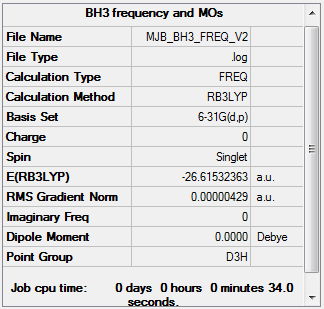
BH3 Molecule |
Calculation Method: RB3LYP
Basis Set: 6-31G(d,p)
         Item               Value     Threshold  Converged?
 Maximum Force            0.000009     0.000450     YES
 RMS     Force            0.000004     0.000300     YES
 Maximum Displacement     0.000034     0.001800     YES
 RMS     Displacement     0.000017     0.001200     YES
 Predicted change in Energy=-4.343399D-10
BH3 Frequency Analysis
Low frequencies ---   -2.2126   -1.0751   -0.0054    2.2359   10.2633   10.3194
Low frequencies --- 1162.9860 1213.1757 1213.1784
| Wavenumber (cm-1</-1>) | Intensity | Symmetry | IR Active | Types |
|---|---|---|---|---|
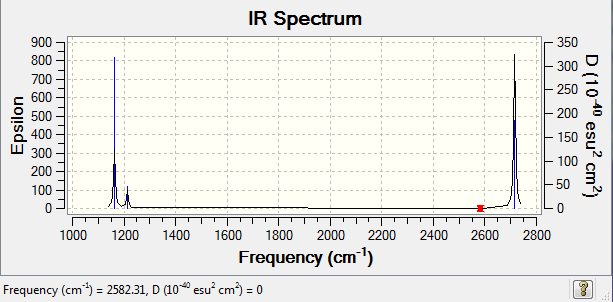
| 1163 | 93 | A2 | Yes | Out of plane bend |
| 1213 | 14 | E' | Very slight | Bend |
| 1213 | 14 | E' | Very slight | Bend |
| 2582 | 0 | A1' | No | Symmetric stretch |
| 2715 | 126 | E' | Yes | Asymmetric stretch |
| 2715 | 126 | E' | Yes | Asymmetric stretch |
Although there are 6 recorded vibrational modes, only 3 peaks can be found in the IR spectrum. This can be rationalised by considering both the energies and symmetries of the stretches. Firstly, the 2 E' bends and 2 E' asymmetric stretches are degenerate, and therefore only one peak can be seen for each. In addition, there is no peak for the symmetric stretch at 2582 cm< sup>-1 due to there being no change in dipole moment which accounts for the intensity being 0.
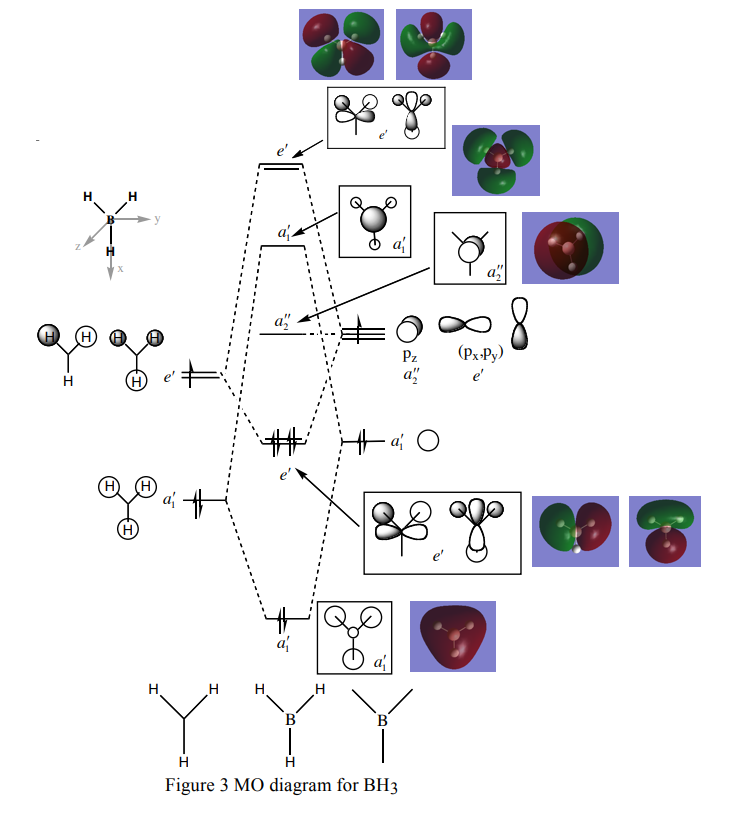
The MO diagram and associated Molecular Orbitals in the diagram above are very similar, for example, in the case of the a1' bonding orbital from LCAO indicates that the molecule will have an even distribution, all in the same phase. Looking at the corresponding computer generated MO, it can be seen that this is indeed the case. This is the same for all orbitals, which closely resemble the shapes predicted by LCAO.
The qualitative approach of LCAO, in the case of BH3 prove to be a useful and accurate representation of the computed MOs of BHBH3
The MO diagram can be found here: http://www.huntresearchgroup.org.uk/teaching/teaching_comp_lab_year2a/Tut_MO_diagram_BH3.pdf
Frequency file: File:MJB BH3 FREQ.LOG.
Smf115 (talk) 07:29, 17 May 2018 (BST)Excellent first section.
NH3
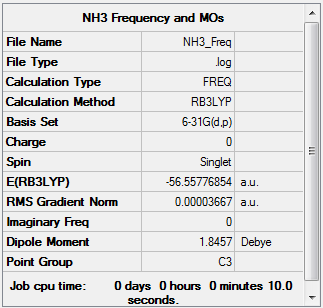
NH3 Molecule |
Calculation Method: RB3LYP
Basis Set: 6-31G(d,p)
         Item               Value     Threshold  Converged?
 Maximum Force            0.000094     0.000450     YES
 RMS     Force            0.000037     0.000300     YES
 Maximum Displacement     0.000367     0.001800     YES
 RMS     Displacement     0.000125     0.001200     YES
 Predicted change in Energy=-2.020152D-08
Low frequencies ---  -30.6570  -30.6559   -0.0049    0.0120    0.0479    4.3582
Low frequencies --- 1088.6591 1694.0274 1694.0274
The frequency file can be found File:MJB NH3 FREQ V2.LOG.
H3NBH3
H3NBH3 Molecule |
Calculation Method: RB3LYP
Basis Set: 6-31G(d,p)
         Item               Value     Threshold  Converged?
 Maximum Force            0.000250     0.000450     YES
 RMS     Force            0.000055     0.000300     YES
 Maximum Displacement     0.001412     0.001800     YES
 RMS     Displacement     0.000376     0.001200     YES
 Predicted change in Energy=-1.991144D-07
Low frequencies ---   -0.2218   -0.0607   -0.0067    9.4140   16.6128   16.6219
Low frequencies ---  262.9743  631.3044  638.8303
The frequency file can be found File:MJB NH3BH3 FREQ.LOG.
Calculations
N-B bond dissociation equation: ΔE = [E(NH3)+E(BH3)] - E(NH3BH3) N-B bond association equation: ΔE = E(NH3BH3) - [E(NH3)+E(BH3)]
| Molecule | Energy |
|---|---|
| BH3 | -26.61532 au |
| NH3 | -56.55777 (au) |
| H3NB3 | -83.22469 (au) |
| N-B Bond Dissociation | 0.0516 (au) |
| N-B Bond Dissociation | 135 kJmol-1 |
| N-B Bond Association | -135 kJmol-1 |
The N-B dative covalent bond dissociation energy (135 kJmol-1 shows that this is a relatively weak bond; this become apparent if you compare the N-B bond energy to the C-C bond dissociation energy, which is 377 kJmol-1 (90 kCal mol-1).
The C-C bond energy can be found here: https://en.wikipedia.org/wiki/Carbon%E2%80%93carbon_bond
BBr3
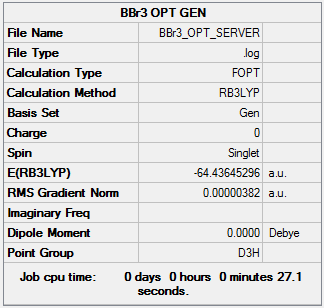
BBr3 Molecule |
Calculation Method: RB3LYP
Basis Set: 6-31G(d,p)
         Item               Value     Threshold  Converged?
 Maximum Force            0.000008     0.000450     YES
 RMS     Force            0.000004     0.000300     YES
 Maximum Displacement     0.000036     0.001800     YES
 RMS     Displacement     0.000018     0.001200     YES
 Predicted change in Energy=-4.106155D-10
Low frequencies ---   -0.0137   -0.0064   -0.0046    2.4315    2.4315    4.8421
Low frequencies ---  155.9631  155.9651  267.7052
The frequency file can be found File:MJB BBr3 FREQ.log.
Benzene
Benzene Molecule |
Calculation Method: RB3LYP
Basis Set: 6-31G(d,p)
         Item               Value     Threshold  Converged?
 Maximum Force            0.000194     0.000450     YES
 RMS     Force            0.000084     0.000300     YES
 Maximum Displacement     0.000767     0.001800     YES
 RMS     Displacement     0.000328     0.001200     YES
 Predicted change in Energy=-3.990543D-07
Low frequencies ---  -16.9682  -14.6636  -14.6636   -0.0055   -0.0054   -0.0003
Low frequencies ---  414.1239  414.1239  620.9400
The frequency file can be found File:MJB BENZENE FREQ.LOG.

Borazine
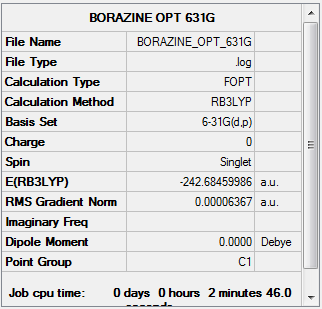
Borazine Molecule |
Calculation Method: RB3LYP
Basis Set: 6-31G(d,p)
         Item               Value     Threshold  Converged?
 Maximum Force            0.000192     0.000450     YES
 RMS     Force            0.000064     0.000300     YES
 Maximum Displacement     0.000287     0.001800     YES
 RMS     Displacement     0.000101     0.001200     YES
 Predicted change in Energy=-1.057014D-07
Low frequencies ---   -0.0008   -0.0004    0.0009    3.0582    5.3062    8.6873
Low frequencies ---  289.6594  289.7991  404.4112
The frequency file can be found File:MJB BORAZINE FREQ.LOG.
Benzene vs. Borazine
Charge Distribution
Benzene (left). Borazine (right). The charge distribution of bezene shows that there is more electron density located around the carbon atoms that the hydrogens. This can be rationalised by the electronegativity values of the two atoms, 2.55 (C) and 2.20 (H). The distribution in Borazine is significantly different. It can also be rationalised using electronegativity values, 2.20 (H), 2.04 (B) and 3.04 (N). The red atoms indicate Nitrogen atoms, which have the most electron density centred on them. The green atoms in the ring correspond to Boron, and have less electron density centred on them. The hydrogen atoms have uneven charge distribution. The hydrogen attached to Boron atoms have a similar charge distribution to Boron, as the electro negativities are similar (hydrogen has a slightly negative charge distribution and boron positive). The hydrogens attached to Nitrogen atoms, however, have much less electron density due to the high electronegativity of the adjacent N atom, hence the charge electron distribution is positive around them.
Smf115 (talk) 07:28, 17 May 2018 (BST)Good discussion of the electronegativity of the atoms and reference to the electronegativity values (the scale used should be mentioned though!). To improve consider other points such as symmetry and the overal neutral charge of the molecules. The charge distribution needed to be highlighted by an identical colour range too across the molecules.
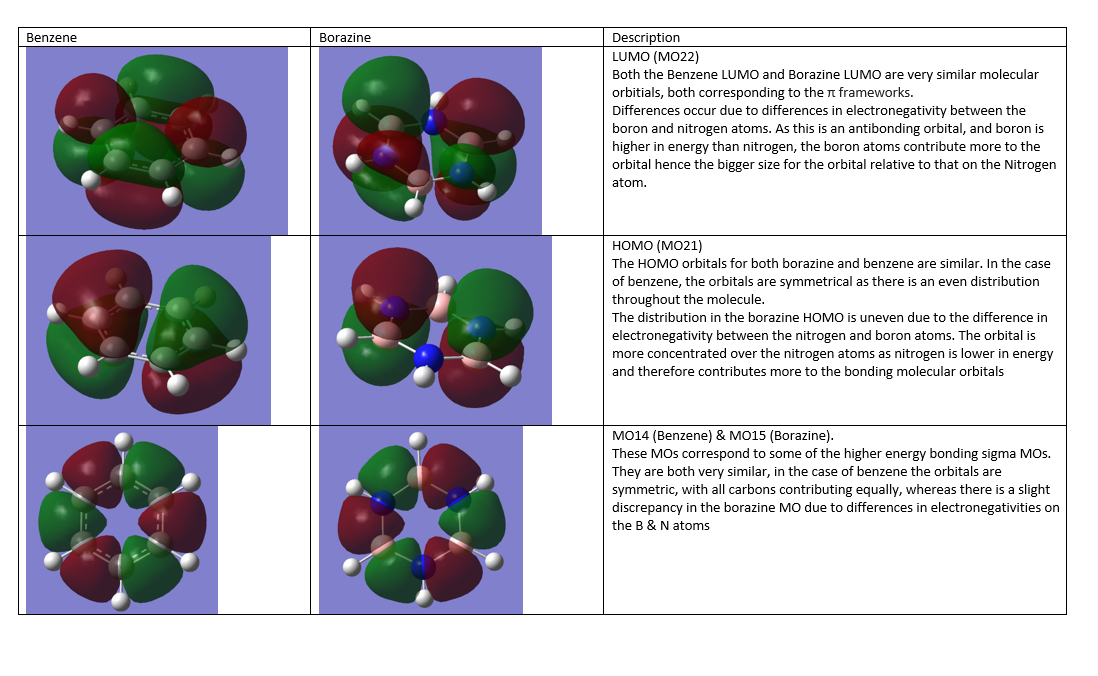
Molecular Orbitals
Smf115 (talk) 07:26, 17 May 2018 (BST)Great comparison of the MOs with correct terminology used to describe the MOs.
Aromaticity
The simplified view of aromaticity is encapsulated by Huckel's rules which are as follows:
- 4n + 2 π electrons in a conjugated system of p orbitals (where n is an integer value).
- Planar
- Cyclic
- Continuous ring of p atomic orbitals
The rules are very useful for simple systems, such as benzene, in which the aromatic behavior can be well represented by Huckel's rules, however, they have been unable to explain many modern examples of molecules that display aromaticity. For example, molecules such as metallobenzenes and spherical systems such as fullerenes all display aromaticity, however do not follow Huckel's rules strictly, for example fullerenes break the rules of planarity.
In addition, it was originally thought that only p orbitals contributed to aromaticity. However, recent discoveries have proven that σ-electron structure is of importance.
Reference: https://onlinelibrary.wiley.com/doi/epdf/10.1002/chem.200700250
Smf115 (talk) 07:25, 17 May 2018 (BST)The key concepts of aromaticity have been laid out and mention given to sigma-aromaticity. However, it would have been nice to develop this idea a bit further and to think about more complex ideas of aroamticity alongisde reference to MOs.
Smf115 (talk) 07:30, 17 May 2018 (BST)Overall a good report with a very thorough first section in particular.

