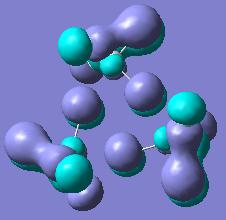
Rep:Mod:mj506 mod2
BCl3 introduction module
A molecule of BCl3 was optimized using Gaussian software. The method and basis set used were B3LYP/3-21G. The optimized B-Cl bond distance was calculated to be 1.77503 A, and the Cl-B-Cl angle was exactly 120.000o.
The calculation output included the following information: File type: .log, Calculation type: FOPT, Calculation method: RB3LYP, Basis set: 3-21G, Final energy: -1398.8 a.u., Dipole moment: 0 Debye, Point group: D3H, Calculation took 22 seconds.
COCl2 optimization
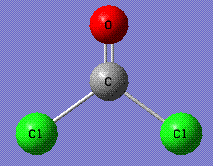
A molecule of COCl2 was optimized using Gaussian software (calculation time: 37.0 seconds). Calculation method was RB3LYP with 3-21G basis set. The xyz coordinates of the optimized molecule http://hdl.handle.net/10042/to-1178:
---------------------------------------------------------------------
Center     Atomic     Atomic              Coordinates (Angstroms)
Number     Number      Type              X           Y           Z
---------------------------------------------------------------------
   1          6             0        0.000000    0.576144    0.000000
   2          8             0       -0.000087    1.760776    0.000000
   3         17             0       -1.510797   -0.516082    0.000000
   4         17             0        1.510838   -0.515863    0.000000
---------------------------------------------------------------------
The C-Cl bond distance is 1.86426 A, and the C=O bond distance is 1.18463 A.
The Cl-C-Cl bond angle is 108.3o, and the Cl-C=O bond angle is 125.9o.
The final energy of the molecule is -1028.7 a.u.
The dipole moment is 0.2681 Debye.
The point group (according to Gaussian output) is CS, but that is incorrect, as the actual point group of COCl2 is C2v.
BH3 vibrations
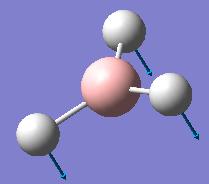
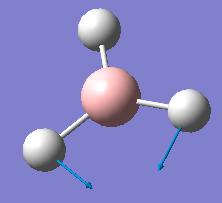
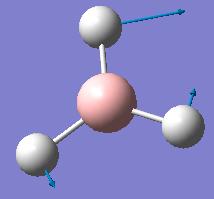
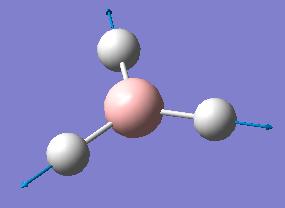
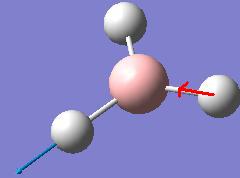
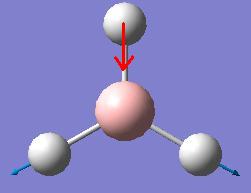
Vibrational frequencies of the optimized BH3 molecule were obtained using B3LYP method with 3-21G basis set. Vibrations are summarized in the table below.
The Infrared spectrum, as predicted with Gaussian software, is given below. It must be noted that although we see 6 vibrations in the table above, there are only 3 peaks in the spectrum below. It is due to two pairs of the vibrations being degenerate, thus resulting in peaks occuring at same frequencies, and one vibration, the number #4 one, is totally symmetric and that vibration does not change the dipole moment of the molecule, a selection rule for the peak to appear in the infrared spectrum. All the other vibrations do change the dipole moment of the molecule and thus appear in the IR.
Molecular Orbitals of BH3
Molecular orbitals were obtained from BH3 molecule using B3LYP method with 3-21G basis set. Bond angles were manually set in the .gjf file to be equal to 120o so the correct point group is obtained - D3H. MO's as drawn by qualitative MO approach and the corresponding calculated MOs are shown below.
| Symmetry of MO | MO obtained with B3LYP | MO obtained with qualitative method |
|---|---|---|
| a1' | 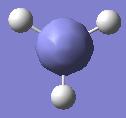 |

|
| a1' | 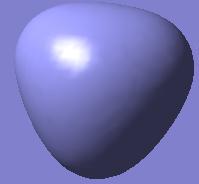 |

|
| e' | 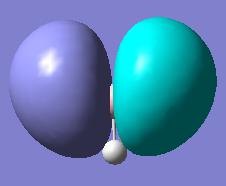 |

|
| e' | 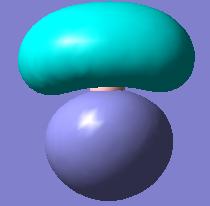 |

|
| a2 | 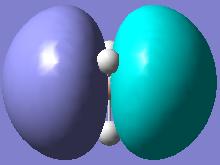 |

|
As can be seen from the diagrams above, there are no significant differences between the MOs obtained by qualitative MO approach and by quantitative, except for the size of the orbitals. Obviously, as no quantification is used in the qualitative MO approach, only intuition can be used to guess the size of the orbitals, but for the software approach, exhaustive mathematical methods are used to obtain the sizes as exact as possible. This shows that for basic purposes, qualitative MO approach is very powerful technique, as it does not involve any elaborate calculations, but just simple symmetry considerations and yields relatively accurate bonding picture of the molecule in question.
Isomers of Mo(CO)4(P(CH3)3)2
Geometric parameters and optimization of trans and cis compounds
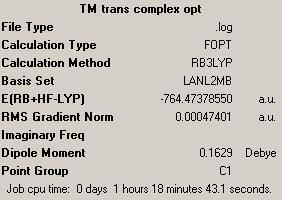
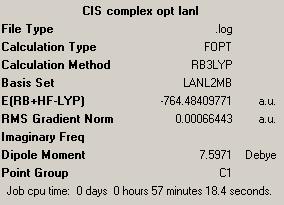
Molecules of trans and cis Mo(CO)4(P(CH3)3)2 were drawn in ChemBio3D and optimized using MM2 method. It was then saved as .gjf files and optimized first using B3LYP method with LANL2MB basis set and parameter opt=loose. The summary output can be seen in the boxes on the right. Then the optimized structure was taken and optimized further using B3LYP method with LANL2DZ basis set, using additional keywords int=ultrafine and conver=scp=9. These were uploaded on the digital repository, trans complex and cis complex.
| Trans complex http://hdl.handle.net/10042/to-1187 | Cis complex http://hdl.handle.net/10042/to-1188 | ||||||
|---|---|---|---|---|---|---|---|
|
|
Literature values of trans and cis Molybdenum tetracarbonyl bis(triphenylphosphine) bond distances were found[1] and are outlined in the table below, along with the computational values.
| Compound | Mo-P bond length | P-Mo-P angle | Mo-C bond length | C-Mo-C angle | C=O bond distance |
|---|---|---|---|---|---|
| Cis | 2.648 A | 42.4o | 2.032 A and 1.983 A | 88o and 90o | 1.188 A and 1.191 A |
| Cis lit. | 2.654 A | N/A | N/A | N/A | N/A |
| Trans | 2.572 A | 177o | 2.030 A | 88.9 o | 1.191 A |
| Trans lit. | 2.544 A | N/A | 2.020 A | 92.17o | N/A |
The computational values agree with experimental ones pretty impressively well, and one could attribute the difference in Mo-P bonds due to methyl groups used in calculation instead of phenyl ones. Other than that, the bond lengths agree very well, and that again shows that the calculation did not go wrong.
Vibrational frequencies of the trans and cis compounds
The vibrational frequencies were calculated using B3LYP method with LANL2-DZ basis set. Experimental values for trans[2] and cis[3] compounds. The calculated and experimental values are compared in the table below.
| Compound | Frequency | Intensity | Frequency from lit. |
|---|---|---|---|
| Cis | 1848 | 1069 | 1860 |
| http://hdl.handle.net/10042/to-1194 | 1850 | 1961 | 1880 |
| 1869 | 665 | 1891 | |
| 1960 | 321 | 2013 | |
| Trans | 1837 | 1999 | 1891 |
| http://hdl.handle.net/10042/to-1195 | 1837 | 1997 | 1891 |
| 1881 | 6.7 | none | |
| 1953 | 2.9 | none |
The differences between the computed and experimentally observed vibrational frequencies arise due to different substituents at phosphorus (in calculation methyl groups were used, while experimentally it was phenyls). Other than that, values agree pretty well. Cis shows more absorptions in the IR due to lower symmetry of the molecule, being C2v, and so symmetric stretches are also visible in the IR spectrum. While trans complex is D4h and the symmetric stretches do not change the dipole moment and thus are not visible in the IR. If Gaussian had determined the correct point group in the first place, vibrations at 1881 and 1953 cm-1 would have been with 0 intensity.
Vibrations in the trans compound are slightly lower in frequency than for the cis compound.
General comparison of cis and trans
The energy obtained (with LANL2-DZ basis set) in atomic units for trans compound was -773.35737509, and for cis was -773.36024020. Thus the difference between them is E(cis)-E(trans)= -0.00286511 Hartrees = -7.520 kJ/mol. That means the cis compound is more stable, which is sort of counter intuitive, as one would expect the cis compound to be more sterically strained.
The cis compound is stabler due to some sort of trans effect, as both C=O pi* orbital and phosphorus d orbitals are competing for Molybdenum d electrons. When the compound is trans, the two pairs of C=O compete for the same d electrons, and C=O is a better acceptor of the d electrons than the Phosphorus ligand. Hence, when phosphorus are aligned trans, C=O gets less Molybdenum d electrons and phosphorus gets more, thus the stabilisation energy is lower and the cis isomer is preferred. In order to stabilise the trans isomer, one would add strong electron withdrawing ligands to phosphorus (e.g. CN, F), and in order to stabilise the cis isomer, one would add strong electron donating ligands to phosphorus (e.g. OH, NH2).
Investigation of Ammonia molecule
Geometry optimization of Ammonia molecule
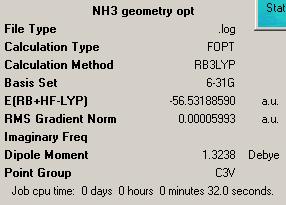
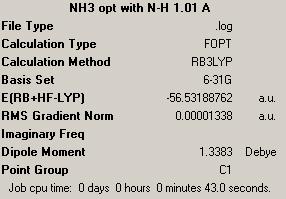

The geometry was optimized of the ammonia NH3 molecule using B3LYP method with 6-31G basis set. The summary of the calculation output is given on the right. Point group obtained was C3v, just as one would expect. Then the bond length of initial NH3 molecule of one N-H bond was increased to 1.01 A (others were set at 1.00 A) and optimization was run again, with B3LYP method with 6-31G basis set. The summary is shown on the right. And finally, geometry optimization was run on a planar NH3 molecule to obtain the D3h symmetry. Summary is also provided on the right.
The symmetry, which was defined initially by setting atomic positions to pre-defined values, confuses Gaussian at it fails to obtain the correct symmetry. That was observed on the molecule in which one N-H bond was made 0.01 A longer. In that optimization, Gaussian obtained C1 symmetry and the N-H bond was 0.00001A shorter than the other two. While for the other molecules, which were defined with correct symmetry in the initial input file, the geometries obtained are as one would expect: with the same N-H bond lengths, bond angles. The D3h obtained is planar.
For the Highest symmetry D3h, the calculation time was 1min 18s, for C1 it was 43s and for C3v it was 32s, thus the initial symmetry does make a difference to the calculation time.
The molecule cannot break symmetry during an optimisation, and thus if you enter a high symmetry molecule to optimise, you have to make sure you enter it with the correct symmetry initially, as Gaussian will make sure the optimisation is made on the symmetry initially provided.
The lowest energy geometry of these three optimisations was obtained for the C1 symmetry.
The C3v isomer is higher in energy by 1.72 * 10-6 a.u. = 4.51 J/mol.
The D3h isomer is higher in energy by 3.46 * 10-4 a.u. = 907.4 J/mol.
The energy difference between these isomers is not significant and is pretty small, as the room temperature (298K) would give 2477 J/mol, which is more than sufficient to populate all three symmetries in significant proportions (using Boltzmann distribution).
Using higher level calculation
Geometry was optimised for C3v molecule using MP2 method with 6-311G(d,p) basis set. The calculation took 33s, which is just 1s more than for the B3LYP with 6-31G basis set. The NH3 molecule with D3h symmetry was also optimized using MP2 with 6-311G(d,p) basis set, and the calculation took 1min 40s, which is 22s longer than the corresponding calculation using B3LYP with 6-31G basis set.
Energy difference between the C3v and D3h symmetries was calculated to be 7.796 * 10-3 a.u. = 20.47 kJ/mol, which is an increase from 0.903 kJ/mol for the B3LYP calculation! That is indeed a huge difference - an increase by 2100%. And this new value compares very well with the experimental value of 24.3 kJ/mol, although not perfect.
Vibrations of NH3

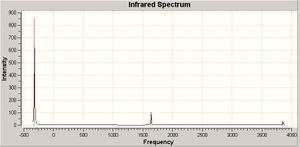
Vibrational spectrum of the optimized NH3 molecule with D3h and C3v were calculated using the B3LYP method with 6-31G basis set. The frequencies are given in a table below.
| Symmetry | Frequency | Intensity |
|---|---|---|
| D3h | -318 | 849 |
| 1640.59 | 55.9828 | |
| 1640.59 | 55.9805 | |
| 3635.71 | 0 | |
| 3854.27 | 19.5951 | |
| 3854.27 | 19.5963 | |
| C3v | 452.3 | 599.5 |
| 1680.47 | 41.7256 | |
| 1680.47 | 41.7245 | |
| 3575.43 | 0.0688 | |
| 3775.76 | 7.0892 | |
| 3775.76 | 7.0884 |
Vibrations for C3v, the 1680 and 3775 vibrations have the E symmetry label, the 452 vibration and the 3575 one have A1 symmetry label.
There are five positive vibrations for the D3h symmetric ammonia and six positive vibrations for the C3v symmetric ammonia. Comparing the actual vibration modes of motion, one can see that the vibrations match visually with the order in which they are written down above in the frequency table. That makes perfect sense, as the point group C3v is a subgroup of D3h, and thus the same vibrational motions are observed, but energies for them differ.
The IR spectra for C3v can be compared to one obtained experimentally
The negative frequency in D3h at -318 cm-1 is the one that follows the inversion path. It has a negative value due to the way Gaussian calculates the IR spectra: it is more energetically favourable for it to be in the excited vibrational state, as it is then in the C3v symmetric state, and so energetically more favourable. The symmetry label for it is A2''
Investigation of TiX4
Aims and objectives of the experiment
Compounds of titanium tetrahalogenates have been chosen as the subject of this mini-project. These compounds will be investigated in terms of their geometry, energy, bonding, vibrational frequencies and some other aspects, namely why TiCl4 is a liquid while TiF4 is a solid at room temperature.
Energies of formation and geometries of TiX4
Geometries of TiX4, here X = F, Cl, Br and I were optimized using B3LYP method with LANL2DZ basis set. All the geometries observed were tetrahedral and thus the point group is Td for all four compounds. In order to calculate and compare energies of formation, energies of X2 have also been calculated using the same basis set.
| Molecule | Energy in a.u. | Calculation |
|---|---|---|
| Ti singlet | -57.90831089 | LANL2DZ |
| Ti triplet | -57.96110151 | LANL2DZ |
| F2 | -199.54456711 | LANL2DZ |
| Cl2 | -29.84319939 | LANL2DZ |
| Br2 | -26.30904851 | LANL2DZ |
| I2 | -22.76939316 | LANL2DZ |
Energies obtained above were used to calculate the energies of formation of TiX4. These were obtained by optimizing the TiX4 structures using B3LYP with LANL2DZ basis set, and using the energy to obtain the difference in energy upon TiX4 formation. Namely, dEformation = E(TiX44) - E(Ti) - 2E(X2). Triplet state of titanium was used, as it is lower in energy.
| Molecule | Energy of molecule in a.u. | Energy of Ti + 2X2 | dEformation in a.u. | dEformation in kJ/mol |
|---|---|---|---|---|
| TiF4 | -457.81688363 | -456.9974451 | -0.81943851 | -2151.4 |
| TiCl4 | -118.12849433 | -117.5947097 | -0.53378463 | -1401 |
| TiBr4 | -110.97655098 | -110.5264079 | -0.45014299 | -1182 |
| TiI4 | -103.82494445 | -103.4470972 | -0.37784719 | -992 |
The energy of formation values might not be exactly correct, but the trend is definitely as one would expect it to be. Fluorine is very reactive, and titanium would react readily with it releasing a lot of energy, and the trend goes down with decreasing electronegativities, increasing size of atoms and decreasing electron affinities of the halogens going down the group.
Vibrational frequencies of TiX4
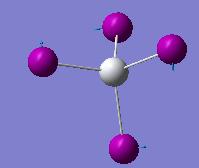
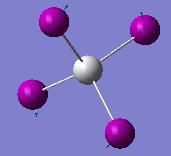
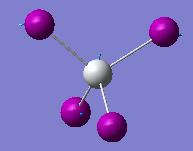
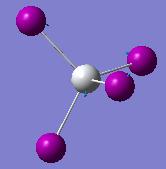
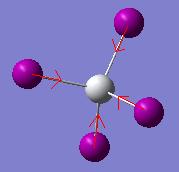
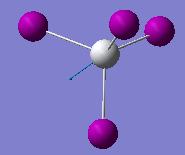
Vibrational frequencies were also calculated of the TiX4 species using B3LYP method with LANL2DZ basis set. As the point group of all four compounds is Td, there are 9 modes of vibration, but only 4 different, as there are degenerate modes. And only two peaks are IR visible, as they change the dipole moment. These are summarised for the Td point group below, including the calculated vibrational frequencies of the four compounds.
Above vibrational frequencies follow the trend expected, as increasing mass of halogens decreases the frequency of vibration, by formula . Here k is the force constant (relatively corresponding to the bond strength) and is the reduced mass.
Comparing the vibrational frequencies of TiF4 to the ones obtained experimentally[4], there is a good agreement, as experimentally there is a peak at 800 cm-1 and at 209 cm-1 in the gas phase. The solid state will be investigated later.
Molecular Orbitals of TiX4
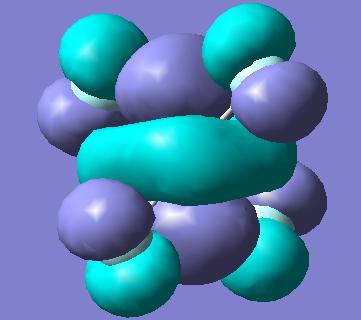
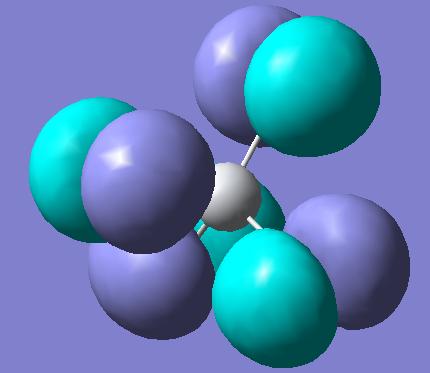
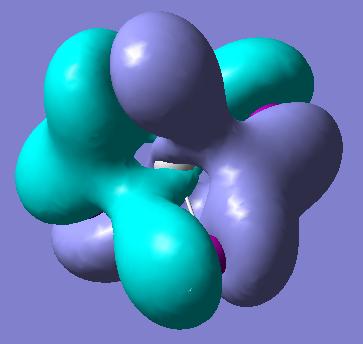
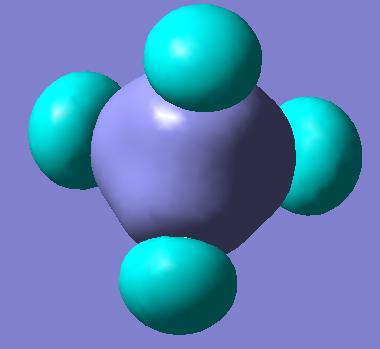
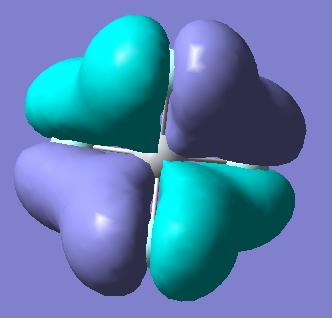
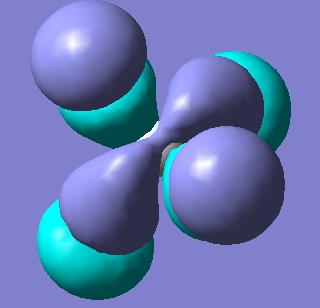
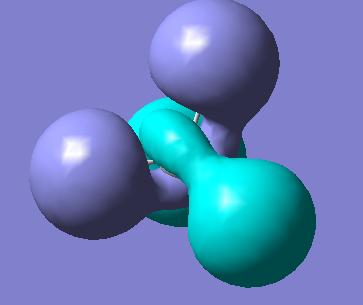
Molecular orbitals were also obtained using the B3LYP method with LANL2DZ basis set. The MO orbitals for all the species involve same atomic orbitals, just the energies of the resulting MO orbitals are different. Due to approximations of the LANL2DZ model, the MO's visually are not perfectly matching of the four TiX4 species, but by close inspection one can tell that the same np and ns atomic orbitals are being used on both X and Ti (d orbitals of Ti are used in bonding as well). As the molecule is highly symmetric, there are a lot of degenarate MO's and so below only one from each set of degenerate orbitals are shown. It is interesting to note that HOMO of the molecule are the lone pairs on X, while the LUMO of the molecule is dz2 along with degenerate d(x2-y2.
Below is a table showing molecular orbitals of TiF4, but one should note that visually the MOs look the same for all four TiX4 compounds.
Solid state investigation into TiF4 and TiCl4
It has been reported that TiF4 is a solid while TiCl4 is a liquid at room temperature and atmospheric pressure. In fluoride, the titanium adopts octahedral structure and forms a trimer Ti3F15, while TiCl4 prefers tetrahedral geometry and does not form any type of oligomeric/polymeric structure at room temperature[5]. This phenomenon has been investigated using B3LYP method with LANL2DZ basis set. First, Ti3X15-3 where X=F and Cl were optimized to see if the energetically favourable form is where the fluorine coordinates two titanium atoms, or if the molecules would prefer to not be coordinated together in any way. The results were quite pleasing, as one found that Ti3F15-3 does form an oligomeric structure, and fluorine coordinates two Ti atoms, with bond lengths of bridge fluorine Ti-F being 2.01A and of terminal fluorine Ti-F 1.837A. The bond length in tetrahedral fluoride is Ti-F 1.761A, thus one can conclude there is significant bonding in the trimer structure. Opposite if found for the chloride structure, as calculations indicate the atoms are far apart, and the bridging Ti-Cl bond would be 13A, suggesting no bond present. The titanium adopts trigonal bipyramidal structure with bond lengths of Ti-Cl bond being 2.3A, as compared to 2.2A in tetrahedral TiCl4.
| Ti3F15-3 unable to publish to d-space |
Ti3Cl15-3 unable to publish to d-space |
|---|---|
 |

|
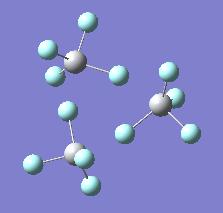
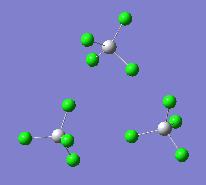
Another calculation was performed on Ti3F12 trimer and Ti3Cl12, just to confirm the above investigation with neutral species. The results were once again quite pleasing, just confirming again that titanium fluoride prefers to form oligomeric structures, while the chloride prefers to adopt monomeric structure and not to coordinate. The structures and bond lengths are given below:
| Ti3F12 structure | Ti3Cl12 structure | Ti-F terminal | Ti-F bridging | F->Ti dative | Ti-Cl terminal | Ti-Cl bridging | Cl->Ti dative |
|---|---|---|---|---|---|---|---|
 |
 |
1.7548A | 1.8775A | 2.1259A | 2.1956A | 2.1956A | 4.69 A |
One can see that indeed in the titanium chloride, no dative bonding is present and the compound adopts monomeric tetrahedral structure, thus rendering it liquid, as in contrast to oligomeric structures of titanium chloride, rendering it a solid at room temperature. One might expect some trimer forming in the gas phase of fluoride as well, and that could be checked by weak presence of some additional vibrations in the IR spectrum, but a full IR spectrum of TiF4 could not be found anywhere in the literature (all 5 references checked that were found using Crossfire, only a few peaks were given without the actual spectra). But presence of trimer structures in the gas phase would be very low, as the temperature is significantly higher than the room temperature, and so the molecule would have enough energy to break apart to constituent monomers.
Vibrational frequencies were calculated for the Ti3F15-3 compound. Experimentally, solid-state Raman spectra was recorded before[4], with the peaks at: 817, 770, 494, 466, 367, 236, 208 and 138 cm-1. The calculations gave main peaks at: 735, 633, 575, 464, 270 cm-1. Thus, the calculation of the trimer as having a -3 charge and Ti adopting octahedral structure using B3LYP method with LANL2DZ basis set does NOT give good vibrational frequencies.
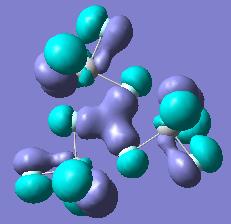
Molecular orbitals were investigated of Ti3F12, just to understand how do the orbitals change upon trimerisation from the tetrahedral one. There are several bonding orbitals which result from this oligomerization, and some of them are presented below:
Actually, I was not able to find any more bonding orbitals in the pictures obtained from LANL2DZ basis set, as either the pictures were unclear, or there were only anti-bonding interactions. One would expect, however, that the p orbitals on bridging fluorines overlap with p or d orbitals of titanium.
Log files for gaussian
As d-space does not accept my Gaussian log files, I have uploaded them here:
Ti3Cl12 opt freq mo: https://www.ch.imperial.ac.uk/wiki/images/4/45/Ti3cl12_lanl2dz_opt_freq_mo.out
Ti3F12 opt freq mo: https://www.ch.imperial.ac.uk/wiki/images/7/71/Ti3f12_lanl2dz_opt_freq_mo.out
Ti3Cl15(3-) opt freq mo: https://www.ch.imperial.ac.uk/wiki/images/b/b1/Ti3cl15_lanl2dz_opt_freq_mo.out
Ti3F15(3-) opt freq mo: https://www.ch.imperial.ac.uk/wiki/images/a/ad/Ti3_f15_lanl2dz_opt_freq_mo.out
and as one of the TiX4 examples, TiF4: https://www.ch.imperial.ac.uk/wiki/images/3/38/TIF4_OPT_FREQ_MO.LOG
References
- ↑ E.C. Alyea, G. Ferguson, S. Kannan, Acta Cryst. (1996), C52, 765-676 DOI:10.1107/S010827019600100X
- ↑ G.J. Kubas, J. Chem. Soc., Chem. Commun., 1980, 61-62, DOI:10.1039/c39800000061
- ↑ C.G. Kreiter, Inorganica Chimica Acta, Vol 284, 2, 1999, 229-236 DOI:10.1016/S0020-1693(98)00293-X
- ↑ 4.0 4.1 I.R. Beattie, P.J. Jones, J. Chem. Phys. 90, 5209 (1989) DOI:10.1063/1.456542
- ↑ C. Housecroft, Inorganic Chemistry, 2nd edition, 2004

