Rep:Mod:mh3413MgO
Thermal expansion of MgO
Introduction and Objective
By utilizing the DL Visualize program running the GULP (General Utility Lattice Program) on a Linux platform, the thermal expansion for the MgO lattice structure was able to be explored using computational methods. The quasi-harmonic and molecular dynamics methods of calculations for the lattice volume were compared and contrasted. From the relationship found between the volume dependence on the temperature, the thermal expansion co-efficient was able to be established and compared with literature values.
Description of MgO lattice
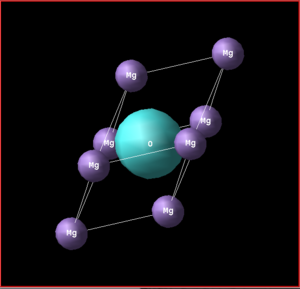
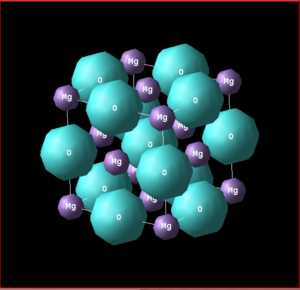
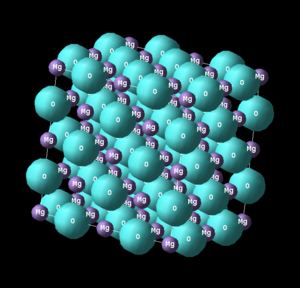
The MgO lattice structure consists of oppositely charged Mg2+ and O2- ions held together by electrostatic coulomb forces. The conventional FCC (face centred cubic lattice) unit cell contains a total of 8 atoms, with each respective species located in octahedral configuration; a = b = c and α = β = γ = 90°. The primitive unit cell has a rhombohedron structure, with 2 atoms (one of each atom): a = b = c and α = β = γ ≠ 90. The MgO supercell that was used in the calculations of the Molecular Dynamics, contained 64 atoms as it was double the conventional cell length in each directional axis. Using these cell templates, the properties of an infinite sized lattice for MgO were able to be simulated. [1]
Calculating the Thermal Expansion
When a material is heated, the thermal energy is transferred to the atoms of the structure. The majority of the energy would be transferred as kinetic energy and would lead to the atoms vibrating about their co-ordinates. Further heating would lead to elongation of the bond lengths and volume of the cell. This increase in the volume of the material is called expansion. The thermal expansion is a useful physical quantity as it is able to quantify how the material changes in volume with the changes in temperature.
This coefficient is an intrinsic thermodynamic quantity and therefore can be applied to the systems of any size.[1]
Quasi-Harmonic Lattice
In a lattice structure above 0K, the thermal energy means that the atoms are able to vibrate about their equilibrium positions. By analyzing the vibrations of the system, many properties of the structure were determined, including the thermal expansion. As the structure of the infinite crystal can be described to be a periodically repeating unit cell, the properties of this system can also be approximated to be periodic under a Bloch function. The theory of the electronic wavefunctions in the Bloch Theorem can be applied to vibrations in a cell.
k is a wavevector that is used in the describe each of the vibrational states in reciprocal space. It has the following relationship to the wavelength. [1][2]
Where λ = wavelength of the vibrational wave
Note: When , the . All the vibrating motion of the species are in phase and the dispersion is at the lowest energy. When , and , the species are out of phase. As the vibrating mode has the greatest number of possible nodes, it would have the highest energy. [3]
Reciprocal space is a Fourier transform of the Bravais lattice into the imaginary space dimension. This is constructed on the periodicity of the crystal structure, where the lattice vectors in the real space are able to be inverted into the reciprocal space. The planes in real space, are perpendicular to the planes in the reciprocal space. Mathematically, the interconversions between these spacial dimensions are described using the formulae below.
For the 3-D case: a1, a2, a3 are primitive vectors in the real space.
Where b1, b2, b3 are primitive vectors in the reciprocal space.
Under the wave-particle duality theory, each vibrational wave oscillating with single frequency can be considered to be a phonon particle. The phonon is a quantum particle that carries a discrete and quantized vibrational energy. Each vibration of the system has a k-value, and is used in the reciprocal space to simplify the periodic system to the first Brillouin zone. By summing over the k values, the number of vibrations were found and summing over all of the branches (vibrational modes), the Helmholtz free energy of the lattice was able to be calculated. The equation below defines the relationship between the frequency of oscillation and the k-value for a one dimensional system.
Under the quasi-harmonic lattice approximation, the vibrations of the crystal are approximated to be harmonic vibrations (quadratic dependence upon deviations from equilibrium). This a good approximation near the equilibrium position in the potential well of the Lennard Jones potential, but large deviations from equilibrium would not be realistic as the equilibrium bond distance would remain constant for all temperatures. The model does not predict bond dissociation for any given amplitude of vibration or energy exerted on the system. There is no volume dependence on temperature. As a result, the harmonic oscillator would fail to predict lattice volume expansion with temperature. The quasi-harmonic approximation takes into account the volume dependence of phonon free energy by calculating the volume and minimum value of F (helmholtz free energy) for each given temperature. [1] This is equivalent to calculating the harmonic lattice vibration along a anharmonic interaction potential at constant pressure. In addition, the Lennard potential contains a repulsive term in the equation for the potential energy surface that prevents the atoms getting too close to one another.
The quantum mechanical harmonic oscillator is used in this model, each vibrational level is defined by the following equation:
where n = 0,1,2 ..... is the vibrational quantum state
NOTE: This is only for a 1-dimensional harmonic oscillator [4]
U0 = the vibrational zero point energy of the system
If this is extended to a 3-D harmonic oscillating case as in the example for the MgO, the equation would become:
Molecular Dynamics
The molecular dynamics utilities classical mechanics to approximate the thermal expansion of the MgO lattice in a isothermal–isobaric ensemble (NPT ensemble). The atoms are initially given properties such as a configuration and random velocities. At each time step, the program computes the forces and acceleration upon each of the particles and updates the atomic velocities and positions accordingly.
The simulations run for the MgO structure had 500 timesteps, with a time interval of 1.0 femtosecond to ensure that the crystal lattice had reached thermal equilibrium conditions at the specified temperature. The temperature timesteps were taken at 9 regular intervals between 100 - 1000K. Furthermore, 500 production steps were run after the equilibration of the system to obtain the time-averages for quantities such as lattice parameter. The sampling steps and trajectory write steps were set to a value of 5.
Results and Discussions
Calculating the internal energy of an MgO crystal
The total lattice energy for the MgO primitive cell was found to be -3963.14 (2dp) kJ/mol OR -41.08 (2dp) eV using the quasi-harmonic model. This is the energy that is required to separate the charged ions in the cell to an infinite distance apart. Compared to an experimental value of 3033.4 kJ/mol [5]. The computational model overestimates the lattice enthalpy due to the theoretical assumptions of a perfect crystal with no defects, as well as charges of Mg2+ and O2-.
The lattice length of the rhombohedron primitive unit cell length has the following relationship with the conventional unit cell length via the pythagorean theorem .
As:
Lattice Vibrations - Computing the Phonons
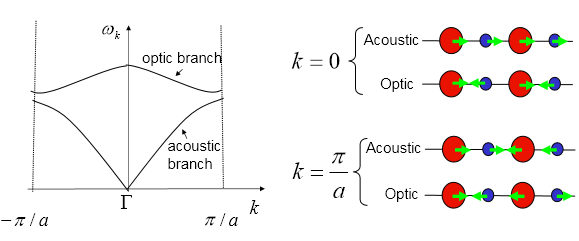
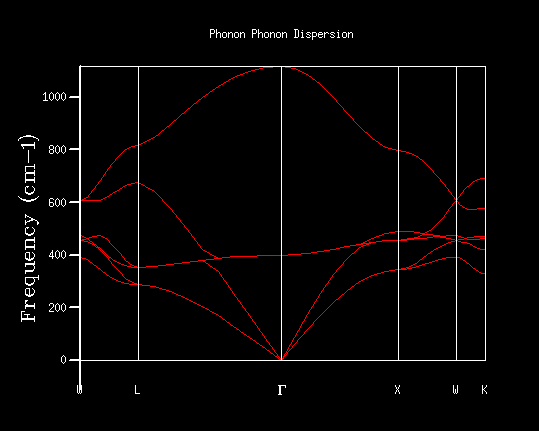
The figure below represents the MgO crystal phonon dispersion ω(k), illustrating how the energy varies against the 3-D k-space dimension. It provides a snapshot of the number of vibrational states and its energies at each of the respective symmetry points. The branches are split into two regions as shown in figure 4. The upper branch presents 2 optical vibrational modes, where the Mg and O atoms move in opposite directions, while in the lower branches there are 2 acoustic vibrational modes. One of the acoustic modes is doubly degenerate in energy resulting in a total of 3 modes. This is in agreement with theoretical predictions of 3N – 3 optical modes.
 |
 |
|---|---|
| Figure 4: Optical and acoustic vibrational modes in the crystal [1] | Figure 5: Shrinking factor 1: 1x1x1 MgO lattice phonon dispersion |
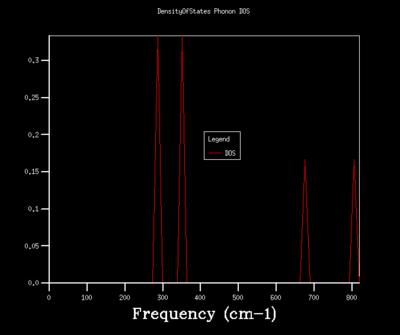
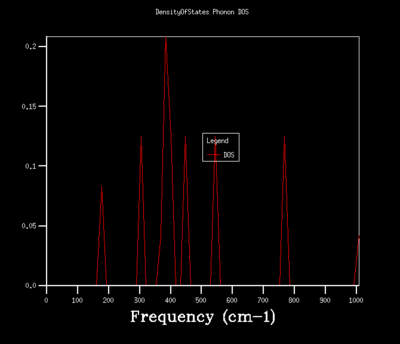
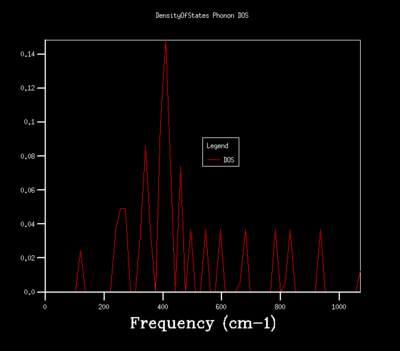
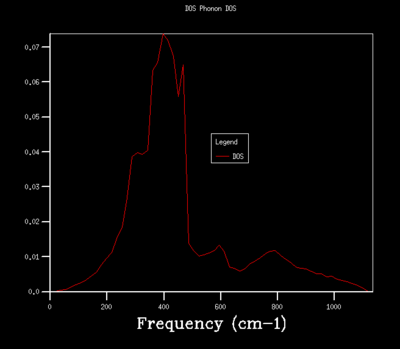
Figures 6-14 illustrates the density of the states (DOS) for the phonon dispersion in the MgO crystal system with varying shrinkage factors. The density of states is the number of occupied or unoccupied vibrational states per unit of energy at each energy level. The Boltzmann distribution determines whether these states are occupied. Under the quasi-harmonic model, the phonon DOS is calculated using the lattice parameter at various temperatures, which allows the calculation of the volume that minimizes the Helmholtz free energy A(V,T) energy.
A 1x1x1 grid size corresponds to 1 cell. There was only one observed vibration motion; all the particles moving in phase. The density of states (Figure 6) was computed for the single k-point, corresponding to the L-symmetry point. 4 definite peaks were found, corresponding to 6 vibrational states, two of which were degenerate. This is the number of vibrational states that are represented in figure 5 for the dispersion relationship; the number of points that intersect the L-symmetry point at 288.49, 351.76, 676.23 and 818.82 cm-1. The 288.49 and 351.76 cm-1 are doubly degenerate vibrational energy levels as seen by the doubled amplitudes. For a larger grid size, there are a larger number of unit cells included in the simulations and therefore, a larger number of possible combinations in vibrational modes; there are a larger number of k values sampled.
Increasing the shrinkage factors, increased the number of k-points sampled and resolution of the Phonon DOS. This was due to the greater number of unit cells simulated and a larger number of vibrational modes being observed. In a real space dimension, the increase of the shrinkage factor would increase the grid size, but as the k-space is the respective inverse, the grid size is reduced and more detail of the k-point vibrations are able to be captured. As the shrinkage factors are increased by 2 for the majority of the graphs presented, the DOS peaks remained in the same positions with a higher resolution and smoother graph captured.
As b1, b2, b3 are primitive vectors in the reciprocal space.
Calculating the Free Energy in the Harmonic Approximation
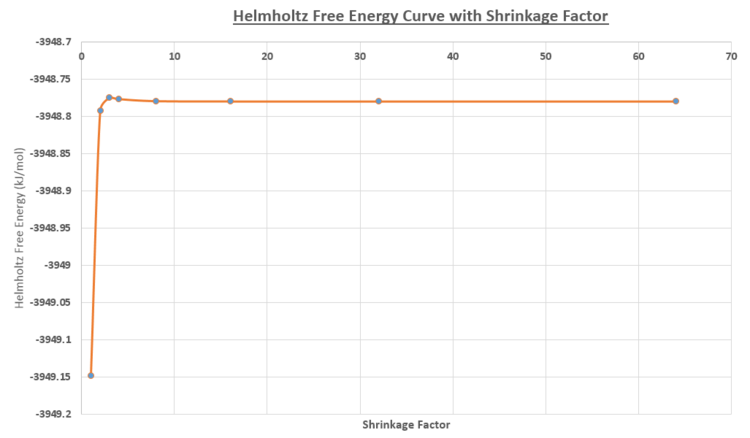
The Helmholtz free energy was calculated by summing over all the vibrational modes (ie k values) for the infinite crystal size. The calculations varied the shrinkage factor grid size, while maintaining at a temperature of 300K and pressure of O GPa. As shown in figure 14 and the table below, increasing in shrinkage factor resulted in the convergence of the Helmholtz Free Energy to -3948.78 (2dp) kJ/mol. The 64x64x64 grid produced the most accurate free energy approximation, but was the most computationally time consuming due to the greater number of k-points that were calculated. The difference in energy relative to the 64 shrinkage factor, indicates that there was minimal difference between the 64 and 32 shrinkage factor grid. The 32x32x32 grid size was chosen as an appropriate compromise between the computational time and the accuracy of the results.
Smaller sized grids lose the resolution of a greater number of k-values investigated, while there is minimal difference between the 32 and 64 grid size in terms of the curves and free energy.
The density of states are related to the dispersion curves, as the DOS captures the proportion of vibrational states at each energy level (frequency), while the dispersion curve calculates the energy (frequency) for each of the k-space points.
The 32x32x32 grid size for the MgO would be suitable to apply to a similar oxide (eg: CaO), as the ions have similar sizes, bond lengths, ionic charges are in a 1 to 1 ratio. In addition, the CaO forms the same FCC structure for the conventional cell and primitive unit cell. For a Zeolite (eg: Faujasite) structure, the unit cells would be much larger in real space and inversely smaller in the reciprocal k-space than the MgO structure. The b1, b2, b3 primitive vectors would be smaller and therefore smaller shrinkage factor can be applied to achieve the same level of detail DOS captured in the 32x32x32 of MgO. For a metal eg lithium, as the primitive vectors in real space are smaller than in MgO, the vectors in reciprocal space would be larger than in MgO. A larger shrinkage factor would be required to achieve sufficient sampling of the k-space to produce a detailed DOS. A greater number of k-points would need to be calculated.
As the 64 shrinkage factor was the most accurate grid size approximation, the other grid size free energy values were calculated relative to this grid size. As seen in the table below, the 2x2x2 grid size was found to be suitable for calculations within 0.5 meV and 1.0 meV error per cell. The 3x3x3 was suitable for calculations within an error of 0.1 meV per cell from the converged free energy value.
| Shrinkage Factor | Helmholtz Free Energy (kj/mol) | Helmholtz Free Energy (eV) | Difference in energy relative to 64 shrinkage factor (kj/mol) | Difference in energy relative to 64 shrinkage factor (eV) |
|---|---|---|---|---|
| 1 | -3949.148006 | -40.930301 | -0.368358 | -3.82E-03 |
| 2 | -3948.79181 | -40.926609 | -0.012162 | -1.26E-04 |
| 3 | -3948.774713 | -40.926432 | 0.004935 | 5.10E-05 |
| 4 | -3948.776419 | -40.92645 | 0.003229 | 3.30E-05 |
| 8 | -3948.779123 | -40.926478 | 0.000525 | 5.00E-06 |
| 16 | -3948.77958 | -40.926482 | 6.8E-05 | 1.00E-06 |
| 32 | -3948.779641 | -40.926483 | 7E-06 | 0.00E+00 |
| 64 | -3948.779648 | -40.926483 | 0 | 0.00E+00 |
 |
|---|
| Figure 14: Helmholtz Free Energy curve for varying shrinkage sizes |
The Thermal Expansion of MgO
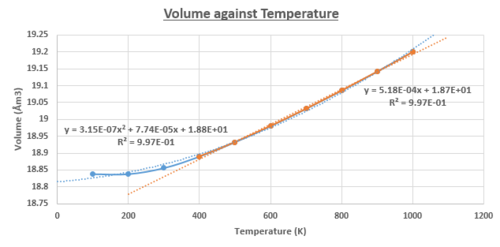
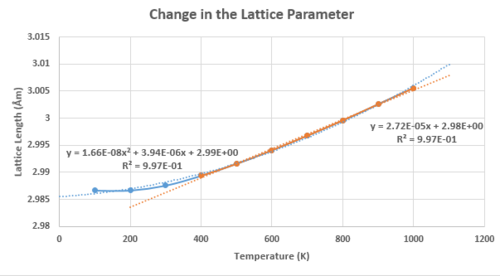
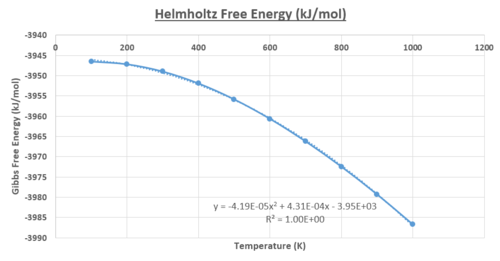
Using the quasi-harmonic approximation, the thermal expansion for the 32x32x32 cell was investigated at a constant pressure. There was a temperature range where the physical and thermodynamic values for the system were calculated for. It can be seen in figures 15 - 17, that all the relevant physical and thermodynamics properties had parabolic dependencies to the temperature, below T<400K.
In figure 17, the Helmholtz Free Energy decreases in an inverse parabolic behaviour, with respect to the temperature. This is due to the increasing entropy of the system with the increasing temperature, driving the decrease in the Helmholtz free energy. Both the lattice cell length and volume have trends that follow a positive parabolic relationship with respect to the temperature. The equation that was used to fit the trends of the lattice parameter and volume data presented very few deviations, with a value of R2 = 0.997. For the Gibbs free energy, the agreement was perfect with a R2 = 1.00 for a parabolic behaviour and therefore, the linear region was not investigated. Taking the linear region of the figure 15 (T>400K), it was assumed the gradient was constant; increment of the volume for each temperature step investigated was constant. The equation presented a very good fit and correlation, with a value R2 = 0.997.
The following assumptions were made in this model:
- There are no defects present in the crystal structure eg schottky and frenkel defects
- No impurities in the structure
- All the Mg2+ and O2- have same the respective charges
- The interaction potentials can be modelled by the anharmonic Lennard Jones Potential
- The bonds have the same force constant under the harmonic oscillator approximation
- The energy of the bonds can be approximated to be a quadratic function of distance from the equilibrium bond length
- The vibrations are independent of one another; there are no correlations
- The Born-Oppenheimer approximation allows the separation of the electronic and the nuclear wavefunctions. These wavefunctions are independent of one another.
Temperature Range 0 - 400K
The plot of the volume against the temperature was used to determine the thermal coefficient of expansion.
This indicated a linear temperature dependence on the thermal expansion. It is predicted that as the temperature gets larger, the increment of change in volume would get larger. This is characteristic behaviour for the parabolic system. Similar results have been observed in experimental literature over a temperature range from 300 - 1250K. [6]
Temperature Range > 400K
However, approximating the thermal expansion co-efficient being independent of temperature, the following equations in the linear regions (T>400K) of figure 15 and 16 were calculated.
The thermal expansion of the MgO is physically driven by the increase in the amplitude of the vibrations for the Mg-O bond. This translated into the deviations in the bond lengths from the harmonic potentials. This leads to the increase in the average lattice constant and the volume of the unit cell.
As stated previously, each vibrational level in the quantum harmonic model is defined by the following equation:
where n = 0,1,2 ..... is the vibrational quantum state
The population of occupied vibrational quantum states is determined by the boltzmann distribution.
The boltzmann distribution indicates that the increase in temperature would populate higher vibrational energy levels and so the average amplitude of the bonds in the crystal structure would increase. Under the anharmonic interaction potential model, the increase in temperature would lead to a change in the equilibrium bond length of the Mg-O that reflects the real life systems. The diatomic molecule with an exact harmonic potential would not experience a change in the equilibrium bond length upon increasing temperature, as it would oscillate about the same equilibrium point.
The quasi-harmonic approximation does not consider the possibility of phase transitions in the MgO material from the solid to the liquid phase as there cannot be bond dissociation. As the temperature approaches the melting point of MgO (3125K), the model would predict the expansion the lattice volume and therefore would not be reflective of the actual ion movements. In addition to the assumptions made above, the quasi-harmonic approximation can be only be used sufficiently below the melting point of a material.
Comparing the Molecular Dynamics with the Quasi-Harmonic Approximation
The molecular dynamics method used Newtonian mechanics to investigate the thermal expansion of the MgO crystal structure. The atomic species were initally assigned random velocities and then regularly updated according to the forces and acceleration applied to the system. In addition, the positions of the species were updated for each timestep which would induce the vibrations. In addition, for each temperature there would be a inter-atomic distance that minimizes the potential energy - corresponds to the equilibrium bond distance. The atoms in this model have random movements which are able to stimulate phase transitions and the real motions of particles in materials.
| Temperature | Average Volume (Am3) | Standard Deviation (Error) | Percentage Error (4dp) |
|---|---|---|---|
| 100 | 18.73 | 1.24E-04 | 0.0007% |
| 200 | 18.77 | 1.99E-04 | 0.0011% |
| 300 | 18.84 | 6.89E-04 | 0.0037% |
| 400 | 18.85 | 2.65E-03 | 0.0140% |
| 500 | 18.93 | 5.59E-03 | 0.0295% |
| 600 | 19.00 | 4.39E-04 | 0.0023% |
| 700 | 19.07 | 2.77E-03 | 0.0145% |
| 800 | 19.12 | 1.31E-03 | 0.0068% |
| 900 | 19.15 | 2.25E-03 | 0.0117% |
| 1000 | 19.24 | 1.72E-03 | 0.0089% |
| 1500 | 19.54 | 2.58E-03 | 0.0132% |
| 1750 | 19.66 | 2.41E-03 | 0.0123% |
| 2000 | 19.86 | 3.82E-04 | 0.0019% |
| 2500 | 20.20 | 1.46E-03 | 0.0072% |
| 5000 | 23.38 | 2.16E-02 | 0.0926% |
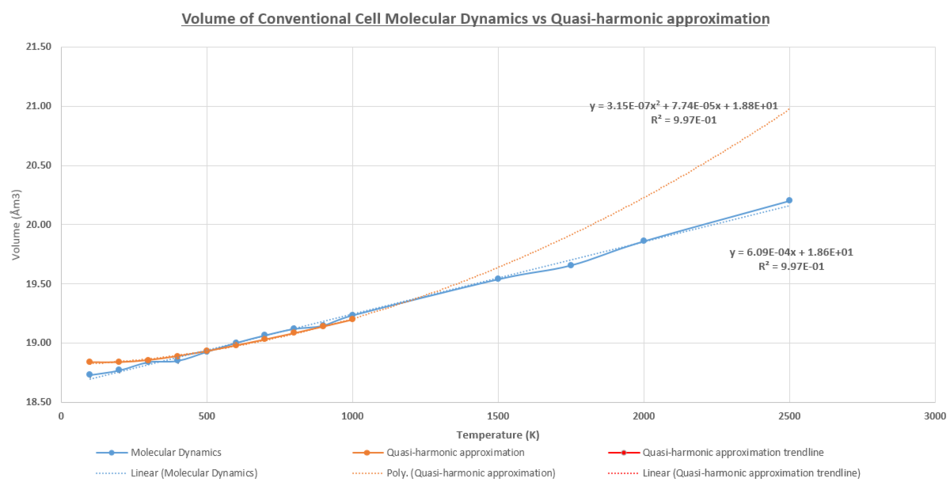
Like the quasi-harmonic approximation, the molecular dynamic simulations in figure 18 had a linear dependence of volume with temperature. There was good agreement between the line of best fit and the simulation data points; a strong positive correlation of the volume dependence with temperature R2 = 0.997. Furthermore, volume calculated at each temperature value was repeated 5 times to calculate the standard error associated with the simulation. As expected, there was an increase in the error associated with the measurement for higher temperatures, due to the larger fluctuations.
Below 400K, the molecular dynamics volume simulates a lower volume and deviates from the quasi-harmonic model. This was due to the energy values of the molecular dynamics being continuous. The energy of the vibrational energy in the harmonic oscillator can be close to zero. In the quasi-harmonic system the quantum zero point is the lowest energy possible due to the Heisenberg uncertainty principle. In addition, the equilibrium bond length in the potential well of the anharmonic system would be slightly elongated relative to a pure harmonic system. This would lead to a higher lattice parameter and hence volume of the system. There was good agreement in the volumes predicted for both models in the temperature region 400K < T ≤ 1000K. There were no significant deviations observed at the 1000K. However, as shown in figure 18 there would be deviations predicted for higher temperatures, as the bonds in the quasi-harmonic model can expand to infinite length, while the molecular dynamics the system are able to undergo a phase transition to the liquid phase. It was concluded that the quasi-harmonic approximation was the better approximation, at lower temperatures when the Mg-O bonds were closer to an equilibrium bond length, while the molecular dynamics was a better model for higher temperatures as it took into account the phase transitions.
Although the cell volumes calculated for the two methods were similar in the 400 - 1000K regions, the models produce different thermal expansion co-efficient values. The molecular dynamics had a higher thermal expansion co-efficient with αV = 3.26 (2dp) x 10-5 K-1. The quasi-harmonic model predicted values closer to literature values. This is due to the literature calculating the co-efficient at temperatures below 600K, where this model is a better approximation to the real life systems. Nevertheless, both computation models produced values that were twice the quoted values of literature.
| Simulations | Quasi-Harmonic Approximation | Molecular Dynamics |
|---|---|---|
| Thermal Expansion Co-efficient Experimental | 2.77 (2dp)x 10-5 K-1 | 3.26 (2dp)x 10-5 K-1 |
| Thermal Expansion Co-efficient Literature | 1.45 × 10⁻⁵ K−1 [6] | |
| Thermal Expansion Co-efficient Literature | 1.31 × 10⁻⁵ K−1 [7] | |
 |
|---|
| Figure 18: Comparing the cell volume in the Molecular Dynamics and the Quasi-Harmonic Approximation model |
Conclusion
This experiment investigated the thermal expansion co-efficient for the MgO crystal structure using two computational methods. The quasi-harmonic approximation used a harmonic approximation at constant pressure on an anharmonic potential surface to take into account the volume dependence of phonon free energy. This allowed the calculation of the volume for each cell and minimization of F (helmholtz free energy) for each temperature. The molecular dynamics method used Newtonian mechanics to calculate the velocity and position for each of the species in the lattice structure. Upon reaching thermal equilibrium, the average lattice volume was calculated by time-averaging and running repeat simulations. The thermal co-efficient calculated for this range was higher than literature values, due to the limitations of the model assumptions. Both models predicted the similar values of cell volume between 400K to 1000K, but deviations appeared below and above this range due to the differences in the mechanics and assumptions made. It was concluded that the quasi-harmonic approximation was a better model at lower temperatures and the molecular dynamics at higher temperatures.
- ↑ 1.0 1.1 1.2 1.3 1.4 Introduction to the Computational Laboratory,Giuseppe Mallia , http://www.ch.ic.ac.uk/harrison/Teaching/Thermal_Expansion/Introduction.pdf, Accessed: March 2017.
- ↑ Vibrations and Free Energy, Prof. Nicholas Harrison ,http://www.ch.ic.ac.uk/harrison/Teaching/L4_Vibrations.pdf, Accessed: March 2017.
- ↑ How Chemistry and Physics Meet in the Solid State, Hoffmann Roald, Angewandte Chemie International Edition in English, Angew. Chem. Int. Ed. Engl, DOI - 10.1002/anie.198708461, Accessed: March 2017.
- ↑ Professor Fernando Bresme, Statistical Thermodynamics, Physical Chemistry, Imperial College London, November 2016.
- ↑ Quantum-mechanical description of ions in crystals: Electronic structure of magnesium oxide, Víctor Luaña, J. M. Recio, and L. Pueyo, Phys. Rev. B 42 1791, Accessed: March 2017.
- ↑ 6.0 6.1 Studies on Thermophysical Properties of CaO and MgO by - Ray Attenuation,A. S. Madhusudhan Rao and K. Narender, Journal of Thermodynamics Volume 2014 (2014), Article ID 123478, 8 pages, Accessed: March 2017. Cite error: Invalid
<ref>tag; name ":4" defined multiple times with different content - ↑ Austin, J. B., Journal of the American Ceramic Society, 1931 , vol. 14, p. 798 - 798 Accessed: March 2017.

