Rep:Mod:makersmark
Inorganic Computational Chemistry - Part 1 - Set Studies
Introduction
Inorganic computational chemistry comes in to its own when considering the form and energy of activated complexes and their transition states, the analysis of which is not experimentally facile. The ability to obtain thermodynamic information from the energy of stable states, and kinetic information from barrier heights (the energy of a transition state), allows for selective and intelligent design of inorganic species, such as transition metal catalyts.
Notes
The energy of 1 Hartree is equal to 2625.5 kJ/mol, and the accuracy of our calculations are to ~1 kJ/mol from Gaussian therefore the accuracy of the energy is taken to 4 s.f.
A summary of accuracies is tabulated:
| Property | Accuracy |
| optimised bond distance/Å | 2 d.p. |
| optimised bond angle/° | 1 d.p. |
| final energy/a.u. Or Hartree) | 4 s.f. |
| gradient/a.u. Or Hartree/Bohr | 4 s.f. |
| dipole moment/debye | 2 d.p. |
| Calculation time/seconds | 1 d.p. |
Also, please note that where a file could not be published to D-Space, it has been uploaded to the wiki in the same way as an image file and linked.
Small Molecules
BH3
The BH3 molecule was optimised (gjf input file https://www.ch.ic.ac.uk/wiki/images/8/8a/Hemal_bh3_opt.gjf) to give the following data:
| Property | Value |
| optimised B-H bond distance/Å | 1.19 |
| optimised H-B-H bond angle/° | 120.0 |
| file type | .log |
| calculation type | F0PT |
| calculation method | RB3LYP |
| basis set | 3-21G |
| final energy/a.u. Or Hartree) | -26.46 a.u. |
| gradient/a.u. Or Hartree/Bohr | 0.00005905 |
| dipole moment/debye | 0.00 |
| Point group | D3h |
| Calculation time/seconds | 19.0 |
| Jmol Applet |
The output file can be found at https://www.ch.ic.ac.uk/wiki/images/2/23/HEMAL_BH3_OPT.LOG.
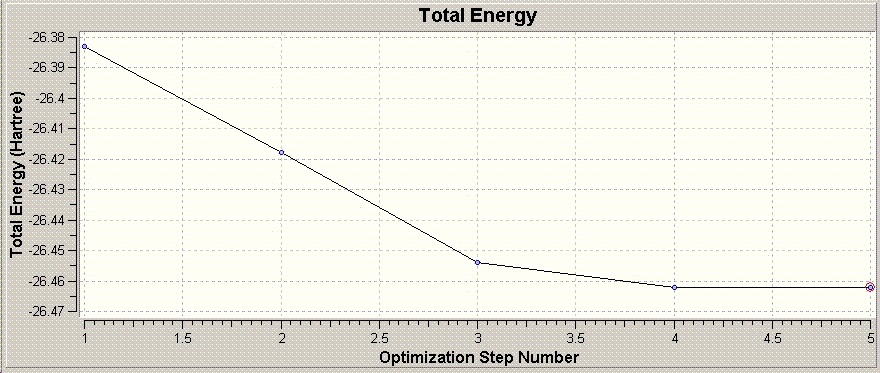
The graph shown above shows the total energy of the system at each step in the optimisation. Guassian optimises the molecule by looking for a potential energy minimum, and will makes successive "intelligent" changes to the molecule to find this.
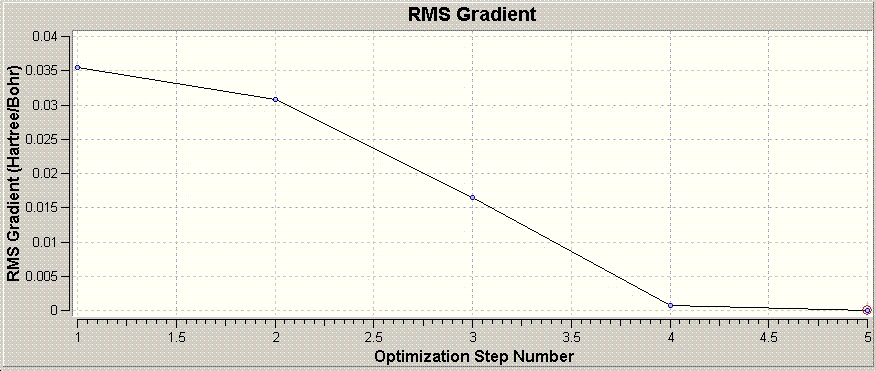
An energy minima is where the potential energy of the molecule does not show (appreciable) change in energy between two successive optimisations, and hence the RMS gradient is zero. The RMS gradient at various optimisation steps is shown graphically above.
BCl3
The BCl3 molecule was optimised (gjf input file:https://www.ch.ic.ac.uk/wiki/images/4/44/Hemal_bcl3_opt.gjf) to give the following data:
| optimised B-Cl bond distance/Å | 1.87 |
| optimised Cl-B-Cl bond angle/° | 120.0 |
| file type | .log |
| calculation type | FOPT |
| calculation method | RB3LYP |
| basis set | LANL2MB |
| final energy/a.u. Or Hartree) | -69.44 |
| gradient/a.u. Or Hartree/Bohr | 0.00005905 |
| dipole moment/debye | 0.00 |
| Point group | D3h |
| Calculation time/seconds | 12.0 |
| Jmol Applet |
The output file can be found at https://www.ch.ic.ac.uk/wiki/images/2/24/HEMAL_BCL3_OPT.LOG.
Independent Small Molecule - CS2
The CS2 molecule was optimised using two different basis sets in Gaussian to give the following data:
| Property | Value - 3-21G | Value - 6-31G(d,p) |
| optimised C-S bond distance/Å | 1.59 | 1.56 |
| optimised S-C-S bond angle/° | 180.0 | 180.0 |
| file type | .log | .log |
| calculation type | F0PT | FOPT |
| calculation method | RB3LYP | RB3LYP |
| basis set | 3-21G | 6-31G(d,p) |
| final energy/a.u. Or Hartree) | -830.3 | -834.5 |
| gradient/a.u. Or Hartree/Bohr | 0.00000116 | 0.00000069 |
| dipole moment/debye | 0.00 | 0.00 |
| Point group | D*h | D*h |
| Calculation time/seconds | 214.4 | 103.5 |
| Jmol Applet | ||
| Dspace | http://hdl.handle.net/10042/to-1889 | http://hdl.handle.net/10042/to-1890 |
It can be seen that the higher level basis set gives a bond length closer to the lit. value of 1.553Å[1].
The xyz co-ordinates for both optimisations are pulled from the .log files to give:
3-21G

 ---------------------------------------------------------------------
 Center     Atomic     Atomic              Coordinates (Angstroms)
 Number     Number      Type              X           Y           Z
 ---------------------------------------------------------------------
    1          6             0        0.000000    0.000000    0.000000
    2         16             0        0.000000    0.000000    1.594161
    3         16             0        0.000000    0.000000   -1.594161
 ---------------------------------------------------------------------

6-31G(d,p)

 ---------------------------------------------------------------------
 Center     Atomic     Atomic              Coordinates (Angstroms)
 Number     Number      Type              X           Y           Z
 ---------------------------------------------------------------------
    1          6             0        0.000000    0.000000    0.000000
    2         16             0        0.000000    0.000000    1.563108
    3         16             0        0.000000    0.000000   -1.563108
 ---------------------------------------------------------------------
BH3-Vibrational Analysis
Starting with the previous optimised geometry, the vibrations of BH3 were calculated. The vibrations calculation was also run using the B3LYP method and the 3-21G basis set.
The vibration results showed no negative frequencies, showing that the molecule was fully optimised at a minima, and the energy of the molecule in the vibration calculations was the same as the optimisation calculation to 8 d.p.! (-26.46226438 a.u.), showing that the vibrations calculation was run on the same structure as our optimisation calculation.
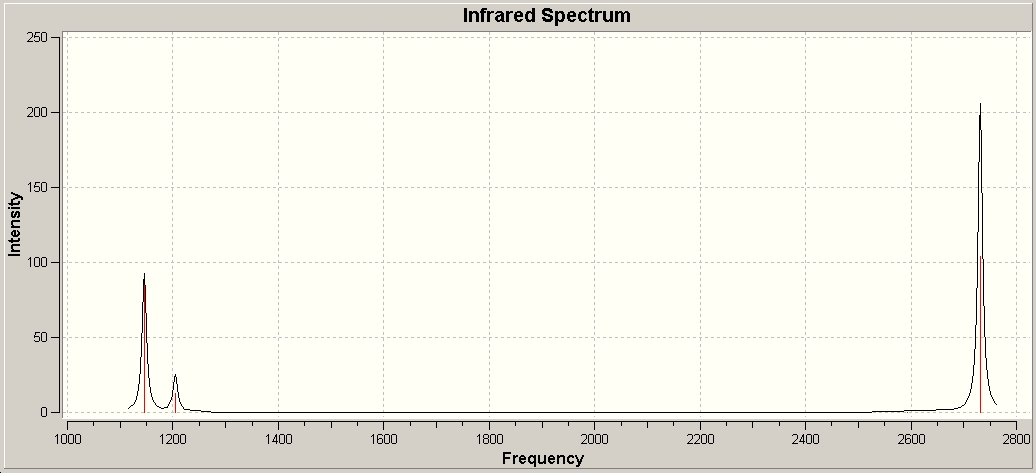
| No. | Form of the Vibration | Frequency/cm-1 (3sf) | Intensity (3sf) | Symmetry D3h point group |
| 1 | 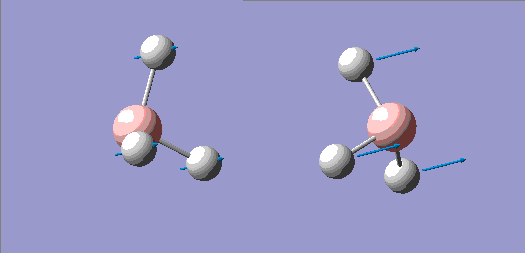 |
1150 | 92.7 | A" |
| 2 | 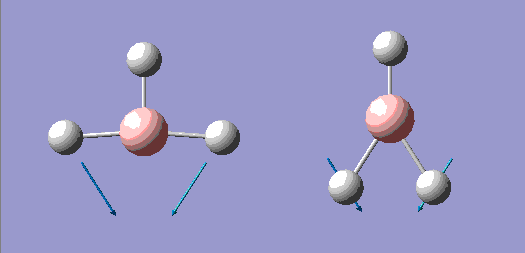 |
1200 | 12.4 | E' |
| 3 |  |
1200 | 12.4 | E' |
| 4 | 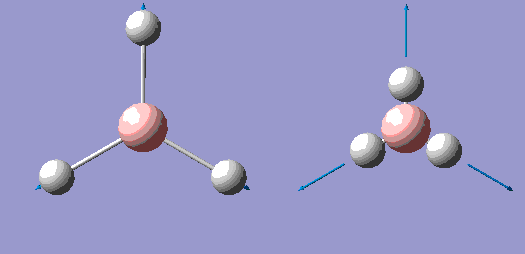 |
2590 | 0 | A' |
| 5 | 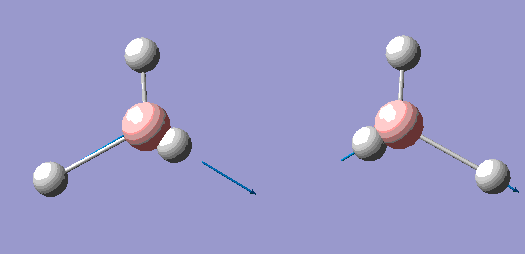 |
2730 | 104 | E' |
| 6 | 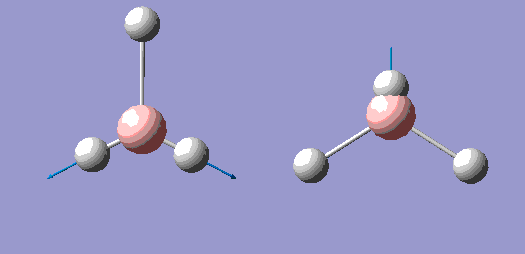 |
2730 | 104 | E' |
The principal axis for the above symmetries is clearly the C3 axis, and so is the z axis for all symmetries.
Below we can see the infrared spectrum generated by Gaussian, and that although 6 vibrations are calculated only 3 are seen. In order for a stretch to be IR active, it must cause a cahnge in dipole moment, and in the case of 4 the stretches are degenerate with each other, causing no net change of dipople and giving it an intensity of zero. Also 2 and 3, and 5 and 6 are degenerate pairs of vibrations, so only one peak is seen for each of the two with an intensity the sum of the two constituents.
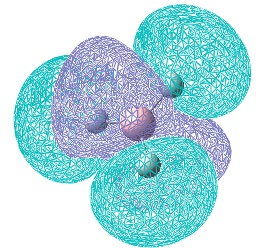
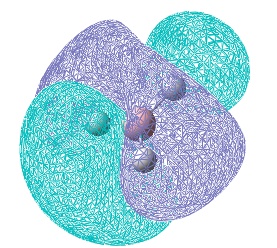
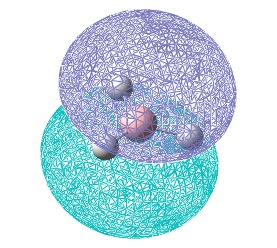
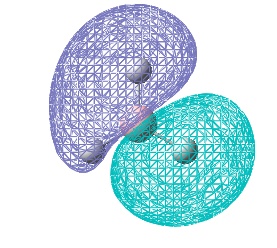
BH3-Molecular Orbitals
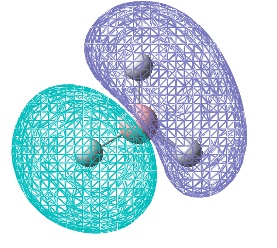
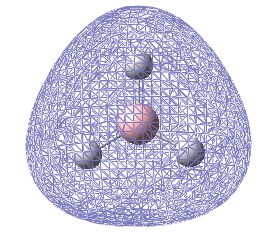
To begin with, a qualitative MO of BH3 was drawn in Chem Draw 11.0 (original .cdx file: https://www.ch.ic.ac.uk/wiki/images/b/b2/HEMAL_BH3_MO.cdx). It should be noted that the C3 rotational axis has been treated as the principal axis for all symmetry operations, that the MOs shown in boxes are the bonding and antibonding MOs of the molecule, and the orbitals shown unboxed are for the B and H3 fragments.
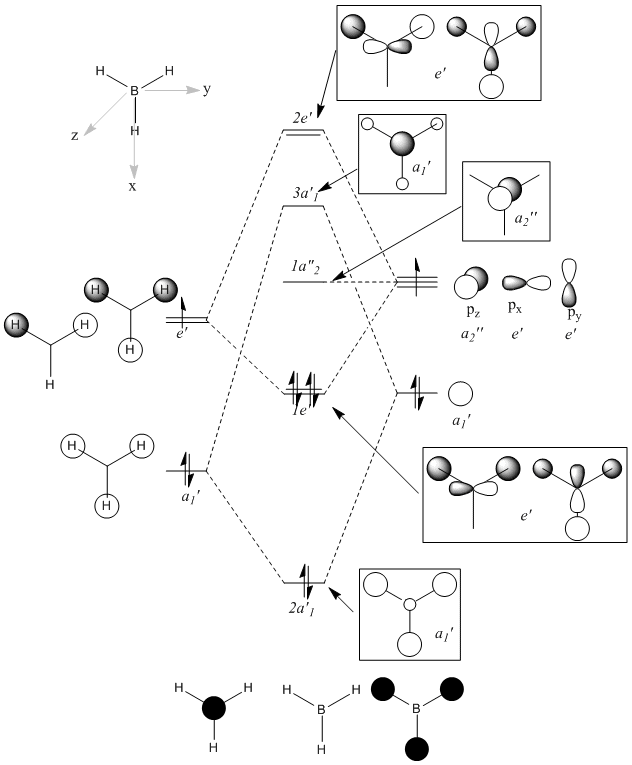
After computing the MOs for BH3 using Gaussian, and the 6-31G basis set and the B3LYP method, a comparison of the qualitative and the quantitative were undertaken:
Mo Complex
Optimisation of Mo Complex Using Low Level Pseudo-Potential
The structures of both the cis and trans isomers of Mo(CO)4(PMe3)2 were optimised using the B3LYP method and two different pseudo-potentials in succession. Firstly the LAN2MB low level pseudo-potential was utilised in conjunction with a loose convergence instruction (opt=loose), to allow the molecule to optimise with wider convergence limits with respect to the first derivative of the energy (see graphs earlier) and to obtain an approximate geometric optimisation:
| Property | Value - Cis | Value - Trans |
|---|---|---|
| optimised Mo-P bond distance/Å | 2.74 and 2.75 | 2.65 and 2.65 |
| optimised Mo-C (trans to P) bond distance/Å | 1.99 and 1.99 | n/a |
| optimised Mo-C (cis to P) bond distance/Å | 2.05 and 2.05 | 2.05, 2.05, 2.05 and 2.05 |
| optimised C-O (trans to P) bond distance/Å | 1.21 and 1.21 | n/a |
| optimised C-O (cis to P) bond distance/Å | 1.20 and 1.20 | 1.20, 1.20, 1.20 and 1.20 |
| file type | .log | .log |
| calculation type | F0PT | FOPT |
| calculation method | RB3LYP | RB3LYP |
| basis set | LANL2MB | LANL2MB |
| final energy/a.u. Or Hartree) | -764.5 | -764.5 |
| gradient/a.u. Or Hartree/Bohr | 0.00003824 | 0.0001064 |
| dipole moment/debye | 7.28 | 0.00 |
| Point group | C1 | C1 |
| Calculation time | 45min 38.7sec | 103.5 |
| Jmol Applet | ||
| Dspace | http://hdl.handle.net/10042/to-1916 | http://hdl.handle.net/10042/to-1917 |
It is pertinenent to note that certain bond lengths would be expected to be the same (i.e. all CO bond lengths in the trans- isomer), but that they are not in the above calculations. Even in some cases where the bond lengths are the same to the gievn leven of accuracy, the summary files show a difference in bond lengths at 4 or 5 dp. It is for these reasons that the point groups of the molecules are C1 (ie very little symmetry).
Optimisation of Mo Complex Using Higher Level Pseudo-Potential
The above are an indication of the need to carry out more accurate calculations, and so the LANL2DZ pseudo-potential was utilised, with an increased electronic convergence (int=ultrafine scf=conver=9):
| Property | Value - Cis | Value - Trans |
|---|---|---|
| optimised Mo-P bond distance/Å | 2.65 and 2.65 | 2.57 and 2.57 |
| optimised Mo-C (trans to P) bond distance/Å | 1.98 and 1.98 | n/a |
| optimised Mo-C (cis to P) bond distance/Å | 2.03 and 2.03 | 2.03, 2.03, 2.03 and 2.03 |
| optimised C-O (trans to P) bond distance/Å | 1.19 and 1.19 | n/a |
| optimised C-O (cis to P) bond distance/Å | 1.19 and 1.19 | 1.19, 1.19, 1.19 and 1.19 |
| file type | .log | .log |
| calculation type | F0PT | FOPT |
| calculation method | RB3LYP | RB3LYP |
| basis set | LANL2DZ | LANL2DZ |
| final energy/a.u. Or Hartree) | -773.4 | -773.4 |
| gradient/a.u. Or Hartree/Bohr | 0.00000653 | 0.00002139 |
| dipole moment/debye | 8.88 | 0.00 |
| Point group | C1 | C1 |
| Calculation time | 4h 29min 39.1sec | 2h 48min 0.3sec |
| Jmol Applet | ||
| Dspace | http://hdl.handle.net/10042/to-1916 | http://hdl.handle.net/10042/to-1917 |
The use of this new method has given ca. 10 hartree unit lower energies of the optimised molecule, and a rms convergence gradient much closer to to zero (ie to more dp per summary) than the previous method, hightlighting the improvement that can be achieved with higher levels of theory.
It should be noted that the point group is once again C1. Specifying the point group of the molecule would likely results in better matching bond lengths, and for the Cis isomer would be and for the trans isomer .
Optimisation of Mo Complex Taking Into Account Phosphorous d-Orbitals
If time had permitted, optimisations would have been run specifying a point group, however it was felt that taking in to account the hypervalency of Phosphorous and its d-orbitals (as specified per lab instructions) would yield more satisfying data. As a result the "extrabasis" parameter was set in the *.gjf input file and the code specifying the d-orbitals to be added to the Phosphorous in the calculation.
| Property | Value - Cis | Value - Trans |
|---|---|---|
| optimised Mo-P bond distance/Å | 2.65 and 2.65 | 2.57 and 2.57 |
| optimised Mo-C (trans to P) bond distance/Å | 1.98 and 1.98 | n/a |
| optimised Mo-C (cis to P) bond distance/Å | 2.03 and 2.03 | 2.03, 2.03, 2.03 and 2.03 |
| optimised C-O (trans to P) bond distance/Å | 1.19 and 1.19 | n/a |
| optimised C-O (cis to P) bond distance/Å | 1.19 and 1.19 | 1.19, 1.19, 1.19 and 1.19 |
| file type | .log | .log |
| calculation type | F0PT | FOPT |
| calculation method | RB3LYP | RB3LYP |
| basis set | LANL2DZ | LANL2DZ |
| final energy/a.u. Or Hartree) | -773.4 | -773.4 |
| gradient/a.u. Or Hartree/Bohr | 0.00000653 | 0.00002139 |
| dipole moment/debye | 8.88 | 0.00 |
| Point group | C1 | C1 |
| Calculation time | 4h 29min 39.1sec | 2h 48min 0.3sec |
| Jmol Applet | ||
| Dspace | http://hdl.handle.net/10042/to-1 | http://hdl.handle.net/10042/to-1 |
Within each isomer the Mo-P bond lengths are the same (to the specified level of accuracy). For the cis isomer the, the carbonyl groups show varying bond lengths depending on their orientation with respect to the PMe3 groups (ie cis or trans). This gives two sets of bond lengths, and from the table it is clear to see that bonds cis to the phosphorous have one set of bond lengths (across both isomers!) and the bonds trans to the phosphorous have different lengths.
CO bond lengths reflect the extent of back bonding, as increased back bonding from the metal centre increases electron density in the CO bond and weakens the CO bond. There is also evidence of structural trans effect whereby a strong trans effect ligand (such as CO) will cause the Metal-Ligand bond trans to it to be stretched. This is seen by the bond length of the of the Cis isomer Mo-P bond (trans to CO) being 2.65Å compared to the 2.57Å of the Trans isomer (Mo-P trans to another Mo-P).
The bond lengths match well to the literature [2] values for trans of 2.50Å Mo-P, 2.02Å Mo-C, 1.16Å for C-O, considering the literature values are for Ligand=PPh3.
For the Cis isomer the lit.[3] values of Mo-P 2.52Å, Mo-C (trans to P) 1.97Å and 1.98Å, Mo-C (cis to P) 2.02Å and 2.04Å, C-O 3x1.14Å and 1.13Å agree very well to the calculations carried out, and do not (in the crystal structure) show perfect symmetry!
Vibration Analysis of the Optimised Mo Complex
The vibrations of the two complexes were computed using the highest level optimisation (above). The spectra generated are shown below:
| Cis Isomer | Trans Isomer |
|---|---|
 |
 |
| DSpace: http://hdl.handle.net/10042/to-2024 | DSpace: http://hdl.handle.net/10042/to-2025 |
and then compared to literature values:
| No. | Frequency/cm-1 (3sf) | Intensity (3sf) |
|---|---|---|
| 78 | 1850 | 1970 |
| 79 | 1850 | 1060 |
| 80 | 1870 | 678 |
| 81 | 1960 | 330 |
| 58 | 1030 | 170 |
| 59 | 1040 | 142 |
This is compared with available lit.[3] CO stretches of Cis-Mo(Co)4(PPh3)2 of 1899cm-1, 1905 cm-1, 1922cm-1, 2019cm-1, and shows a reasonable match.
| No. | Frequency/cm-1 (3sf) | Intensity (3sf) |
|---|---|---|
| 79 | 1840 | 2010 |
| 78 | 1840 | 2000 |
| 58 | 1030 | 390 |
| 41 | 660 | 130 |
| 92 | 3140 | 120 |
| 86 | 3040 | 90 |
This is compared with available CO lit.[2] for the complex 1895cm-1 cf. 1840cm-1 for the calcultion.
In all cases, the bond length of co-ordinated CO is greater than for free CO due to the degree of bonding donation from CO to the Mo, and then back bonding weakening the bond from MO to CO.
Ammonia
Symmetry
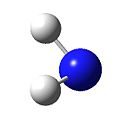
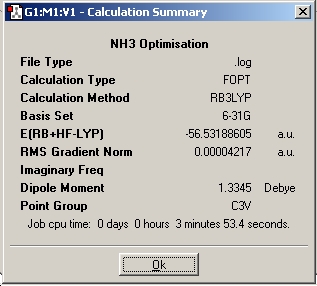
By making small modifications to the molecule, the aim is to show the effect of symmetry on various properties of the ammonia molecule. An NH3 was generated using gaussview and optimised using the B3LYP method and the 6-31G basis set and its symmetry observed. A snapshot of the results summary has been included below.(DSpace: http://hdl.handle.net/10042/to-1991)
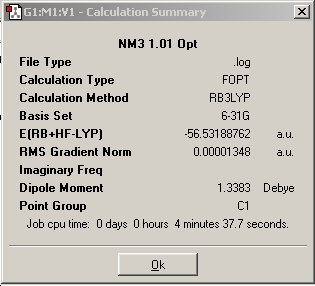
For comparitive purposes, one of the bond lengths was increased in the molecule prior to optimisation to 1.01Å and the ignore symmetry setting enabled and the optimisation run with the same method and basis set. (DSpace: http://hdl.handle.net/10042/to-1835)
Finally, a given optimisation file received from Dr. P. Hunt (extension changed from *.txt to *.gjf), with an inset dummy atom to restrict the symmetry to D3h was optimised (DSpace: http://hdl.handle.net/10042/to-1992).
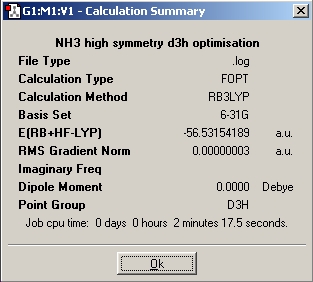
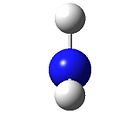
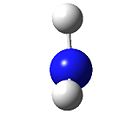
With respect to the structure, the first two optimisations have adopted a trigonal pyrimidal structure with a C3v symmetry for the first calculation and C1 symmetry for the second calculation (where the bond length was changed to 1.01Å). The structure supplied with a dummy atom however gives a D3h, trigonal planar geometry. These varying levels of symmetry have also influence the calculation time. The more symmetrical the molecule (D3h, C3v, C1 in order of decreasing symmetry) the faster the calculation time. This is explained by Guassian constraining its calculations to a specified geometry, except when specified to ignore said symmetry, allowing for a greater number of permutations, and hence requiring a more CPU time. The higher symmetry molecules also show a higher optimised energy (148423.563232195 kJ/Mol, 148424.466824275 kJ/Mol and 148424.47094631 kJ/Mol respectively NOTE: THESE ARE GIVEN TO AN UNNECESSARILY HIGH LEVEL OF ACCURACY), although the difference between C1 and C3v are very small. The difference between the highest and lowest energy is only equivalent to a paltry amount ca. ~0.9 kJ/mol cf. thermal energy of Boltzmann's consatnt x Temperature x Avogadro's Number of ~2.5kJ/mol. It is my belief therefore that the rapid interconversion of the isomers calculated is possible at room temperature.
Methods
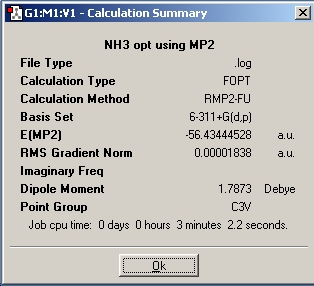
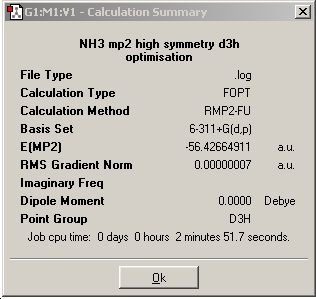
To take the above work forward, a higher level MP2 method was utilised along with the better 6-311G+(d,p) on the NH3 molecule with C3v symmetry (ie no bond lengths changed). The molecule was NOT pre-optimised, this was so the calculation times can be compared. A summary screen snapshot is shown below, and the results discussed comparitively with the above calculations. A file supplied by Dr. P. Hunt was also run, which was for the D3h symmetry, with the same methods.
| C3v | D3h |
|---|---|
 |
|
| DSpace: http://hdl.handle.net/10042/to-2004 | DSpace: http://hdl.handle.net/10042/to-2005 |
The expecation with these MP2/6-311+G(d,p) calculations is that they should take longer than those with the B3LYP/6-31G method, however this is only the case for the D3h symmetry ammonia, but not for the C3v symmetry. Since the values obtained from these methods are more accurate, they shuold give a better indication of the barrie of inversion of the molecule (ie the difference in energy of the two isomers, being ground state and transition state). This difference was 0.007796 Hartree or 20.47 kJ/mol. This value is much larger than the ~0.9kJ/mol calculated by DFT method, and notably much closer to the experimentally determined 24.3 kJ/mol, indicating its greater accuracy. With these calculated values, it is clear that the room temperature iversion of ammonia is not as ridiculously facile as shown with the previous B3LYP/6-31G method, although still possible.
The Inversion Mechanism
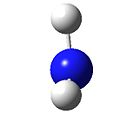
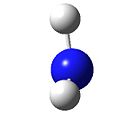
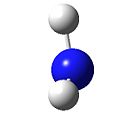
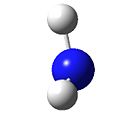
A Scan calculation was carried out by Dr. P. Hunt, and analysed by us. The output shows the half of the inversion of the ammonia molecule from C3v symmetry to the transition state D3h.
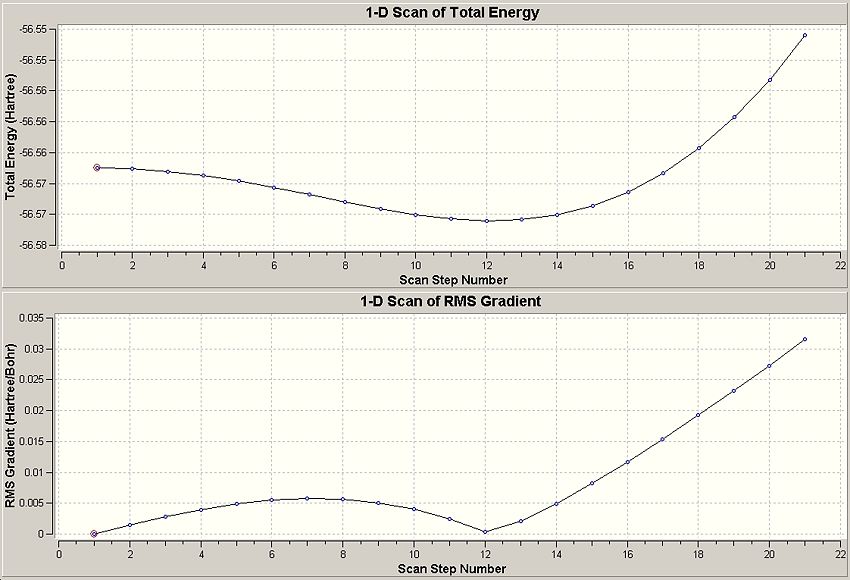
The above shows the umbrella like inversion mechanism of the molecule and implies the quantum tunneling of the electrons through the nitrogen, implying that the electrons play a large role in what was thought to be a mechanical process! This is a berakdown of the Born-Oppenheimer approximation which states:
- Nuclei are large and heavy and can be ignored in electronic processes.
- Electrons are fast an light, and can be ignored in mechanical processes.
Vibrational Analysis
The vibrations of NH3 with C3v and D3h symmetry were calculated in Gaussian using the B3LYP method and basis set 6-31G. The vibrations are very similar to BH3 as shown above. The IR Spectra are diplayed below...
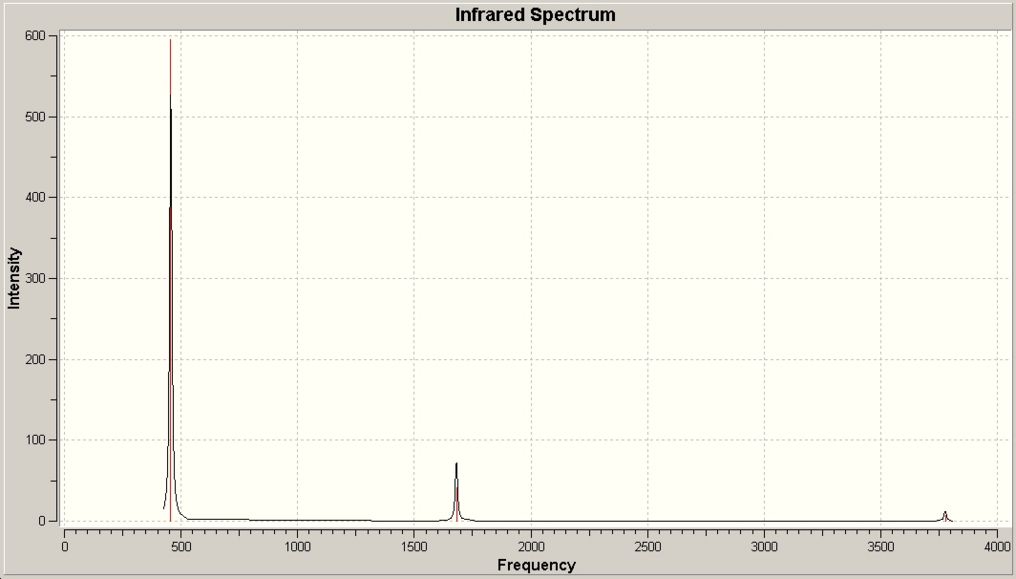
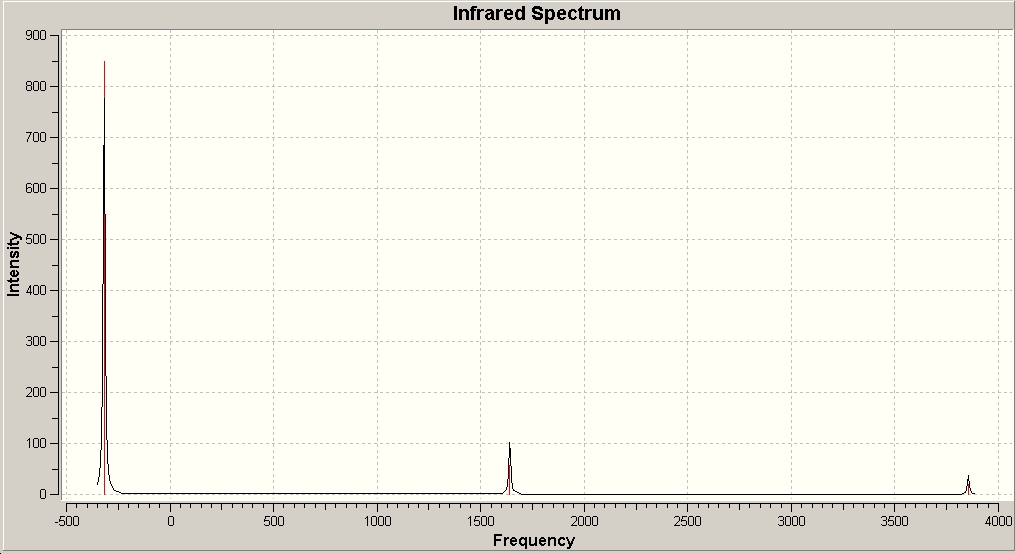
| No. | C3v Frequency/cm-1 (3sf) | Intensity (3sf) | Point group | D3h Frequency/cm-1 (3sf) | Intensity (3sf) | Point group | Lit.[4] Frequency/cm-1 |
|---|---|---|---|---|---|---|---|
| 1 | 460 | 596 | A | -320 | 849 | A" | 950 |
| 2 | 1680 | 41.5 | E | 1640 | 56.0 | E' | 1627 |
| 3 | 1680 | 41.5 | E | 1640 | 56.0 | E' | 1627 |
| 4 | 3580 | 0.0644 | A | 3640 | 0 | A' | 3337 |
| 5 | 3780 | 6.95 | E | 3850 | 19.6 | E' | 3444 |
| 6 | 3780 | 6.95 | E | 3850 | 19.6 | E' | 3444 |
| C3v Frequency/cm-1 (3sf) | Lit.[4] Frequency/cm-1 | Variance |
|---|---|---|
| 460 | 950 | 253 |
| 1680 | 1627 | 1.7 |
| 3580 | 3337 | 17.7 |
| 3780 | 3444 | 32.8 |
| TOTAL | 305 |
The above symmetries have been tabulated and matched for the same character of motions (for the computational case). The values also show a good agreement with the literature, as indicated by variance analysis (with the exception of the first vibration). As variance is an additive property, a total has been shown.
Comparing the two symmetries with each other, and to some extent to BH3 it easy to see the simalirity of the D3h ammonia with BH3 which has the same symmetry. However vibration 4 for the C3v ammonia gives a change in dipole so does have a small intensity absorbance, although it is insignificant compared to the other vibrations and so is difficult to see on the IR spectrum.
The negative frequency for the C3v molecule (which shows it is a transition state structure) was -320 cm-1. It is this negative frequency and the corresponding first frequency in C3v of 460cm-1 that follow the reaction inversion path.
Inorganic Computational Chemistry - Part 2 - Mini Project
Introduction
The complex Pt(L)Cl, (L is 2-phenyl-6-(1H-pyrazol-3-yl)pyridine) is luimiscently active. It has been stated in the lit. (entitled A Bioaccumulative Cyclometalated Platinum(II) Complex with Two-Photon-Induced Emission for Live Cell Imaging[5] that the three major rings in the system act as electron donor moieties, and have relatively low toxicity on live cell (such as the HeLa immortal cancer cells).
Abstract
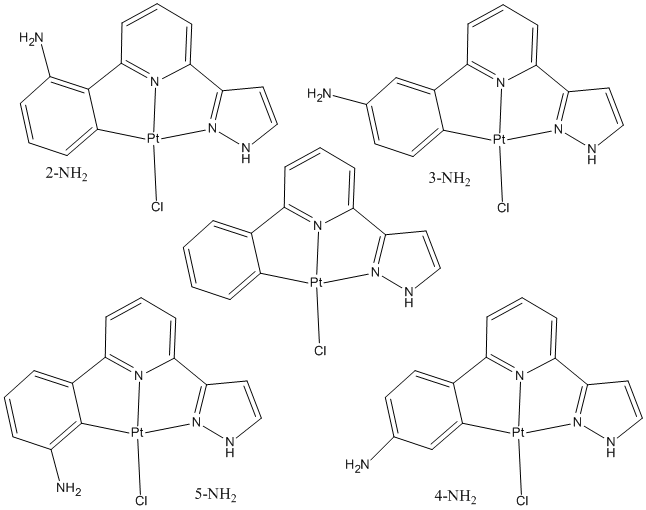
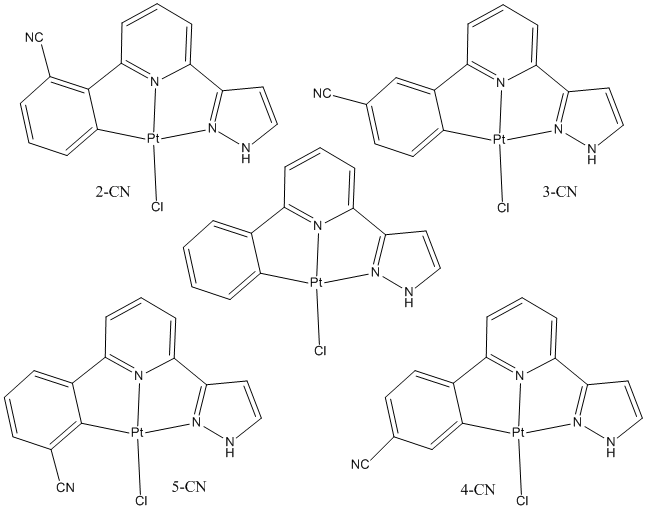
To investigate some of the properties of this complex, the phenyl ring was substited in all 4 positions individually with Cyano group (CN acting as an EWG) and the primary amine group (NH3 acting as an EDG), and the change in the stability of phenyl-Pt bond analysed to see what changes in electron density in phenyl ring of the molecule would contribute to the stabilisation/destabilisation of the bond.
To create a more indepth study would be to look at absorbance and fluorescence emission, but this would require analysis of the excited states, which is beyond the ability of myself and scope of this course.
Results
Beginning with the *.cif crystal structure file in the supplementary information of the second piece of literature[6] which was loaded in to ChemBio3D first (to enable facile selection of a single molecule, rather than an entire primitive cell!) and the structure copied across to Gaussview.
The optimised structure of the literature molecule was calculated using B3LYP/LanL2DZ with ultrafine convergence, and then the same was applied to the 8 substitutetd molecules shown below:
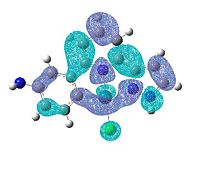
The MOss and IRs of the molecules are tabulated below. The reason for the calculation of the IRs is that the decreased/increased electron density will change the stretches due to changing bond strengths depending on the substituting group and its position:
| 2-NH2 | 3-NH2 | 4-NH2 | 5-NH2 | |
|---|---|---|---|---|
| LUMO |  |
 |
 |

|
| HOMO |  |
 |
 |

|
| Pt-Phenyl Bond Lengths/Å | 2.00 | 2.00 | 2.00 | 2.03 |
| Jmol Applet | ||||
| Dspace | input: https://www.ch.ic.ac.uk/wiki/images/d/de/Hemal_Pt_comp_opt_2_NH2.gjf and output:https://www.ch.ic.ac.uk/wiki/index.php/Image:Hemal_Pt_comp_opt_2_NH2.out |
http://hdl.handle.net/10042/to-2027 | http://hdl.handle.net/10042/to-2028 | http://hdl.handle.net/10042/to-2029 |
| IR Spectra |  |
 |
 |

|
| DSpace | http://hdl.handle.net/10042/to-2035 | http://hdl.handle.net/10042/to-2036 | http://hdl.handle.net/10042/to-2038 | http://hdl.handle.net/10042/to-2039 |
| 2-NH2 | 3-NH2 | 4-NH2 | 5-NH2 | |
|---|---|---|---|---|
| LUMO |  |
 |
 |

|
| HOMO |  |
 |
 |

|
| Pt-Phenyl Bond Lengths/Å | 2.00 | 2.00 | 2.00 | 2.02 |
| Jmol Applet | ||||
| Dspace | http://hdl.handle.net/10042/to-2030 | http://hdl.handle.net/10042/to-2031 | http://hdl.handle.net/10042/to-2032 | http://hdl.handle.net/10042/to-2033 |
| IR Spectra |  |
 |
 |

|
| DSpace | http://hdl.handle.net/10042/to-2042 | http://hdl.handle.net/10042/to-2037 | http://hdl.handle.net/10042/to-2041 | http://hdl.handle.net/10042/to-2040 |
For the unsubstituted complex the Pt-Phenyl bond length was 2.00Å per the calculations and the literature crystal structure (*.cif file), and so we can see that the bond is weakened in the case of substitution at the 5 position with both EDGs and EWGs. This is explained by the following resonance diagrams below:

As we can see in the case of the EDG NH2 an increase in charge density at the positions ortho to it occur, and at any point it can be said that there is increased electron density in the antibonding orbitals, weakening the bond,.
However in the case of the EWG CN a decrease in charge density at the positions ortho, and at any point it can be said that there is decreased electron density in the bond, weakening the bond. This also promotes a higher degree of back-bonding in the synergic bonding regime of the Pt complex from the Pt to the phenyl ring.
Further explanation can be achieved by looking at the shape of the HOMO MOs, especially in the case of the NH2 substitution. Substitution at the 2,3 and 4 positions show no significant change in the shape and spread of the orbitals across the molecule, however at the 5 position, we see a drastic change including reduction of the constructively combined Pt orbitals (and an increase in nodes around it) and the orbitals in the pyrazolyl region. This shows the decreased tendency to back bonding, and the increase in antibonding in that Cphenyl-Pt-Cpyrazolyl region. This accounts for the decrease in bond length.
The MOs for the -CN substituted ring show less of the drastic change in 5 substitution with the exception that a large amount of negative chargeon the -CN substituent, stabilised on the nitrogen, is seen as its position ortho to the Pt is conducive to this.
References
- ↑ B. P. Stoicheff, Can. J. Phys. 218-230 (1958)DOI:10.1139/CJP-36-2-218
- ↑ 2.0 2.1 G. Hogarth. T. Norman ,Inorganica Chimica Acta, 254, (1997), 167-171 DOI:10.1016/S0020-1693(96)05133-X
- ↑ 3.0 3.1 F. Albert. Cotton, Donald J. Darensbourg, S. Klein, Brian W. S. Kolthammer Inorg. Chem., (1982), 21 (7), pp 2661–2666 DOI:10.1021/ic00137a026
- ↑ 4.0 4.1 Y. Yamaguchi, M. Frisch, J. Gaw, H. F. Schaeffer and J. S. Brinkley, J. Chem. Phys. 84, 2262 (1986)DOI:10.1063/1.450389
- ↑ M.Hon-Wah Lam et. al. Inorganic Chemistry 2009, 48, (3), 872-878 DOI:10.1021/ic801261h
- ↑ Chi-Kin Koo,, Yu-Man Ho,, Cheuk-Fai Chow,, Michael Hon-Wah Lam,,, Tai-Chu Lau, and, Wai-Yeung Wong Inorganic Chemistry 2007 46 (9), 3603-361

