Rep:Mod:ma
Computational lab Module 3
In this lab, Cope rearrangement and Diels Alder cycloaddition reactions were investigated and their transition state structures were characterised on potential energy surfaces.
Molecular mechanics do not work for the large molecules involved in this experiment since this method does not describe the bond breakage and formation. Therefore, molecular orbital- based methods are used to solve the Schrodinger equation, locate the transition state, and calculate the reaction paths and activation energies.
Cope Rearrangement
Cope rearrangement is a [3,3]-sigmatropic shift which involves formation of either "chair" or "boat" transition structures formed in a concerted manner.

The aim of this part is to locate the energy minima and transition structures on the C6H10 potential energy surface, thereby deciding which reaction mechanism is preferred.
Optimising Reactants and Products
Part a
An anti conformation of 1,5-hexadiene was optimised using the method Hartree Fock and 3-21G basis set.
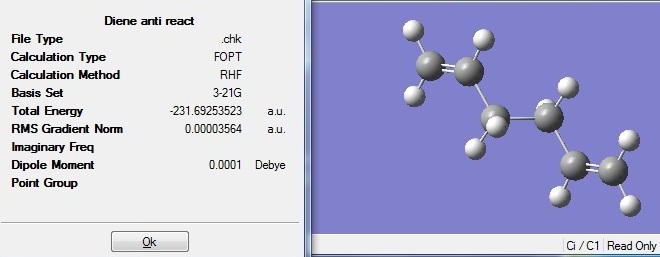
The optimised structure has energy of -231.69254a.u. and a Ci point group. These match the description for anti 2 conformer in Appendix 1.
D-space: DOI:10042/to-6251
Part b
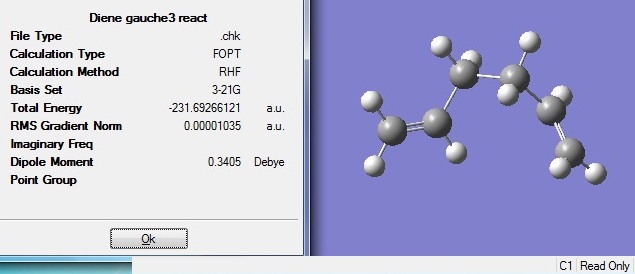
A gauche conformation was optimised as above and the resulting structure has an energy of -231.69266a.u. and a C2 point group. This is identified to be the gauche 3 conformer.
D-space: DOI:10042/to-6253
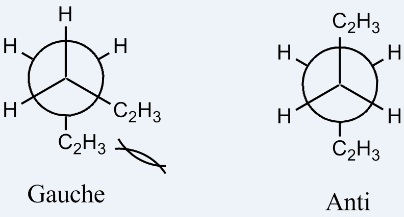
From sterics point of view, the conformer with least steric hindrance would be a more stable, lower energy one. Therefore, one would expect anti 2 conformer to be more stable than gauche 3. In anti 2 conformation, the bulky C2H3 groups are anti to one another thereby minimises the steric clash between the groups; whereas in gauche 3 conformation, the bulky groups are closely clashed. (see figure 4)
However, from the computed calculations, the opposite is shown to be true, i.e. gauche 3 is about 0.26kJmol-1 lower in energy and is therefore more stable compared to anti 2. This arises from stereoelectronic effect, where the antiperiplanar interaction between π(C=C) and σ*(C-H) results in extra stabilisation for gauche conformation due to donation of electron density from π to σ*, hence lowering the overall energy of the molecule.
Part c and d
The anti and gauche conformers were edited with the bond and dihedral angles altered in gaussview03 in order to get to the structures listed in Appendix 1 so comparison can be made on their energies.
| Conformer | Optimised structure | Energy / a.u. | Relative energy | Point Group | D-space |
|---|---|---|---|---|---|
| gauche 3 | 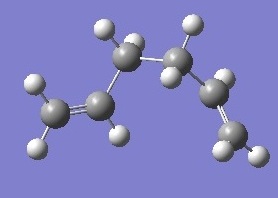 |
-231.692661 | 0 | C1 | DOI:10042/to-6253 |
| gauche 4 | 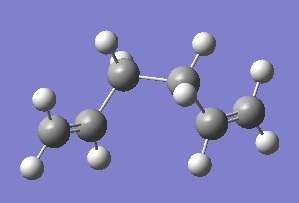 |
-231.691530 | +0.001131 | C2 | DOI:10042/to-6254 |
| gauche 6 | 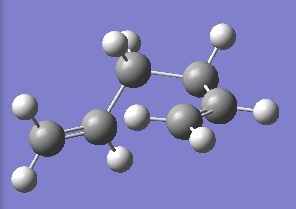 |
-231.689160 | +0.003501 | C1 | DOI:10042/to-6256 |
| anti 2 | 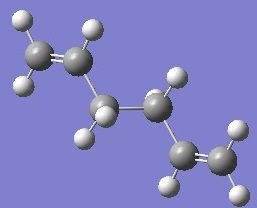 |
-231.692535 | +0.000126 | Ci | DOI:10042/to-6251 |
| anti 3 | 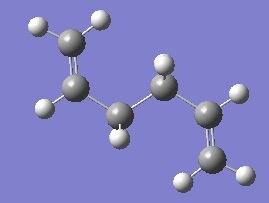 |
-231.689071 | +0.003590 | C2h | DOI:10042/to-6252 |
| anti 4 | 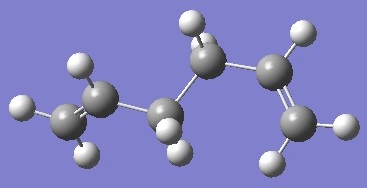 |
-231.690971 | +0.001690 | C1 | DOI:10042/to-6257 |
The lowest energy conformer was used as reference, i.e. gauche 3. The relative energies of the other conformers compared to gauche 3 were calculated.
Even though stereoelectronic effect gives rise to stabilisation in gauche 3 conformation, this does not mean all the gauche conformations would be more stabilised compared to anti.
Gauche 4 and 6 conformers were found to have higher energy and are less stable than gauche 3 due to fewer antiperiplanar interactions.
Anti 2 conformer has a lower energy compared to gauche 4 and 6. This shows that in addition to stereoelectronics, steric hindrance also plays a role in determining which is the more stable conformer.
Part e
The anti 2 conformer was optimised (see above) and the energy computed was -231.692535a.u. with point group of Ci, which match well with the data given in Appendix 1.
Part f - Second optimisation of anti-2-1,5-hexadiene using DFT/B3LYP/6-31G(d)
Since the computed anti 2 result matches well with the data given, the optimised structure must be the same as the one given. This structure was then reoptimised further using DFT/B3LYP/6-31G(d), which are of higher accuracy compared to HF/3-21G.
The final structures from the HF/3-21G and B3LYP/6-31G(d) calculations are compared in the following table.
| HF/3-21G | B3LYP/6-31G(d) | |
|---|---|---|
| C-C bond length/A | 1.51 | 1.50 |
| C=C bond length/A | 1.32 | 1.33 |
| C1,2,3,4 Dihedral angle/o | 114.7 | 118.6 |
| C2,3,4,5 Dihedral angle/o | 180 | 180 |
| C3,4,5,6 Dihedral angle/o | 114.7 | 118.6 |
The overall geometry did not change much. With a higher level basis set the dihedral angle widened by 4o. However, the resulting energy was -234.61171a.u., which is about 3a.u. more stabilised in energy compared to the optimisation carried out using HF/3-21G. The 6-31G(d) basis set led to even lower energy which is closer to the minimum.
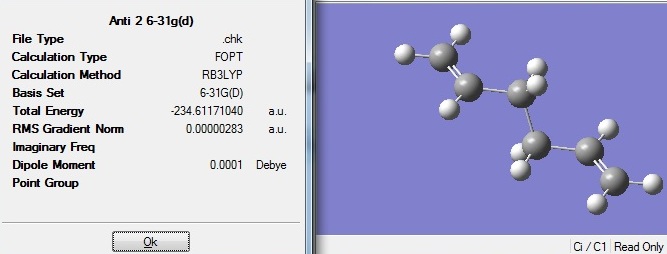
D-space:DOI:10042/to-6258
Part g
A frequency analysis was carried out after optimisation of anti 2 1,5-hexadiene using DFT/B3LYP/6-31G(d). All vibrational frequencies are positive with no imaginary frequencies which indicates that minimum point was found and the optimisation to minimum carried out in the previous part was successful.
| Terms | Energies |
|---|---|
| Sum of electronic and zero-point Energies/a.u. | -234.469221 |
| Sum of electronic and thermal Energies/a.u. | -234.461871 |
| Sum of electronic and thermal Enthalpies/a.u. | -234.460927 |
| Sum of electronic and thermal Free Energies/a.u. | -234.500807 |
| Final energy/a.u. | -234.61171 |
Optimising the "Chair" and "Boat" transition structures
The Cope rearrangement can occur via “chair” or “boat” transition structures, which will be investigated in the following parts.
Part a
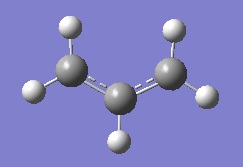
A CH2CHCH2 fragment was optimised using Hartree Fock method and 3-21G basis set in Gaussview03.
Part b
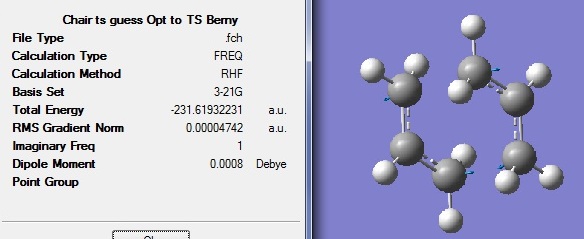
The optimised alkyl fragment was appended twice onto a new MolGroup. One of the fragment was rotated to create a C2h guessed chair transition state (TS) structure. Frequency analysis and optimisation to TS Berny was carried out with force constant calculated once.
From the frequency analysis, it can be seen that there is only one imaginary vibration with frequency of -817.93cm-1. This indicates that this is a transition state on the potential energy surface and corresponds to the bond breakage and formation during rearrangement.
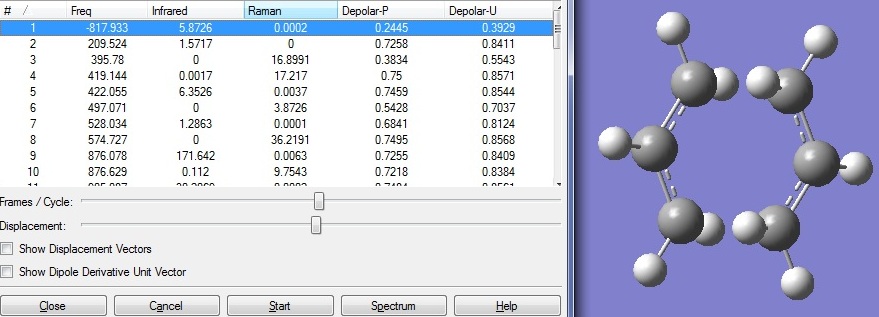
D-space: DOI:10042/to-6259
Part c
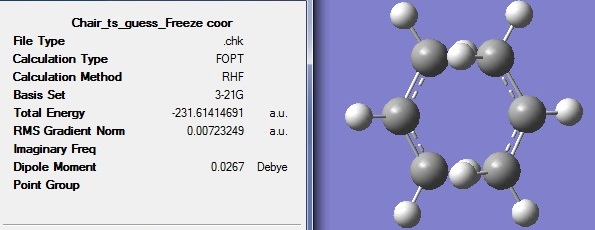
Frozen coordinate method (Opt=ModRedundant) was used to optimise the transition structure again. The bond forming or breaking distances were fixed to 2.2Å and the frequency analysis was also carried out. The only one imaginary vibration is at frequency of -818cm-1.
Part d
The optimised frozen chair TS structure was unfrozen in this part.
Higher accuracy and better optimisation was achieved with frozen coordinate method, since the resulting energy is slightly lower than the normal optimisation.

Comparing this optimised structure with the one in part b, the bond forming and breaking bond lengths are 2.02Å for both cases. The frozen coordinate method led to a slightly more stable structure with lower energy. Both TS Berny and frozen coordinate methods are valid for transition state optimisation.
D-space:DOI:10042/to-6260
Part e
QST2 method was used to optimise the boat transition structure. Optimised anti 2 1,5-hexadiene was used as both reactant and product, but the atom labels for the product were altered according to how it would appear after the rearrangement compared to the reactant. The transition structure can be found using this method.
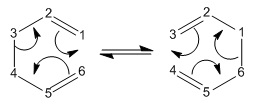
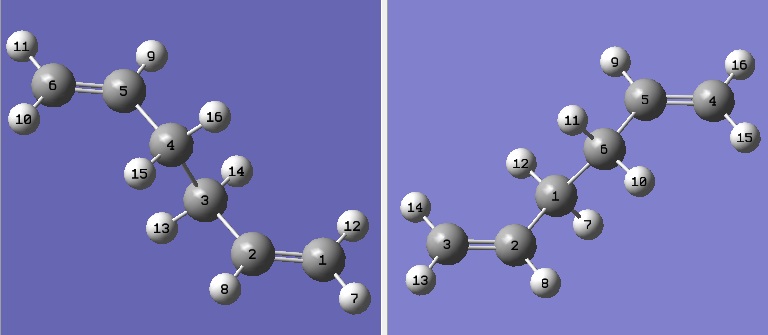
The opt+freq job carried out using QTS2 was not successful at first. The geometry in reactant is very different from that in product and the possible rotations around the central bonds were not considered during the optimisation.
D-space:DOI:10042/to-6262
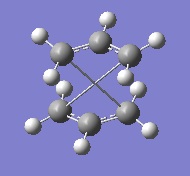
The geometries of reactant and product were therefore altered in order to get a closer match to the boat transition structure. The central C2-C3-C4-C5 dihedral angle was set to 0o; in addition C2-C3-C4 and C3-C4-C5 angles were set to 100o for both reactants and products.
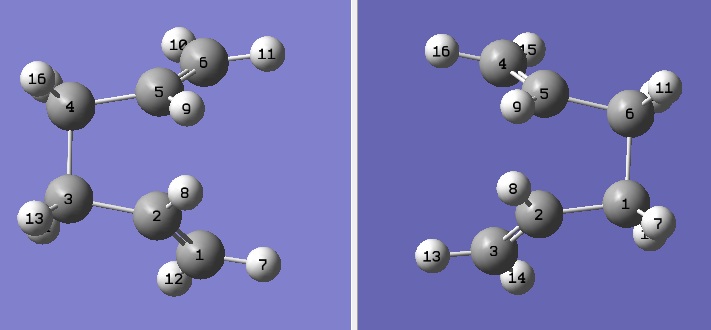

D-space:DOI:10042/to-6263
From figure 15, it can be seen that only one imaginary frequency at -840cm-1 was observed, indicating the presence of transition structure.
Part f
Intrinsic Reaction Coordinate method (IRC) was used in this part to determine the geometry of the final product by following the minimum energy path from a transition structure down to the minimum point on a potential energy surface.
Since the reaction coordinate is symmetrical, only the forward direction was computed and the force constants was calculated only once. The number of points along the IRC was set to 50 to make sure the minimum point can be reached.
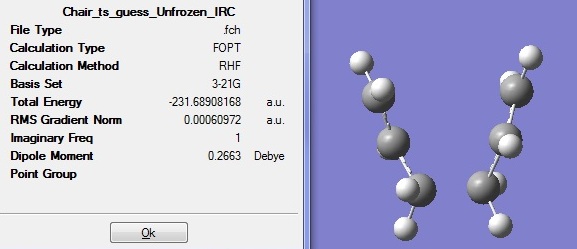
The optimised structure has an energy of -231.6891a.u. meaning that it has not reached the minimum point yet. Therefore, IRC was carried out again and this time the force constants were computed at every step instead of just once. The results are shown in the following figure.
D-space:DOI:10042/to-6264

From figure 17, one can see that the energy of the optimised structure has been lowered further to -231.6916a.u. and now matches the value for gauche 2 given in Appendix 1.
D-space:DOI:10042/to-6265

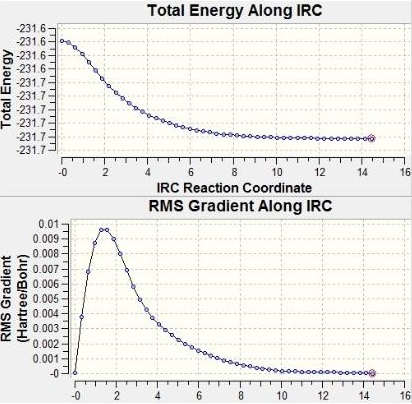
From the total energy and RMS gradient along IRC graphs, it can be seen that the minimum point was not reached after the first IRC. After the second IRC with force constants computed at every step, the RMS gradient graph flattens to nearly zero meaning successful minimisation of energy; and the total energy flattens to a constant minimum value.
Part g
In this part, the chair and boat transition states were reoptimised using B3LYP/6-31G(d)and frequency analysis was carried out to calculate the activation energies of the reaction via both transition structures at 0K and 298.15K.
The following table shows the results obtain from the log files.
| HF/3-21G | B3LYP/6-31G(d) | |||||
|---|---|---|---|---|---|---|
| Electronic energy / a.u. | Sum of Electronic and zero point energies at 0K / a.u. | Sum of Electronic and thermal enthalpies at 298.15K / a.u. | Electronic energy / a.u. | Sum of Electronic and zero point energies at 0K / a.u. | Sum of Electronic and thermal energies at 298.15K / a.u. | |
| Chair Transition State | -231.61932 | -231.46622 | -231.46134 | -234.55698 | -234.41449 | -234.40901 |
| Boat Transition State | -231.60280 | -231.45046 | -231.44530 | -234.54309 | -234.40190 | -234.39601 |
| Anti 2 | -231.692534 | -231.53907 | -231.53257 | -234.61171 | -234.46922 | -234.46187 |
It can be seen that B3LYP/6-31G(d) gives lower energy closer to the minimum point compared to 3-21G since it is of higher level. Activation energies can be obtained from the above table using the equation: Sum of electronic and zero point energies(TS) - Sum of electronic and zero point energies(reactant)
The calculated results are shown below.
| HF/3-21G | B3LYP/6-31G(d) | Experimental Data | |||
|---|---|---|---|---|---|
| 0K | 298.15K | 0K | 298.15K | 0K | |
| ΔE Chair/a.u. | 0.07285 | 0.07123 | 0.05473 | 0.05286 | |
| ΔE Chair/kcalmol-1 | 45.71 | 44.70 | 34.34 | 33.17 | 33.5 +/- 0.05 |
| ΔE Boat/a.u. | 0.08861 | 0.08727 | 0.06732 | 0.06586 | |
| ΔE Boat/kcalmol-1 | 55.60 | 54.76 | 42.24 | 41.33 | 44.7 +/- 2.0 |
The calculated activation energies using B3LYP/6-31G(d) are in good match with literature values given at 0K.
It can be seen that the activation energy for forming the chair transition structure is lower than that for the boat transition structure. As a result, the reaction is favourable to occur via the chair transition structure.
Diels Alder cycloaddition
Cis-butadiene and ethylene undergo Diels Alder cycloaddition with 6π electrons via the following mechanism.
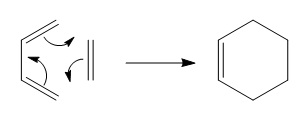
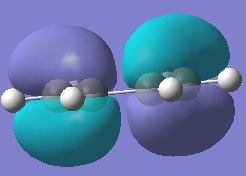
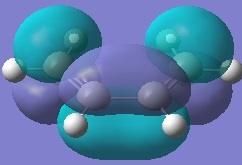
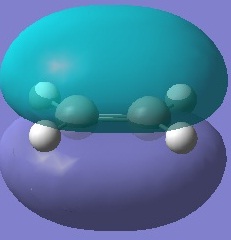
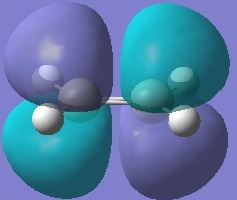
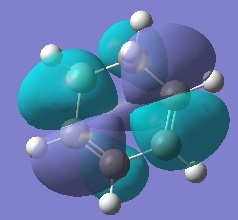
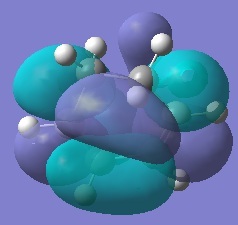
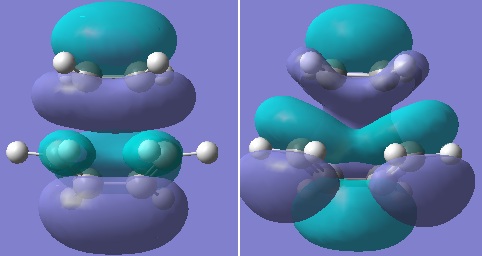
Firstly, ethylene and butadiene were drawn in Gaussview03 and were optimised using semi-empirical AM1 basis set. Their molecular orbitals were computed and are shown below.
If the phases remain the same when the orbitals reflected in the plane of symmetry, it is symmetric. And if the phases invert when the orbitals are reflected in the plane of symmetry, it is anti-symmetric.
From the computed MOs, it can be seen that the HOMO of butadiene and LUMO of ethylene are both anti-symmetric; whereas the HOMO of ethylene and LUMO of butadiene are both symmetric. The orbitals can only overlap if they have same symmetry. Therefore, HOMO of butadiene can overlap with LUMO of ethylene; and same for the other pair.
part ii
HF/3-21G method and TS Berny was used to compute and locate the transition structure using starting geometry as shown in Figure 21, so as to maximise the π-π interaction between butadiene and ethylene.

The interfragment distance was set to 2.2Å which is longer than the usual C-C bond due to the transition state nature. The optimisation result is shown below.
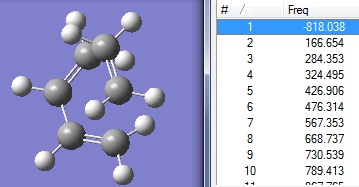
D-space:DOI:10042/to-6268
Frequency analysis was carried out in order to show that it is indeed a transition structure. The presence of an imaginary frequency at -818.04cm-1 proves that point.
The bond lengths of transition structure are tabulated below. (C1 to C4 are the carbons on butadiene; C5 and C6 are the carbons on ethylene)
| Bond | Bond length / Å |
|---|---|
| C1=C2 | 1.37 |
| C2-C3 | 1.39 |
| C3=C4 | 1.37 |
| C5-C6 Ethene bond | 1.38 |
| C5-C1 Bond forming | 2.21 |
| C6-C4 Bond forming | 2.21 |
From literature, C-C single bond length is 1.53 Å, and the C=C bond length is 1.48 Å[1]. The computed results show significantly longer bonds which were being formed in the transition structure since the bonds were not fully formed yet.
part iii Regioselectivity in the reaction of Cyclohexa-1,3-diene with Maleic Anhydride
Cyclohexa-1,3-diene reacts with maleic anhydride to give two possible products, endo or exo, depending on the reaction conditions. The reaction is under kinetic control and the exo transition state should be higher in energy.
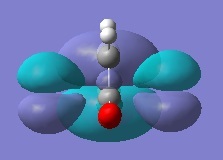
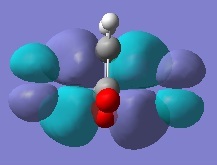
Cyclohexa-1,3-diene and maleic anhydride were optimised separately using HF/3-21G and their molecular orbitals were computed and are shown below.
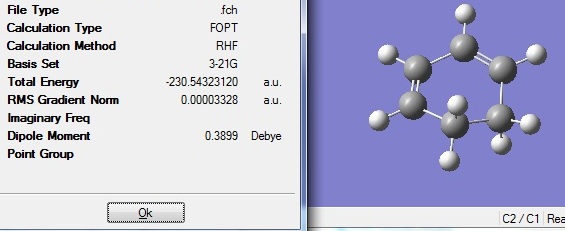
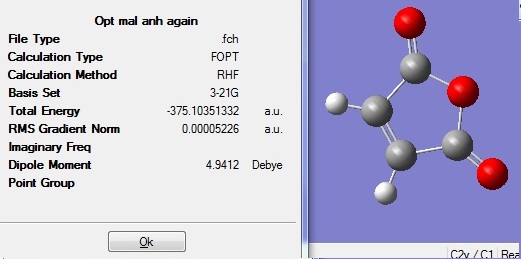
The optimised fragments were then combined with their positions adjusted according to either exo and endo conformation in order to get the guess transition structure. These were then reoptimised using TS Berny to get the final transition structures. The tables below show the summary for both optimisations.
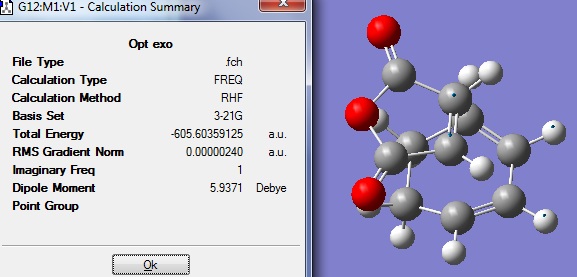

Exo D-space:DOI:10042/to-6270
Endo D-space:DOI:10042/to-6269
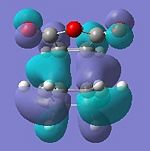
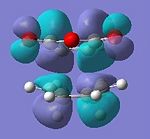
Again, frequency analysis was carried out to confirm that the structures found were indeed transition states. In both cases there was only one imaginary vibration. The imaginary vibration for exo TS was at -647.46cm-1 and -643.11cm-1 for endo TS.
It can be seen that the exo transition structure has higher energy (about 0.007a.u.~18kJmol-1) compared to the endo one, which is within expection. Under kinetic control, the lower energy more stable endo transition state would be formed first and therefore would become major product.
| Exo TS | Endo TS | ||
|---|---|---|---|
| HOMO | LUMO | HOMO | LUMO |
|
|
|
|
| Anti-symmetric | Anti-symmetric | Anti-symmetric | Anti-symmetric |
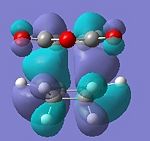
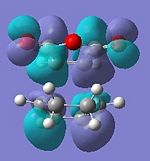
All the transition structures' HOMOs and LUMOs are anti-symmetric. To get this combination, the HOMO and LUMO of cyclohexadiene and maleic anhydride must be anti-symmetric in symmetry, i.e. HOMO of Cyclohexa-1,3-diene and LUMO of maleic anhydride.
The geometries outcome of exo and endo TS are shown below.
| Length/Distance | Exo / Angstroms | Endo / Angstroms |
|---|---|---|
| New C-C sigma bonds | 2.26 | 2.23 |
| Distance between C=O group and opposite C on diene | 2.92 | 2.85 |
| Distance between the anhydride C=C and the diene C=C | 2.73 | 2.23 |
| Distance between the two C=O groups | 2.29 | 2.29 |
From the lengths and distances tabulated above, it can be seen that the exo transition structure experiences less steric hindrance due to further distance between the two fragments compared to the endo case. Because of that, one would expect the exo transition structure to have lower energy compared to endo. However, the secondary orbital overlap effect present only in the endo TS shows significant contribution to stabilisation of the endo TS.
The Secondary Orbital overlap effect[2] is shown in the figure below.
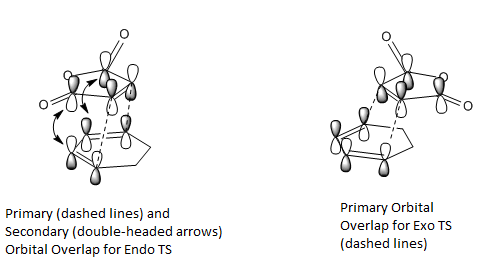
This effect only occurs for the endo transition structure and the p-orbitals overlap accounts for the extra stabilisation energy gained for the system, thereby lowering the overall energy of the transition structure. Exo transition structure does not exhibit this effect and since the secondary orbital overlap effect exceeds the destabilising steric hindrance for the endo TS, as a result the energy of exo transition structure is higher than that of the endo transition structure.
Conclusion
By computing transition structures, their geometries and MOs can be visualised and their reaction pathways and activation energies can be calculated. These allow one to understand why reactions have preferred pathways.
Reference
- ↑ F.H. Allen, O. Kennard, D.G. Watson, L. Brammer, A.G. Orphen, R. Taylor, J. Chem. Soc., Perkin Trans. 2, 1987, S1-S19 DOI:10.1039/P298700000S
- ↑ A. G. Shultz, L. Flood and J. P. Springer, J. Org. Chemistry, 1986, 51, 838.DOI:10.1021/jo00356a016

