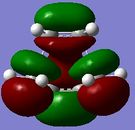
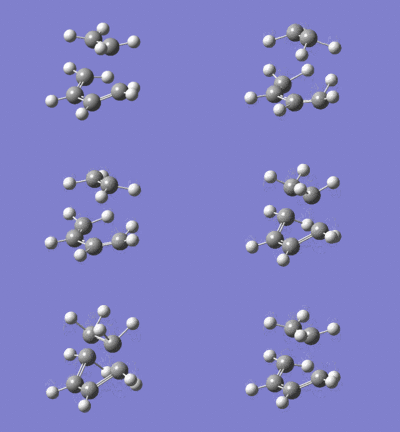
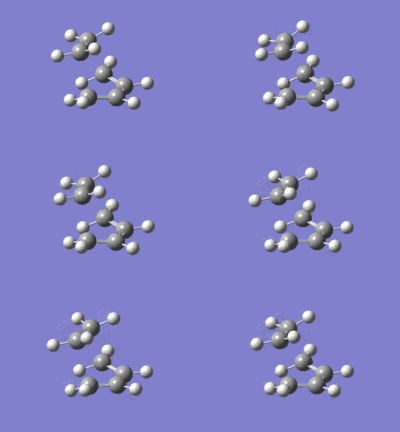
Rep:Mod:mAmY3cP3
The Cope Rearrangement


The Cope Rearrangement of of 1,5-hexadiene is a pericyclic reaction that involves a [3,3]-sigmatropic rearrangement. Figure 1 displays this rearrangement. Various computational techniques are used to investigate the lowest energy conformer of 1,5-hexadiene. The lower the energy of a structure, the more stable it is and the compound will prefer to adopt this structure. Additionally, the optimised transition state structure is explored to determine the most probable mechanism that this rearrangement undergoes. There has been much discussion regarding what the structure of the lowest energy transitions structure is. However, it is now generally accepted that the lowest energy transition structure has either a chair or boat like structure and that the reaction occurs in a concerted manner. [1] The suggested chair and boat like TS structures for this rearrangement are depicted in Figure 2. Additionally, the activation energy for the rearrangement will be investigated to determine the most probably reaction pathway that this rearrangement follows.
Optimizing the Anti Structures
Four separate conformers of 1,5-hexadiene were drawn in Gaussview, all with an "anti" linkage. These molecules were optimised using Gaussian with the Hartree - Fock method and 3-21G basis set. The results of these optimisations are summarised in table 1.
| Anti 1 | Anti 2 | Anti 3 | Anti 4 | |
|---|---|---|---|---|
| Conformer | 
|

|

|

|
| File Type | .log | .log | .log | .log |
| Calculation Type | FOPT | FOPT | FOPT | FOPT |
| Calculation Method | RHF | RHF | RHF | RHF |
| Basis Set | 3-21G | 3-21G | 3-21G | 3-21G |
| Final Energy E(RB3LYP) | -231.69260229 a.u. | -231.69253528 a.u. | -231.68907059 a.u. | -231.69097056 a.u. |
| RMS Gradient Norm | 0.00003703 a.u. | 0.00001891 a.u. | 0.00001865 a.u. | 0.00000517 a.u. |
| Dipole Moment | 0.2 Debye | 0.0 Debye | 0.0 Debye | 0.3 Debye |
| Point Group | C2 | Ci | C2h | C1 |
| Job cpu time | 27.0 seconds | 25.0 seconds | 20.0 seconds | 43.0 seconds |
| Output log file | App 1 3-21G log file. | App 2 3-21G log file. | App 3 3-21G log file. | App 4 3-21G log file. |
| Table 1. 3-21G Gaussian Calculation Summary | ||||
Since the same method, basis set and molecule was optimised (only the conformation of the compounds are different), the energy from these calculations can be compared. All the four isomers have an anti-periplanar conformation around their central C-C bond. Anti 1 has both terminal -CH2 groups pointing in the same horizontal direction while Anti 2 has its terminal -CH2 groups pointing in opposite horizontal directions. Anti 3 has its terminal groups facing up and down and anti 4 has one terminal group pointing in a vertical direction and the other terminal group pointing in a horizontal direction. From the four anti conformers displayed, anti 1 has the lowest energy and is therefore the most stable anti conformation. On many occasions, the anti-periplanar conformation is lower in energy than the gauche conformer due to less steric hindrance experienced and so it is hypothesised that similarly with 1,5-hexadiene, the anti-periplanar conformers will be lower in energy than the gauche conformers. The gauche conformers are computed in the next section to determine if this is the case. The point groups of these molecule are also displayed in table 1. The four anti conformers were compared with the anti conformers that are listed in Appendix 1 and it is found that all four have the same energy and point groups as those listed there. Anti 2 has an energy of -231.69253528 hartree and anti2 (Appendix 1) has an energy recorded as -231.69254 hartree and so it is expected to both have the same structure.
Optimizing the Gauche Structures
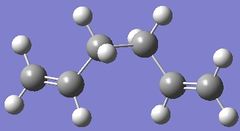
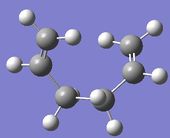
This time, four 1,5-hexadiene molecules were drawn, each with a gauche conformation around their central C-C bond and optimised with the same method and basis set (HF/3-21G) as above. The results are displayed in table 2.
| Gauche 3 | Gauche 4 | Gauche 5 | Gauche | |
|---|---|---|---|---|
| Conformer | 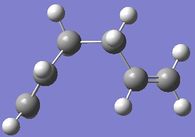
|
|

|
|
| File Type | .log | .log | .log | .log |
| Calculation Type | FOPT | FOPT | FOPT | FOPT |
| Calculation Method | RHF | RHF | RHF | RHF |
| Basis Set | 3-21G | 3-21G | 3-21G | 3-21G |
| Final Energy E(RB3LYP) | -231.69266114 a.u. | -231.69153035 a.u. | -231.68961573 a.u. | -231.68771616 a.u. |
| RMS Gradient Norm | 0.00002816 a.u. | 0.00000864 a.u. | 0.00001828 a.u. | 0.00001165 a.u. |
| Dipole Moment | 0.3 Debye | 0.1 Debye | 0.4 Debye | 0.4 Debye |
| Point Group | C1 | C2 | C1 | C2 |
| Job cpu time | 44.0 seconds | 37.0 seconds | 47.0 seconds | 55.0 seconds |
| Output log file | Gauche 3 3-21G log file. | Gauche 4 3-21G log file. | Gauche 5 3-21G log file. | Gauche 3-21G log file. |
| Table 2. 3-21G Gaussian Calculation Summary | ||||
There are other gauche isomers that could be computed, however, when comparing with Appendix 1, the lowest conformer has been found. Gauche 3 has the lowest energy out of these four gauche conformers and also has a lower energy than the anti 1 conformer and so is the most stable conformer of 1,5-hexadiene. Gauche 1 has an energy of -231.69266114 a.u. and anti 1 has an energy of -231.69260229 a.u., the difference is 5.885 x 10⁻⁵ a.u. or 0.04 kJ mol-1. This was not expected but can be explained with the gauche effect. The energy difference is very small and so the effect contributing to this is expected to also be small. Usually, orbital overlap favours the anti conformer because σC-H/σ*C-H and σC-C/σ*C-C orbital interactions (that occur with anti conformers) are more stabilising than σC-H/σ*C-H, σC-C/σ*C-H and σC-H/σ*C-C orbital interactions (that occur with the gauche conformers). However, in the case of 1,5-hexadiene there seems to be a slight overriding effect due to the folding of the chain in the gauche state that sets up attractive H...H van der Waals interactions. The point groups of these four molecule are included in table 2. The four gauche conformers were compared with the gauche conformers that are listed in Appendix 1 and the title of each conformer has been used to correspond to the conformer in Appendix 1 because they each agree in terms of energy, structure and point group with a conformer in Appendix 1.
The 3-21G optimised anti 2 1,5-hexadiene molecule was optimised again using the RB3LYP/6-31G(d) method and basis set. Table 3 displays a summary of the information from this calculation.
| Anti 2 Optimisation | |
|---|---|
| File Type | .log |
| Calculation Type | FOPT |
| Calculation Method | RB3LYP |
| Basis Set | 6-31G(d) |
| Final Energy E(RB3LYP) | -234.61170280 a.u. |
| RMS Gradient Norm | 0.00001326 a.u. |
| Dipole Moment | 0.0 Debye |
| Point Group | Ci |
| Output log file | Anti 2 6-31G(d) log file. |
| Table 3. 6-31G(d) Gaussian Calculation Summary | |
The energy computed using this method and basis set is lower than the energy computed using the HF/3-21G calculation. The 6-31G(d) basis set is a higher level basis set and the structure of the molecule has changed slightly. The double bonds in the HF/3-21G molecule have a bond distance of 1.32 A while the B3LYP/6-31G(d) molecule has this bond distance of 1.33 A. Additionally, the terminal C-H bond distance is 1.07 A with the HF molecule and 1.09 A with the B3LYP molecule. Also, the bond angle of the 3 central C-C-C is 111.3o with the HF molecule and 112.7o with the B3LYP molecule. So, it seems that the 6-31G(d) method produces slightly longer bond distances and larger bond angels. However, since different basis sets were used, the energies cannot be directly compared.
A frequency calculation was carried out on the Anti 2 6-31G(d) optimised structure. This is so that the optimised energies can be confirmed to be at minimum energy points on the potential energy surface. Additionally, this calculation is carried out so that the optimised energies can be compared with experimentally measured quantities. The calculation was set as a FERQ and the same B3LYP/6-31G(d) method and basis set used. The results are displayed in table 4. No imaginary frequencies were reported as all the frequencies were reported with a positive sign.
| 1,5-hexadiene anti(2) | |
|---|---|
| Sum of electronic and zero-point Energies | -234.469229 |
| Sum of electronic and thermal Energies | -234.461869 |
| Sum of electronic and thermal Enthalpies | -234.460925 |
| Sum of electronic and thermal Free Energies | -234.500853 |
| Output log file | Anti 2 freq (temp = 298.15k) log. |
| Table 4. 1,5-hexadiene at 298.14 K | |
An attempt was made to run the frequency at 0.0 k using the keywords "Temperature=0k". The output file showed that this calculation was unsuccessful as it had automatically run the calculation at 298.14k. The output log file for this calculation is attached: 1,5-hexadiene anti(2) freq (temp = 0.0k) log file. This may be because at 0k, there are no vibrations taking place. Instead, the calculation was run at 0.1 k and the calculation ran. The energies of this calculation are shown in table 5.
| 1,5-hexadiene anti(2) | |
|---|---|
| Sum of electronic and zero-point Energies | -234.469229 |
| Sum of electronic and thermal Energies | -234.469228 |
| Sum of electronic and thermal Enthalpies | -234.469227 |
| Sum of electronic and thermal Free Energies | -234.469228 |
| Output log file | Anti 2 freq (temp = 0.01k) log. |
| Table 5. 1,5-hexadiene at 0.01 K | |
As expected, only the sum of electronic and zero point energies are the same at both temperatures because it is the energy at 0 k including the zero point vibrational energy.
Optimizing the Chair Transition Structure

An allyl fragment (CH2CHCH2) was drawn on Gausview and optimised using the HF/3-21G basis set. The output file for this calculation is attached: CH2CHCH2 OPT log file. The allyl fragment was then duplicated and positioned as in a chair transition state orientation. The distance between the two terminal carbons were set at 2.2 A and this transition structure is displayed in Figure 3.
A transition state optimisation was then carried out on the structure displayed in Figure 3. In Gaussview, the Opt+Freq was selected and the Optimisation to a TS Berny was chosen. The force constant was also chosen to be calculated once and the keywords "Opt=NoEigen" added. The log output file for this calculation is attached: Chair TS log file. The chair TS structure belongs to the C2h point group. The two sets of carbon terminals now have a bond distance of 2.02 A as displayed in figure 4. This optimised structure gives one imaginary frequency with magnitude 818 cm-1. The frequency with the magnitude of 818 cm-1 was animated and is displayed in Figure 5. This vibration appears to correspond to the Cope rearrangement.
 |
 |
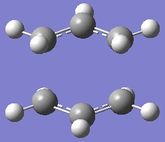
Now this transition structure was optimised using the frozen coordinate method. So the bond distances between the terminal carbons were frozen at a distance of approximately 2.2 A each using the Redundant Coord Editor. An optimisation was run as a minimum and the keywords "Opt=ModRedundant" were already included in the input line. The output log file for this calculation is attached: Chair TS OPT log file. This optimised structure is shown in figure 6 and looks the same as the TS that was optimised above except that the bond forming distances are fixed to approximately 2.2 A. Now the transition state structure prepared in figure 6 was optimised. This was done by first using the Redundant Coord Editor to change 'unidentified' to 'bond' and 'add to derivative' for the two bonds that were frozen. A transition state optimisation calculation was then run on this structure by choosing Opt+Freq. The force constant was set as 'Never' as this time a normal guess Hessian was modified to include the information about the two coordinates that were frozen. The keywords "Opt=NoEigen" were also added. The output log file for this calculation is attached: Chair OPT log file. The two sets of terminal carbons now have a bond distance of 2.02 A. This is the same bond distance as was recorded using the first method above. This optimised transition state geometry is displayed in figure 7:
 |
 |
Optimising the Boat Transition Structure
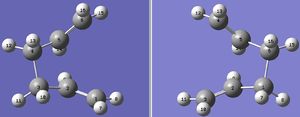
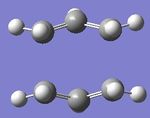
The boat structure transition state was optimised in this section using the QST2 method. Using two of the anti 2 optimised structures, the molecules were calculated as a Opt+Freq and the option 'TS (QST2)' was selected. Before running the optimisation, the reactant and product molecules had their carbons and hydrogen corresponding correctly to each other as displayed in figure 8. The output log file for this calculation is attached: QST2 Boat TS log file. The optimised boat transition state structure belongs to the C2v point group and is displayed in figure 9. The terminal carbons have the distance of 2.14 A in the boat transition state. One imaginary frequency was found of magnitude 840 cm-1 and this imaginary frequency is displayed in figure 10 and corresponds to the Cope rearrangement.
 |
 |
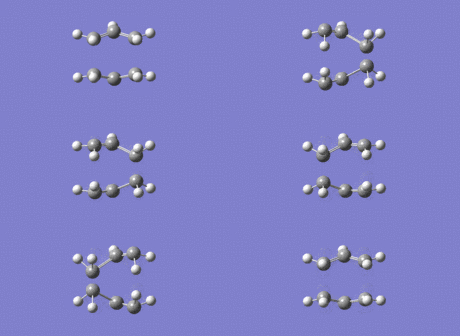 |
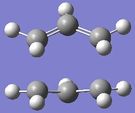
The optimised transition state was then computed using the QST3 method. This method allows for a guess transition state structure to be included. Again, the numbering of the atoms are important and figure 11 shows the three structures that were used in this calculation, the guess transition state structure is on the right hand side. The output log file for this calculation is attached: QST3 Boat OPT log file. The optimised boat transition state structure is displayed in figure 12. The terminal carbons have the distance of 2.14 A in the boat transition state - the same as when the QTS2 method was used. One imaginary frequency was found of magnitude 840 cm-1 which is the same as that found when using the QST2 method. The animated vibrational mode is the same as displayed in figure 10 above.
 |
 |
Chair IRC method
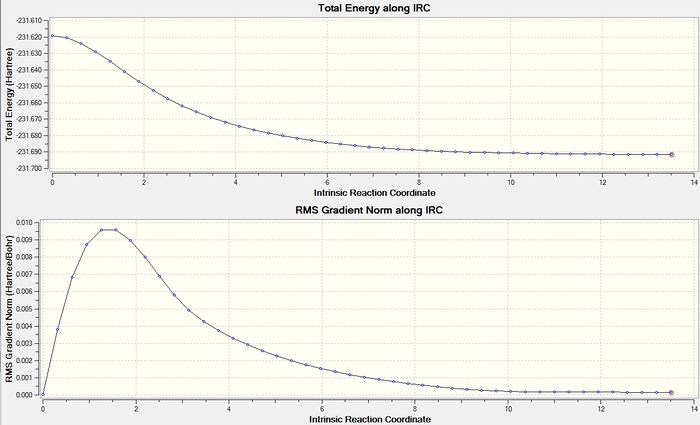
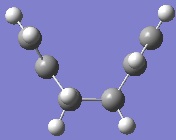
The Intrinsic Reaction Coordinate method was used to follow the minimum energy pathway from the chair transition state to the local minimum on the potential energy surface of the Cope rearrangement. So, the optimised chair structure was used and the method for the Gaussian calculation was set as IRC. The reaction coordinates were chosen to compute in only the forward direction, along 50 points and the force constant was selected to be computed once. The output log file for this calculation is attached: IRC chair log file. However, this calculation did not calculate a satisfactory IRC because the 'Total Energy along IRC' graph did not show a satisfactory minimum energy plateau. Therefore this calculation was rerun with the force constant set to be calculated 'always'. This time the 'Total Energy along IRC' graph did show a good minimum energy plateau and is displayed in figure 13. The log output file for this calculation is attached: IRC chair (always) log file. Even though this IRC calculation was set to compute 50 points, it only computed 44 points and therefore this calculation was not repeated with a higher number of points. So, the final product structure is displayed in figure 14. This final structure has a gauche conformation, an energy of -231.69157880 hartrees and belongs to the point group C2. This structure is most similar to gauche2 in Appendix 1 as it has a very similar structure and the same point group. There is a small energy difference between the IRC computed final structure and gauche2 which has an energy of -231.69167 hartrees. However, the final product structure was further optimised using the HF/3-21G method and the output log file for this calculation attached: IRC OPT chair log file. The energy of this optimised structure is -231.69166702 hartrees - this energy is the same as gauche2.
 |
 |
Boat IRC method
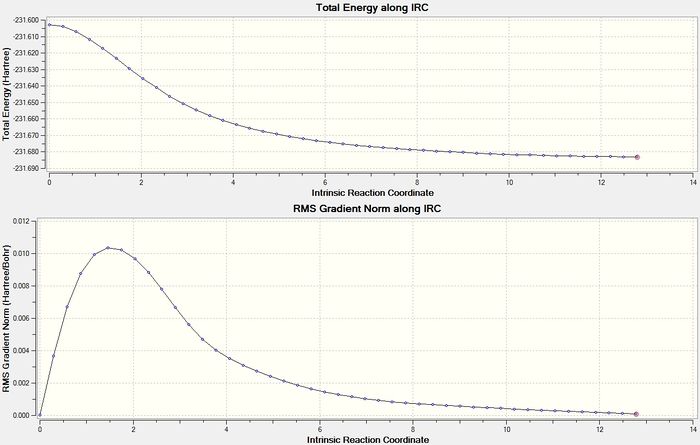
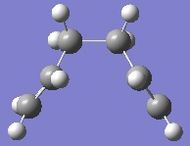
The IRC method was repeated using the boat TS structure and the force constant was set as always. The output log file for this calculation is attached: IRC OPT boat log file. The graphs for this calculation is displayed in figure 15 and the final structure is displayed in figure 16. The energy of the final structure is -231.68298153 hartrees. This energy does not correspond with any of the structures in Appendix 1. So the final structure was optimised using HF/3-21G and the output log file is attached: IRC OPT boat log file. The energy of this final structure is -231.68302550 hartrees. Again, this structure does not correspond with any of the structures in Appendix 1 and looks like a structure with a syn-periplanar conformation. In fact, this energy is higher than any of the energies reported in Appendix 1. In conclusion, from the computational techniques used so far it seems that the 1,5-hexadiene rearrangement undergoes a chair TS structure and the product looks like gauche 2 as this seems to be the lowest energy pathway for the reaction to follow, however, the activation energy still needs to be calculated to confirm that this is true.
 |
 |
Activation energies
The activation energies for the TS structures are computed in this section. To do this, the HF/3-21G optimised structures were optimised again using B3LYP/6-31G* level of theory. A frequency calculation was also run on both structures. Table 6 displays a summary of the data computed for the boat and chair TS structures. The B3LYP/6-31Gd values are found to be lower in energy than the HF/3-21G values. To calculate the activation energy at 0 k for the chair and boat TS, the difference between the TS and anti2 'Sum of electronic and zero-point energies' were calculated and the value was converted to kcalmol-1. This was repeated for the activation energy at 298.15 k by using the 'Sum of electronic and thermal energies'. The results are summarised in table 7.
| HF/3-21G | B3LYP/6-31G* | ||||||
|---|---|---|---|---|---|---|---|
| Electronic energy | Sum of electronic and zero-point energies | Sum of electronic and thermal energies | Electronic energy | Sum of electronic and zero-point energies | Sum of electronic and thermal energies | ||
| at 0 K | at 298.15 K | at 0 K | at 298.15 K | ||||
| Chair TS | -231.619322 | -231.466699 | -231.461340 | -234.556984 | -234.414932 | -234.409012 | |
| Boat TS | -231.602802 | -231.450930 | -231.445302 | -234.543079 | -234.395988 | -234.395044 | |
| Reactant (anti2) | -231.692535 | -231.539539 | -231.532565 | -234.611710 | -234.469212 | -234.461856 | |
Table 6.
Summary of activation energies (in kcal/mol)
| HF/3-21G | HF/3-21G | B3LYP/6-31G* | B3LYP/6-31G* | Expt.[1] | |
| at 0 K | at 298.15 K | at 0 K | at 298.15 K | at 0 K | |
| ΔE (Chair) | 45.71 | 44.70 | 34.06 | 33.16 | 33.5 ± 0.5 |
| ΔE (Boat) | 55.60 | 54.76 | 45.94 | 45.94 | 44.7 ± 2.0 |
Table 7.
Both, the chair and boat B3LYP/6-31G* computed activation energies compare well with the experimental values. The HF/3-21G values however, do not compare well with the experimental values. In addition, at both temperatures, the chair activation energy is lower than the boat activation energy and so it is expected from the computational techniques used that the 1,5-hexadiene will prefer to rearrange through a chair TS.
The Diels Alder Cycloaddition
The Diels Alder reaction is a pericyclic cycloaddition between a diene and a dienophile. This reaction is categorised as a pericyclic cycloaddition because it involves the concerted formation of two σ bonds between the terminals of two conjugated π systems. The HOMO of one of the reactants can react with the LUMO of the other reactant if there is a good overlap between them - this occurs when both sets of orbitals have the same symmetry. If this happens, then the reaction is 'allowed'. If the orbitals have different symmetry then there isn't significant overlap and the reaction is 'forbidden'. Two Diels Alder reactions are investigated in this report and the MOs, energies and TS structures are analysed to gain an understanding of how these reactions occur. In the second Diels Alder reaction, the dienophile is substituted and it will be investigated to see how the secondary orbital overlap affects the TS and final products.
Ethylene and cis butadiene cycloaddition
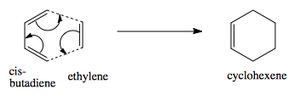
The Diels Alder [4s + 2s] cycloaddition reaction between cis-butadiene and ethylene is investigated in this section and the reaction is shown in figure 17. The cis-butadiene contributes 4 pi electrons and the ethylene contributes 2 pi electrons to the cycloaddition reaction. The relevant orbitals that are involved in this reaction is the HOMO and LUMO of cis-butadiene and the pi and pi* orbital of ethylene. First a molecule of cis-butadiene was drawn in gaussview and optimised using the AM1 semi-empirical molecular orbital method. This was repeated for ethylene. The HOMO/LUMO MOs for these molecules are displayed in table 8. All the symmetry that is reported in this section is with respect to the plane.
| Cis-butadiene MOs | Cis-butadiene symmetry | Ethylene MOs | Ethylene symmetry | |
|---|---|---|---|---|
| LUMO | 
|
Symmetric | 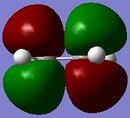
|
Anti symmetric |
| HOMO | 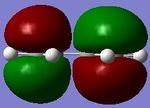
|
Anti symmetric | 
|
Symmetric |
| Table 8. cis butadiene opt chk file. ethylene opt chk file. | ||||
When the cycloaddition occurs, the ethylene appraches the cis-butadiene from above and the HOMO of butadiene can overlap and interact well with the LUMO of ethylene and the HOMO of ethylene can overlap and interact well with the LUMO of butadiene because they have the same symmetry. Therefore, this reaction is 'allowed'. The way that this overlap occurs is illustrated in figure 18 and this interaction is how the 2 new σ bonds are formed.

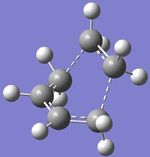
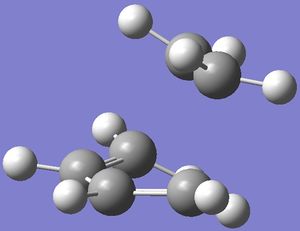
Now, the optimised cis-butandiene and ethylene molecules were used to draw a guess transition state geometry for the Diels Alder cyclisation. The guess geometry is shown in figure 19. Both terminal C-C distances were set as 2.0 A. An OPT+FREQ calculation was run with the optimisation set to a TS (Berny) and the force constant set to be calculated once. The method was set as semi-empirical AM1 and the keywords "Opt=NoEigen" was added. The log output file for this calculation is attached: Diels Alder TS log file. The two sets of carbon terminals now have a bond distance of 2.12 A as displayed in figure 20. Typical sp3 and sp2 C-C bond distances are 1.54 A and 1.47 A respectively.[2] The bond forming C-C bond lengths was computed to be 2.12 A. This shows that a C-C sp3 or sp2 bond has not yet formed at the TS. However, the van der Waals radius of a C atom is 1.7 A and 2 x 1.7 = 3.2 A.[3] So, there is an interaction between the bond forming Cs as the bond distance is 2.12 A which is less than the sum of the van der Waals radii and the TS structure is therefore in between the situation when the two Cs are separate and when they have formed a σ bond.
 |
 |
The HOMO/LUMO of the TS are displayed in table 9. There are two images of the HOMO MOs in table 9, however, there is only one MO but this MO has been rotated to see the symmetry and nodal properties. The approach of the ethylene from above ensures that there is good orbital overlap and this is seen in the HOMO of the TS where the nodal planes of the ethylene and butadiene are parallel. This optimised TS structure has one imaginary frequency with magnitude 956 cm-1. This vibrational mode is animated in figure 21 and corresponds to the Diels Alder cycloaddition bond formation and is synchronised. The lowest positive frequency that was computed is at 147.36 cm-1 and is displayed in figure 22. This vibrational mode is not a bond forming vibration.
|
| ||||||||||||||
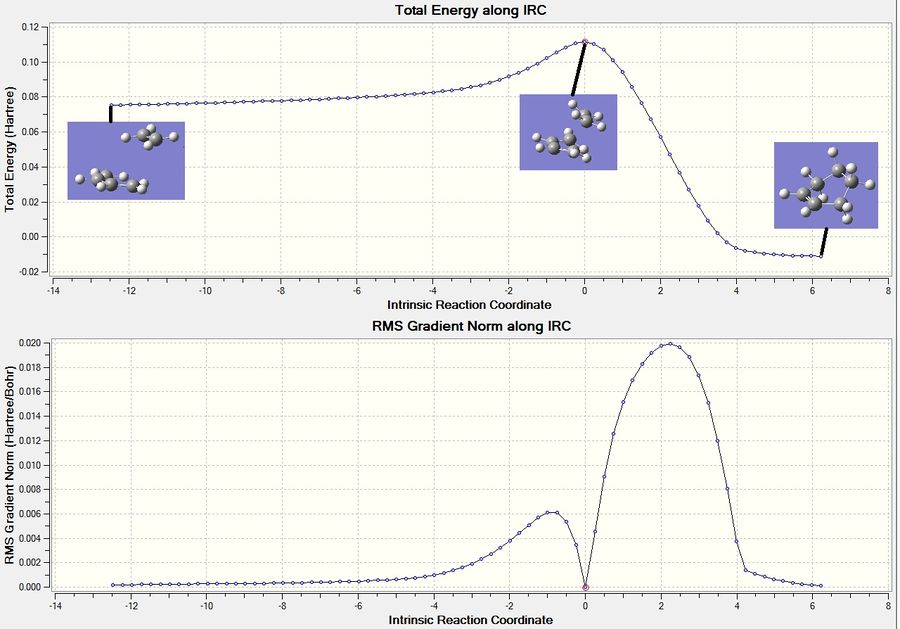
The IRC method was used to follow the minimum energy pathway from the transition state to the local minimum on the potential energy surface of this Diels Alder reaction. So, the optimised TS structure was used and the method for the Gaussian calculation was set as IRC. The reaction coordinates were chosen to compute in both directions, along 100 points and the force constant was selected to be computed always. The output log file for this calculation is attached: IRC log file. The graphs for this calculation is displayed in figure 23. The structure in the middle of the graph in figure 23 shows the TS structure - this is where the energy is at a maximum. The product is displayed in the right of the diagram - where the energy is at a minimum. Since the IRC was run in both directions, the structure on the left shows when the two molecule are separated from each other before the TS. The IRC shows that the TS structure computed follows a minimum energy pathway to the cyclohexene molecule.
Cyclohexa-1,3-diene and maleic anhydride cycloaddition

The Diels Alder reaction between cyclohexa-1,3-diene and maleic anhydride is investigated. The reaction scheme for this reaction is displayed in figure 24. Two products can form from this cycloaddition, the exo or endo product. The endo adduct is favoured and various computational techniques will be used to analyse the steric and secondary overlap effects that contribute to the favoured reaction pathway.
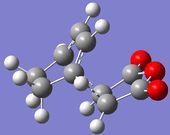
The TS structure for this reaction was optimised using the QST2 method twice, once for the exo and a second time for the endo TS. Once the reactants and products were drawn and numbered correctly, an OPT+FREQ calculation was run with the optimisation set as QST2 and the force constant set to calculate once. The semi-empirical/AM1 method was also used. The optimised exo TS structure is displayed in figure 25 and the optimised endo TS structure is displayed in figure 26. The output files for these two calculations are attached: Exo log file. and Endo log file. The important bond distances are illustrated in the Jmol 3D structures. The sum of the van der Waals radii for 2 Cs is bigger than the C-C bond forming distance in the exo and endo TS - meaning that there is an interaction but it is still less than a regular C-C bond distance. The C-C bond forming distance is 2.17 A in the exo TS and 2.16 A in the endo TS. This shows that the endo TS experiences a slightly stronger C-C interaction at the TS. The C-C through space distance between the -(C=O)-O-(C=O)- fragment of the maleic anhydride and the C atoms of the “opposite” -CH2-CH2- for the exo is 2.95 A. While the C-C through space distances between the -(C=O)-O-(C=O)- fragment of the maleic anhydride and the C atoms of the “opposite” -CH=CH- for the endo TS is 2.89 A. This is because the exo TS experiences more steric repulsion due to the CH2 fragment rather than the CH fragment that the endo TS has. Additionally, the endo TS has a favourable secondary orbital interaction that helps to stabilise this TS and probably due to both, the less steric repulsion and the favourable secondary orbital overlap, the endo TS is energetically lower and explains why the through space C-C distance is shorter at 2.89 A. The energies of the endo and exo TS are compared in table 10. The exo TS is higher in energy and therefore this cycloaddition reaction is kinetically controlled and so it is expected that the endo product predominates.
 |
 |
| |||||||||||||
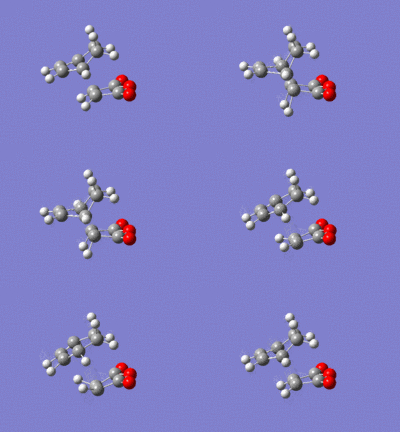
These two optimised TS structure have one imaginary frequency each. The exo TS has one with magnitude 812.4 cm-1 as animated in Figure 27 and the endo TS has one with magnitude 806.4 cm-1 as animated in figure 28 . These vibrational modes animated correspond to the Diels Alder cycloaddition bond formations and are both synchronised.
 |
 |
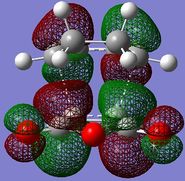
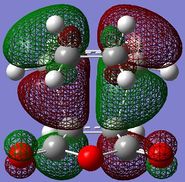
The HOMO/LUMO of the exo and endo TS are displayed in table 11. The secondary orbital overlap favours the endo TS. This is because while the 2 new σ bonds are being formed, there is another stabilising effect that occurs due to the approach of the maleic anhydride molecule in the endo TS. This is due to the overlap between the diene pi orbitals and the pi orbital of the C=O substituents on the dienophile. This leads to a stabilising interaction and also explains why the endo TS energy is lower. On the MO diagrams in table 11 this can be seen. Looking at the endo TS HOMO orbitals, the orbitals in the middle of the diagrams are relatively bigger than the orbitals in the middle of the exo diagram. This is due to the additional interaction that occurs in the endo TS because of the secondary orbital overlap. Also, the nodal planes of the C=O pi orbitals are parallel with the nodal plane of the other pi orbitals and this also helps that this interaction is effective.
| Exo | Endo | |||||
|---|---|---|---|---|---|---|
| LUMO | 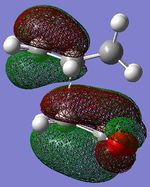
|
|
Anti symmetric | 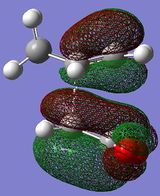
|

|
Anti symmetric |
| HOMO | 
|
|
Anti symmetric | 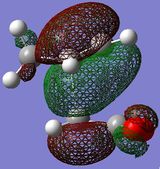
|
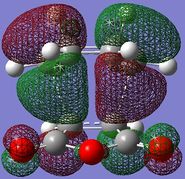
|
Anti symmetric |
| Table 11. Exo chk file. Endo chk file. | ||||||
The IRC method was used on the optimised exo TS structure. The reaction coordinates were chosen to compute in the forward direction, along 100 points and the force constant was selected to be computed always. This calculation was unsuccessful because it showed the TS structure moving further away from each other. So the calculation was repeated and this time the direction was set as reverse which seemed to work. The output log file for this calculation is attached:Exo IRC file. The graphs for this calculation is displayed in figure 15. The diagram to the left of the graph in figure 29 shows the TS structure - this is where the energy is at a maximum. The product is displayed in the right of the diagram - where the energy is at a minimum. The IRC shows that the TS structure computed follows a minimum energy pathway to the exo product. It is worth noting that the last coordinate displayed on figure 29 shows a gradient that has increased from the second last coordinate. This means that the second last coordinate is the product (as indicated by the diagram) however, even after finding the lowest energy product Gaussian attempted to try a different structure that would have a lower energy structure, this turned out to actually have a higher energy and so it is the second last coordinate that is the product.
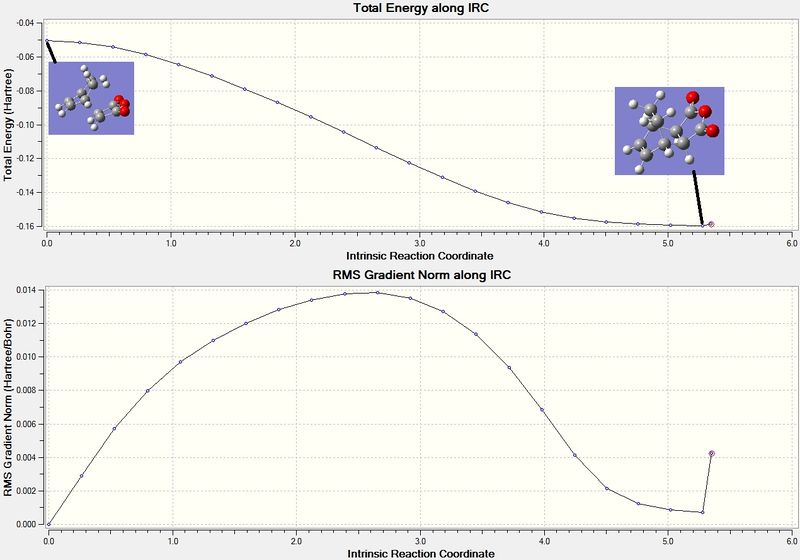
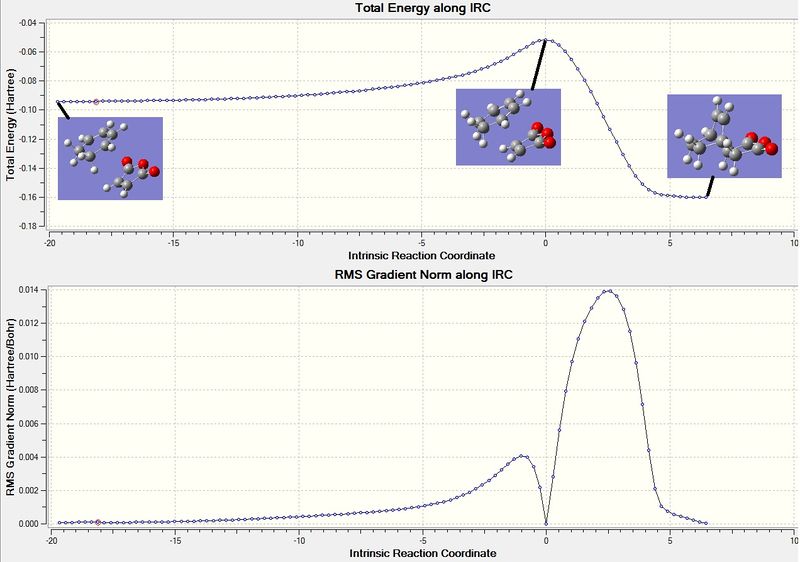
The IRC method was used on the optimised endo TS structure. The reaction coordinates were chosen to compute in the forward direction, along 100 points and the force constant was selected to be computed in both ways. The output log file for this calculation is attached:Endo IRC file. The graphs for this calculation is displayed in figure 30. The diagram in the middle of the graph in figure 30 shows the TS structure - this is where the energy is at a maximum. The product is displayed in the right of the diagram - where the energy is at a minimum. The image to the left is when the two molecules are separate before the TSThe IRC shows that the TS structure computed follows a minimum energy pathway to the exo product.
Conclusion
From the computational techniques carried out in this report, it is difficult to conclude to what the extent the secondary orbital overlap contributes to the stability of a TS. This is because of the other factor that is experienced in the example of maleic anhydride and cyclohexa-1,3-diene, namely, the steric repulsion experienced between the C and the -(C=O)-O-(C=O)- fragment. The theory that the secondary orbital overlap does contribute to the stabilisation of a TS is contested[4] and this report shows that the effect of the SOO is minimal and may have a contribution to the endo product being the favourable product, however, the steric repulsion that is experienced in the exo TS is also a contributing factor to the endo product being predominately formed.
Further Study
There are various computational experiments that could be carried out to further the study that has been conducted in this report.
1. Different examples where there is no steric repulsion factor involved, could be explored to determine the contribution of the secondary orbital overlap.
2. The effect that the electron withdrawing -(C=O)-O-(C=O)- fragment has on the TS for both the exo and endo TS has been neglected in the analysis carried out in this report and so this analysis could be carried out with the maleic anhydride and cyclohexa-1,3-diene example and compared with other example where a weaker EWG is included.
3. The calculations in this report could be repeated using a different method and basis set and the results compared.
References
- ↑ 1.0 1.1 Olaf Wiest, Kersey A. Black and K. N. Houk, "Density Functional Theory Isotope Effects and Activation Energies for the Cope and Claisen Rearrangements", J. Am. Chem. Soc, 1994, 116, 10336-10337DOI:10.1021/ja00101a078
- ↑ Fox, Marye Anne; Whitesell, James K. "Organische Chemie: Grundlagen, Mechanismen, Bioorganische Anwendungen", Springer, 1995.
- ↑ Bondi, A. "Van der Waals Volumes and Radii", J. Phys. Chem., 1964, 68 (3), 441-451 DOI:10.1021/j100785a001
- ↑ Marye Anne Fox,* Raul Cardona, and N. J. Kiwiet "Steric Effects vs. Secondary Orbital Overlap in Diels-Alder Reactions. MNDO and AM1 Studies", J. Org. Chem., 1987, 52, 1469-1474. DOI:10.1021/jo00384a016

