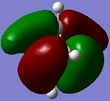
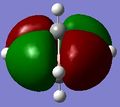
Rep:Mod:mAmY3cIno
Experiment Y3C Inorganic
Computational chemistry was used in this experiment to help gain an insight into the bonding, conformations and stability of a number of inorganic compounds. IR spectra, molecular orbital diagrams and other analytical techniques have also been computed to explain and explore the nature and behaviour of various complexes.
BH3 3-21G
Using Gaussview, a BH3 molecule was drawn and the lengths of the 3 B-H bonds were set as 1.53 A, 1.54 A and 1.55 A in order to break the symmetry of the molecule. This molecule was then optimised using the B3LYP method with the low accuracy 3-21G basis set.
The output log file is attached: BH3 3-21G log file.
Table 1 displays a summary of the information from this calculation.
| BH3 3-21G Optimisation | |
|---|---|
| File Type | .log |
| Calculation Type | FOPT |
| Calculation Method | RB3LYP |
| Basis Set | 3-21G |
| Final Energy E(RB3LYP) | -26.46226429 a.u. |
| RMS Gradient Norm | 0.00008851 a.u. |
| Dipole Moment | 0.00 Debye |
| Point Group | CS |
| Job cpu time | 21.0 seconds |
| Table 1. BH3 3-21G Gaussian Calculation Summary | |
The RMS gradient is very close to 0 which shows that the optimisation has found the lowest (or very very close to the lowest) energy configuration of this molecule. The "item" section below shows that the forces and displacements have all converged and this section shows that Gaussian has finished the job properly.
Item               Value     Threshold  Converged?
 Maximum Force            0.000220     0.000450     YES
 RMS     Force            0.000106     0.000300     YES
 Maximum Displacement     0.000940     0.001800     YES
 RMS     Displacement     0.000447     0.001200     YES
 Predicted change in Energy=-1.672479D-07
 Optimization completed.
    -- Stationary point found.
                           ----------------------------
                           !   Optimized Parameters   !
                           ! (Angstroms and Degrees)  !
 --------------------------                            --------------------------
 ! Name  Definition              Value          Derivative Info.                !
 --------------------------------------------------------------------------------
 ! R1    R(1,2)                  1.1948         -DE/DX =   -0.0002              !
 ! R2    R(1,3)                  1.1947         -DE/DX =   -0.0002              !
 ! R3    R(1,4)                  1.1944         -DE/DX =   -0.0001              !
 ! A1    A(2,1,3)              120.0157         -DE/DX =    0.0                 !
 ! A2    A(2,1,4)              119.986          -DE/DX =    0.0                 !
 ! A3    A(3,1,4)              119.9983         -DE/DX =    0.0                 !
 ! D1    D(2,1,4,3)            180.0            -DE/DX =    0.0                 !
 --------------------------------------------------------------------------------
 GradGradGradGradGradGradGradGradGradGradGradGradGradGradGradGradGradGrad
BH3 6-31G(d,p)
The optimised BH3 molecule was further optimised using a higher level basis set: 6-31G(d,p).
The output log file of this calculation is attached: BH3 6-31G(d,p) log file.
Table 2 displays a summary of the information from this calculation and the "item" section below shows that the forces and displacements converged again and that the calculation was completed. The RMS gradient is very close to 0 which shows that the optimisation has found the lowest (or very very close to the lowest) energy configuration of this molecule.
| BH3 6-31G(d,p) optimisation | |
|---|---|
| File Type | .log |
| Calculation Type | FOPT |
| Calculation Method | RB3LYP |
| Basis Set | 6-31G(d,p) |
| Final Energy E(RB3LYP) | -26.61532360 a.u. |
| RMS Gradient Norm | 0.00000706 a.u. |
| Dipole Moment | 0.00 Debye |
| Point Group | CS |
| Job cpu time | 6.0 seconds |
| Table 2. BH3 6-31G(d,p) Gaussian Calculation Summary | |
Item               Value     Threshold  Converged?
 Maximum Force            0.000012     0.000450     YES
 RMS     Force            0.000008     0.000300     YES
 Maximum Displacement     0.000061     0.001800     YES
 RMS     Displacement     0.000038     0.001200     YES
 Predicted change in Energy=-1.068574D-09
 Optimization completed.
    -- Stationary point found.
                           ----------------------------
                           !   Optimized Parameters   !
                           ! (Angstroms and Degrees)  !
 --------------------------                            --------------------------
 ! Name  Definition              Value          Derivative Info.                !
 --------------------------------------------------------------------------------
 ! R1    R(1,2)                  1.1923         -DE/DX =    0.0                 !
 ! R2    R(1,3)                  1.1923         -DE/DX =    0.0                 !
 ! R3    R(1,4)                  1.1923         -DE/DX =    0.0                 !
 ! A1    A(2,1,3)              120.0055         -DE/DX =    0.0                 !
 ! A2    A(2,1,4)              119.9938         -DE/DX =    0.0                 !
 ! A3    A(3,1,4)              120.0007         -DE/DX =    0.0                 !
 ! D1    D(2,1,4,3)            180.0            -DE/DX =    0.0                 !
 --------------------------------------------------------------------------------
 GradGradGradGradGradGradGradGradGradGradGradGradGradGradGradGradGradGrad
The optimised B-H bond distance is 1.19 A and the optimised H-B-H bond angle is 120.0o.
The total energy of the 3-21G optimised structure is -26.46226429 a.u. and the total energy of the 6-31G(d,p) optimised structure is -26.61532360 a.u. The energy difference between these two basis sets is 0.15305931 a.u. or 401.86 kJmol-1. However, the total energies of these calculations are highly dependent on the quality of the basis set which means that the energy of structures that were computed using two different basis sets can never be compared.
GaBr3 LanL2DZ
A molecule of GaBr3 was drawn using Gaussview and the symmetry restricted to D3h with the tolerance set to "very tight (0.0001)". This molecule was optimised using the B3LYP method and the LanL2DZ basis set.
The D-Space link of this calculation is: DOI:10042/26073
Table 3 displays a summary of the information from this calculation and the "item" section below shows that the forces and displacements converged and that the calculation was completed.
| GaBr3 LanL2DZ optimisation | |
|---|---|
| File Type | .log |
| Calculation Type | FOPT |
| Calculation Method | RB3LYP |
| Basis Set | LANL2DZ |
| Final Energy E(RB3LYP) | -41.70082783 a.u. |
| RMS Gradient Norm | 0.00000016 a.u. |
| Dipole Moment | 0.00 Debye |
| Point Group | D3H |
| Job cpu time | 23.1 seconds |
| Table 3. GaBr3 LanL2DZ Gaussian Calculation Summary | |
Item               Value     Threshold  Converged?
 Maximum Force            0.000000     0.000450     YES
 RMS     Force            0.000000     0.000300     YES
 Maximum Displacement     0.000003     0.001800     YES
 RMS     Displacement     0.000002     0.001200     YES
 Predicted change in Energy=-1.282686D-12
 Optimization completed.
    -- Stationary point found.
                           ----------------------------
                           !   Optimized Parameters   !
                           ! (Angstroms and Degrees)  !
 --------------------------                            --------------------------
 ! Name  Definition              Value          Derivative Info.                !
 --------------------------------------------------------------------------------
 ! R1    R(1,2)                  2.3502         -DE/DX =    0.0                 !
 ! R2    R(1,3)                  2.3502         -DE/DX =    0.0                 !
 ! R3    R(1,4)                  2.3502         -DE/DX =    0.0                 !
 ! A1    A(2,1,3)              120.0            -DE/DX =    0.0                 !
 ! A2    A(2,1,4)              120.0            -DE/DX =    0.0                 !
 ! A3    A(3,1,4)              120.0            -DE/DX =    0.0                 !
 ! D1    D(2,1,4,3)            180.0            -DE/DX =    0.0                 !
 --------------------------------------------------------------------------------
 GradGradGradGradGradGradGradGradGradGradGradGradGradGradGradGradGradGrad
The optimised Ga-Br bond distance is 2.35 A and the optimised Br-Ga-Br bond angle is 120.0o. A literature source[1] reports the Ga-Br bond length in the trigonal planar GaBr3 molecule as 2.249 A. This literature reported value is of a GaBr3 molecule in the gas phase and therefore is not used as a quantitative comparison. However, this literature source does show that the computed bond distance is very reasonable as the two bond distances are so similar.
BBr3 GEN
The 6-31G(d,p) optimised BH3 molecule was changed to a BBr3 molecule and optimised using the basis set GEN and the key word "pseudo=read gfinput" was added. The basis set for each atom was then specified. For B, the 6-31G(d,p) basis set was set and for the 3 Br's, the LanL2DZ basis set was specified.
The D-Space link of this calculation is: DOI:10042/26075
Table 4 displays a summary of the information from this calculation and the "item" section below shows that the forces and displacements converged and that the calculation was completed.
| BBr3 GEN optimisation | |
|---|---|
| File Type | .log |
| Calculation Type | FOPT |
| Calculation Method | RB3LYP |
| Basis Set | Gen |
| Final Energy E(RB3LYP) | -64.43644904 a.u. |
| RMS Gradient Norm | 0.00000926 a.u. |
| Dipole Moment | 0.00 Debye |
| Point Group | CS |
| Job cpu time | 35.8 seconds |
| Table 4. BBr3 GEN Gaussian Calculation Summary | |
Item               Value     Threshold  Converged?
 Maximum Force            0.000017     0.000450     YES
 RMS     Force            0.000010     0.000300     YES
 Maximum Displacement     0.000107     0.001800     YES
 RMS     Displacement     0.000062     0.001200     YES
 Predicted change in Energy=-2.170128D-09
 Optimization completed.
    -- Stationary point found.
                           ----------------------------
                           !   Optimized Parameters   !
                           ! (Angstroms and Degrees)  !
 --------------------------                            --------------------------
 ! Name  Definition              Value          Derivative Info.                !
 --------------------------------------------------------------------------------
 ! R1    R(1,2)                  1.9339         -DE/DX =    0.0                 !
 ! R2    R(1,3)                  1.934          -DE/DX =    0.0                 !
 ! R3    R(1,4)                  1.934          -DE/DX =    0.0                 !
 ! A1    A(2,1,3)              120.0006         -DE/DX =    0.0                 !
 ! A2    A(2,1,4)              119.9974         -DE/DX =    0.0                 !
 ! A3    A(3,1,4)              120.002          -DE/DX =    0.0                 !
 ! D1    D(2,1,4,3)            180.0            -DE/DX =    0.0                 !
 --------------------------------------------------------------------------------
 GradGradGradGradGradGradGradGradGradGradGradGradGradGradGradGradGradGrad
The optimised B-Br bond distance is 1.93 A and the optimised Br-B-Br bond angle is 120.0o. (compare bond distances with literature)
BH3, BBr3 and GaBr3 Bond Distances
The bond distances of the three optimised molecules are compared in table 5.
| Molecule | Bond | Computed Bond distance (A) | Literature Bond distances[1] (A) |
|---|---|---|---|
| BH3 | B-H | 1.19 | 1.19 |
| BBr3 | B-Br | 1.93 | 1.893 |
| GaBr3 | Ga-Br | 2.35 | 2.249 |
When comparing ligands, the B-Br bond distance is longer than the B-H bond distance and when comparing the central element, the Ga-Br bond distance is longer than the B-Br bond distance.
At a basic level, Br has a larger atomic radius than H and so the the B-Br bond distance is expected to be longer due to the steric preference that this bond distance would have. Additionally, Br and H are similar in the way that they are both more electronegative than B. However, Br is considerably more electronegative than B with comparison to the electronegativity difference between B and H. This means that the B-Br bond is more polar than the B-H bond. Also, a H atom has 1 electron that occupies a 1s orbital. This forms a strong covalent bond with boron. This is because trigonal planar boron molecules have hybridised 3 x sp2 and 1 x pz orbitals. This allows each 1s H orbital to overlap well with a B sp2 orbital to form quite strong bonds as they match well in terms of size. However, Br has its unpaired electron in a 4p orbital and there will be a large size mismatch between this large Br 4p orbital and the small sp2 B orbital which will result in poorer overlap. So this is another factor that causes B-H to be shorter than B-Br. Also, due to the large B-Br bond distance the Br atom does not donate any of its lone pairs into the empty B pz orbital.
Ga has a larger atomic radius than B and so it is expected that the Ga-Br bond distance is longer than the B-Br bond distance because of the steric preference that this bond distance would have. B and Ga are similar in the way that both are less electronegative than Br. However, B has a higher electronegativity than Ga and and so the B-Br bond is less polar than the Ga-Br bond. B and Ga are both in group 3 and so form hybridised 3 x sp2 and 1 x pz orbitals when forming trigonal planar compounds. However, the Ga sp2 orbital is large and diffused and so its electron density is spread out more which causes a weaker interaction with the Br 4p orbital in comparison to the B sp2 orbital which is small and has its electron density more localised and therefore can interact relatively better with the Br 4p orbital.
The comparisons to literature in table 5 show that all three computed bond distance are reasonable.
In some structures, Gaussview does not display a bond between two atoms. This does not necessarily mean that there is not a bond between these two atoms. Gaussview is programmed to draw a bond between two atoms when a predetermined bond distance is met, however, in reality there are interactions or bonds between atoms even at distances which Gaussview does not display a bond. The further two atoms are away from each other will mean that the interactions they exert on each other is weaker but there is not such a clear "cut-off" point as Gaussview seems to illustrate.
The term 'bond' can be defined in various ways and there are different theories that explain the term. A bond can be defined by distance and this may be the simplest explanation, but as discussed regarding Gaussview, this has limitations in understanding which atoms are bonding together and how bonding in general works. A more general explanation that defines a bond is when there is an interaction, whether large or very faint, that influences the positions of two atoms in a way that causes them to be closer to one another either for a long or momentary amount of time. This definition can be used to explain strong intra-molecular bondings such as ionic or covalent as well as weak inter-molecular bondings such as van der Waals (London dispersion forces) interactions.
In Valance Bond theory, a chemical bond is defined as when atomic orbitals of the constituent atoms combine to give individual chemical bonds. However, Molecular Orbital theory explains what the term bonding means in an alternative and powerful way. In this theory, electrons in a molecule are not localised to specific atoms or bonds (as in in-between two atoms) but instead are delocalised in molecular orbitals that can spread over the entire molecular structure. In a way, this theory suggests that every atom in a compound, whether containing a few atoms or containing a large number of atoms, are bonded to each other through these molecular orbitals - even if the two atom are not adjacent at all. In reality, a bond cannot be defined in a single sentence that would fully justify the understandings and behaviour of what a bond is and so various theories are used, each with its own advantages and certain limitations.
BH3 Frequency Analysis
The 6-31G(d,p) optimised BH3 molecule was used to compute a frequency for this molecule.
The output log file of this calculation is attached: BH3 FREQ log file.
Table 6 displays a summary of the information from this calculation and the "item" section below shows that the forces and displacements converged and that the calculation was completed.
| BH3 Frequency Analysis | |
|---|---|
| File Type | .log |
| Calculation Type | FREQ |
| Calculation Method | RB3LYP |
| Basis Set | 6-31G(d,p) |
| Final Energy E(RB3LYP) | -26.61532360 a.u. |
| RMS Gradient Norm | 0.00000360 a.u. |
| Dipole Moment | 0.00 Debye |
| Point Group | D3H |
| Job cpu time | 12.0 seconds |
| Table 6. BH3 Freq Gaussian Calculation Summary | |
         Item               Value     Threshold  Converged?
 Maximum Force            0.000007     0.000450     YES
 RMS     Force            0.000004     0.000300     YES
 Maximum Displacement     0.000028     0.001800     YES
 RMS     Displacement     0.000014     0.001200     YES
 Predicted change in Energy=-3.057368D-10
 Optimization completed.
    -- Stationary point found.
 GradGradGradGradGradGradGradGradGradGradGradGradGradGradGradGradGradGrad
The "low frequencies" are reported below and the first line shows the motions of the center of mass and are both, close to 0 and within the range of +/- 15 cm-1. There are also no negative frequencies reported in the second line of "low frequencies" which shows that the optimised energy is at a minimum point.
Low frequencies ---   -1.1800   -1.0028   -0.0054    4.1927   11.0182   11.0637
Low frequencies --- 1162.9912 1213.1792 1213.1819
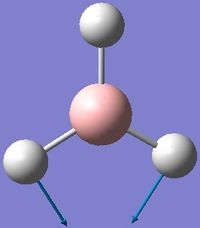
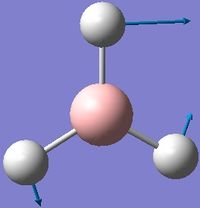
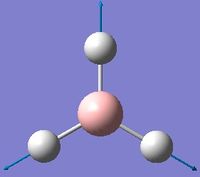
Table 7 reports and describes the 6 vibrational modes of the BH3 molecule.
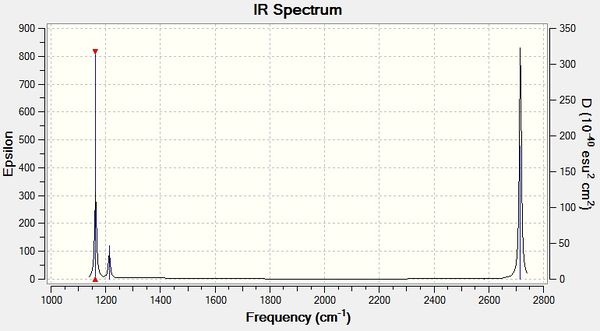
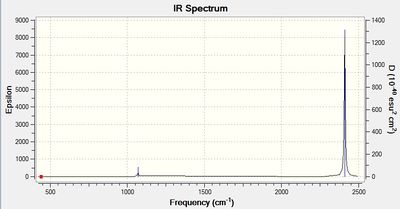
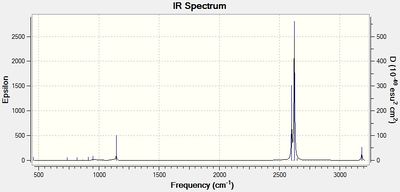
The simulated IR spectrum of BH3 is in Figure 1. This IR spectrum displays 3 peaks even though there are 6 vibrations. This is because the two E' pairs are each degenerate and so only one peak is seen at 1213 cm-1 and only one peak is seen at 2715 cm-1. The A1 peak at 2582 cm-1 is also not displayed on the IR graph because it has an intensity of 0. This is because the 3 B atoms move in and out in a concerted manner and therefore there is no change in dipole as it is cancelled out.
GaBr3 Frequency Analysis
The 6-31G(d,p) optimised GaBr3 molecule was used to compute a frequency for this molecule.
The D-Space link of this calculation is: DOI:10042/26102
Table 8 displays a summary of the information from this calculation and the "item" section below shows that the forces and displacements converged and that the calculation was completed.
| GaBr3 Frequency | |
|---|---|
| File Type | .log |
| Calculation Type | FREQ |
| Calculation Method | RB3LYP |
| Basis Set | LANL2DZ |
| Final Energy E(RB3LYP) | -41.70082783 a.u. |
| RMS Gradient Norm | 0.00000011 a.u. |
| Dipole Moment | 0.0 Debye |
| Point Group | D3H |
| Job cpu time | 25.3 seconds |
| Table 8. GaBr3 Freq Gaussian Calculation Summary | |
     Item               Value     Threshold  Converged?
 Maximum Force            0.000000     0.000450     YES
 RMS     Force            0.000000     0.000300     YES
 Maximum Displacement     0.000002     0.001800     YES
 RMS     Displacement     0.000001     0.001200     YES
 Predicted change in Energy=-6.142862D-13
 Optimization completed.
    -- Stationary point found.
 GradGradGradGradGradGradGradGradGradGradGradGradGradGradGradGradGradGrad
The "low frequencies" are reported below and the first line shows the motions of the centre of mass and are both, close to 0 and within the range of +/- 15 cm-1. There are also no negative frequencies reported in the second line of "low frequencies" which shows that the optimised energy is at a minimum point.
Low frequencies ---   -0.5252   -0.5247   -0.0024   -0.0010    0.0235    1.2010
Low frequencies ---   76.3744   76.3753   99.6982
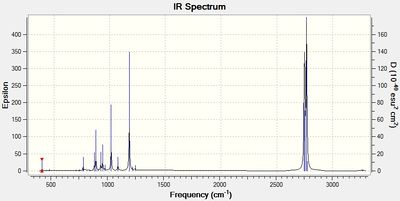
The IR spectrum for this molecule is displayed in Figure 2.
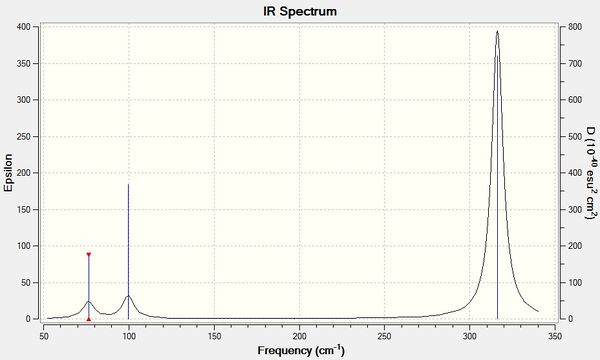
The lowest "real" normal mode is 76 cm-1
The vibrational frequencies of GaBr3 are reported in table 9.
| No. | Frequency (cm-1) | Intensity | Symmetry D3h point group |
|---|---|---|---|
| 1 | 76 | 3 | E' |
| 2 | 76 | 3 | E' |
| 3 | 99 | 9 | A2" |
| 4 | 197 | 0 | A1' |
| 5 | 316 | 57 | E' |
| 6 | 316 | 57 | E' |
| Table 9. GaBr3 Frequencies | |||
The vibrational frequencies of BH3 and GaBr3 are compared in table 10.
| Symmetry label D3h point group | BH3 | GaBr3 | ||
|---|---|---|---|---|
| Frequency (cm-1) | Intensity | Frequency (cm-1) | Intensity | |
| A2" - Bonds bending | 1162 | 92 | 99 | 9 |
| E' - Bonds bending | 1213 | 14 | 76 | 3 |
| E' - Bonds bending | 1213 | 14 | 76 | 3 |
| A1' - Bonds stretching | 2582 | 0 | 197 | 0 |
| E' - Bonds stretching | 2715 | 126 | 316 | 57 |
| E' - Bonds stretching | 2715 | 126 | 316 | 57 |
| Table 10. BH3 and GaBr3 Frequencies | ||||
Since both, BH3 and GaBr3 have 4 atoms, they both have 6 vibrational modes (using 3N-6). Additionally, both molecules belong to the same point group and also have the same symmetry labels. Overall, BH3 has larger frequencies compared to GaBr3 and this is because v= sqrt(k/μ) and so the frequency (v) is inversely proportional to the reduced mass (μ). The reduced mass of GaBr3 is larger than for BH3 and so this causes the frequency to be larger for BH3. Also, the frequency is proportional to the force constant (k) and stronger bonds have higher force constants. The B-H bond distance is smaller than for Ga-Br (as discussed above) and so it is expected that B-H will have a higher force constant and this will cause the frequency to be larger as well.
The two IR spectra appear similar with both spectra showing three peaks. However, there is a slight re-ordering of the modes as A2" is the lowest mode for BH3 but for GaBr3, E' is the lowest mode and A2" is the second lowest mode. This may be because the GaBr3 molecule has more polar Ga-Br bonds than the BH3 B-H bonds due to the larger electronegativity difference between Ga and Br. This means that the A2" bending motion for GaBr3 absorbs slightly more energy relatively to its E' bending motion and that the BH3 A2" bending motion absorbs slightly less energy than for its E' bend. The intensities of the BH3 vibrations are significantly larger than the intensities of the GaBr3 vibrations and this maybe because the change in dipole moment that happens during these vibrations are larger for BH3 than for GaBr3 (even though the bonds are Ga-Br bonds are more polar than the B-H bonds, its the change in dipole that influences the intensity.) This larger change in dipole moment for BH3 is because these atoms are lighter and so their vibrations show more intense peaks.
Also, both spectra have the A2" and E' peak at similar and lower frequencies and the A1' and E' peaks at similar and higher frequencies. This is because the A2" and E' peaks are due to bonds bending and the A1' and E' peaks are due to bonds stretching and more energy is required to stretch a bond than to bend a bond.
The same method and basis set must be used for both the optimisation and frequency analysis calculation because then the same optimised structure and the same total energy of the molecule will be used for the frequency analysis and so the data received is more accurate than if a different method or basis set is used. A frequency analysis is done to check that the best optimised structure has been found and that this structure is at a minimum on the potential energy graph. This can be checked because all the frequencies are positive and so that means that a minimum point has been located. Also, it is useful to visualise the vibrational modes and IR spectrum of the molecule which helps with understanding the bonding and structure of the compound. The "low frequencies" are the 6 frequencies from the 6 part of 3N-6 and relate to the motions of the centre of mass and should be very close ego 0 and all 6 should be in a range of approximately +/- 15 cm-1.
BH3 Molecular Orbitals
The MO's of BH3 were computed using the optimised BH3 molecule to run an energy method and adding the keywords "pop=full".
The D-Space link of this calculation is:DOI:10042/26105
| BH3 Energy | |
|---|---|
| File Type | .log |
| Calculation Type | Energy |
| Calculation Method | RB3LYP |
| Basis Set | LANL2DZ |
| Final Energy E(RB3LYP) | -41.70082783 a.u. |
| RMS Gradient Norm | 0.00000011 a.u. |
| Dipole Moment | 0.00 Debye |
| Point Group | D3H |
| Job cpu time | 25.3 seconds |
| Table 11. BH3 Energy Gaussian Calculation Summary | |
The MO diagram for BH3 has been drawn in Figure 3 and snapshots of the computed MO's have been added for comparison.
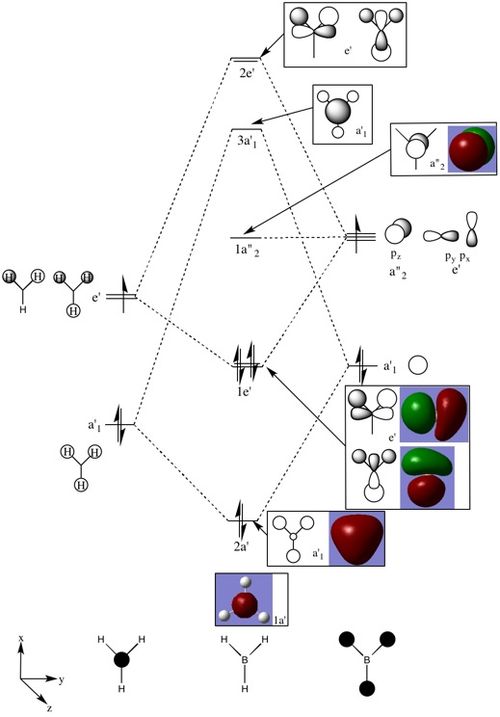
Overall, there are some differences between the real and LCAO MOs, however, the computed MOs are very useful to visualise an approximate representation of the real MOs. The differences are that some of the computed MOs, do not show the exact symmetry that are expected, this is seen with the e' molecular orbitals. Also, the computed MO's seem to be more spread out and bonding or antibonding areas of the MOs join up with adjacent bonding or antibonding areas to show one total bonding or antibonding area, this is particularly seen in e' as well. The 2e' and 3a'1 antibonding MOs are very similar in energy and without the use of the simulated MOs it would be very difficult to determine their order, however, Gaussian predicts these levels to be in the order as shown on Figure 3. This is an example of the usefulness of the simulated MOs. Taking into account that these MOs were computed in a very short amount of time and the level of accuracy is very good, qualitative MO theory is extremely useful to quickly explore and visualise the bonding that takes place in compounds. Qualitative MO theory can also be used in conjunction with quantitative MO theory to achieve the best understanding.
NBO Analysis
A molecule of NH3 was created and optimised using the B3LYP method with the 6-31G(d,p) basis set. The keywords "int=ultrafine scf=conver=9" was added.
The output log file is attached: NH3 6-31G(d,p) log file.
Table 12 displays a summary of the information from this calculation and the "item" section below shows that the forces and displacements converged and that the calculation was completed.
| NH3 6-31G(d,p) optimisation | |
|---|---|
| File Type | .log |
| Calculation Type | FOPT |
| Calculation Method | RB3LYP |
| Basis Set | 6-31G(d,p) |
| Final Energy E(RB3LYP) | -56.55776872 a.u. |
| RMS Gradient Norm | 0.00000095 a.u. |
| Dipole Moment | 1.85 Debye |
| Point Group | C1 |
| Job cpu time | 14.0 seconds |
| Table 12. NH3 6-21G Optimisation Gaussian Calculation Summary | |
Item               Value     Threshold  Converged?
 Maximum Force            0.000002     0.000015     YES
 RMS     Force            0.000001     0.000010     YES
 Maximum Displacement     0.000005     0.000060     YES
 RMS     Displacement     0.000003     0.000040     YES
 Predicted change in Energy=-9.687922D-12
 Optimization completed.
    -- Stationary point found.
                           ----------------------------
                           !   Optimized Parameters   !
                           ! (Angstroms and Degrees)  !
 --------------------------                            --------------------------
 ! Name  Definition              Value          Derivative Info.                !
 --------------------------------------------------------------------------------
 ! R1    R(1,2)                  1.018          -DE/DX =    0.0                 !
 ! R2    R(1,3)                  1.018          -DE/DX =    0.0                 !
 ! R3    R(1,4)                  1.018          -DE/DX =    0.0                 !
 ! A1    A(2,1,3)              105.7447         -DE/DX =    0.0                 !
 ! A2    A(2,1,4)              105.7444         -DE/DX =    0.0                 !
 ! A3    A(3,1,4)              105.7444         -DE/DX =    0.0                 !
 ! D1    D(2,1,4,3)           -111.8637         -DE/DX =    0.0                 !
 --------------------------------------------------------------------------------
 GradGradGradGradGradGradGradGradGradGradGradGradGradGradGradGradGradGrad
A frequency analysis was then computed on this optimised molecule and the output log file is attached: NH3 6-31G(d,p) frequency log file.
Table 13 displays a summary of the information from this calculation and the "item" section below shows that the forces and displacements converged and that the calculation was completed.
| NH3 6-31G(d,p) optimisation | |
|---|---|
| File Type | .log |
| Calculation Type | FREQ |
| Calculation Method | RB3LYP |
| Basis Set | 6-31G(d,p) |
| Final Energy E(RB3LYP) | -56.55776872 a.u. |
| RMS Gradient Norm | 0.00000081 a.u. |
| Dipole Moment | 1.85 Debye |
| Point Group | C1 |
| Job cpu time | 7.0 seconds |
| Table 13. NH3 6-21G Frequency Gaussian Calculation Summary | |
tem               Value     Threshold  Converged?
 Maximum Force            0.000002     0.000450     YES
 RMS     Force            0.000001     0.000300     YES
 Maximum Displacement     0.000005     0.001800     YES
 RMS     Displacement     0.000003     0.001200     YES
 Predicted change in Energy=-8.974384D-12
 Optimization completed.
    -- Stationary point found.
 GradGradGradGradGradGradGradGradGradGradGradGradGradGradGradGradGradGrad
The "low frequencies" are reported below and the first line shows the motions of the centre of mass and are both, close to 0 and within the range of +/- 15 cm-1. There are also no negative frequencies reported in the second line of "low frequencies" which shows that the optimised energy is at a minimum point.
Low frequencies ---   -6.8436   -5.1182   -1.4081    0.0002    0.0009    0.0012
Low frequencies --- 1089.3464 1693.9250 1693.9291
The optimised NH3 molecule was then used to compute the MOs of this molecule by running an energy method and adding the keyword "pop=full".
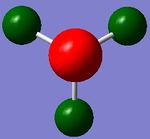
The output log file for this calculation is attached: NH3 6-31G(d,p) energy log file.
Image 1 displays the charge distribution on the NH3 molecule. The charge range is -1.125 to 1.125. The specific NBO charges for the N and H atoms are shown in table 14.
| Atom | NBO charge |
|---|---|
| N | -1.125 |
| H | 0.375 |
| Table 14. | |
Association Energy
A molecule of NH3BH3 was optimised using the B3LYP method with the 6-31G(d,p) basis set. The keywords "int=ultrafine scf=conver=9" was added.
The output log file is attached: NH3BH3 optimisation log file.
Table 15 displays a summary of the information from this calculation and the "item" section below shows that the forces and displacements converged and that the calculation was completed.
| NH3BH3 6-31G(d,p) optimisation | |
|---|---|
| File Type | .log |
| Calculation Type | FOPT |
| Calculation Method | RB3LYP |
| Basis Set | 6-31G(d,p) |
| Final Energy E(RB3LYP) | -83.22468911 a.u. |
| RMS Gradient Norm | 0.00000125 a.u. |
| Dipole Moment | 5.56 Debye |
| Point Group | C1 |
| Job cpu time | 1 minute 4.0 seconds |
| Table 15. NH3BH3 6-21G Optimisation Gaussian Calculation Summary | |
Item               Value     Threshold  Converged?
 Maximum Force            0.000002     0.000015     YES
 RMS     Force            0.000001     0.000010     YES
 Maximum Displacement     0.000023     0.000060     YES
 RMS     Displacement     0.000010     0.000040     YES
 Predicted change in Energy=-8.987776D-11
 Optimization completed.
    -- Stationary point found.
                           ----------------------------
                           !   Optimized Parameters   !
                           ! (Angstroms and Degrees)  !
 --------------------------                            --------------------------
 ! Name  Definition              Value          Derivative Info.                !
 --------------------------------------------------------------------------------
 ! R1    R(1,7)                  1.2098         -DE/DX =    0.0                 !
 ! R2    R(2,7)                  1.2098         -DE/DX =    0.0                 !
 ! R3    R(3,7)                  1.2098         -DE/DX =    0.0                 !
 ! R4    R(4,8)                  1.0185         -DE/DX =    0.0                 !
 ! R5    R(5,8)                  1.0185         -DE/DX =    0.0                 !
 ! R6    R(6,8)                  1.0185         -DE/DX =    0.0                 !
 ! R7    R(7,8)                  1.6677         -DE/DX =    0.0                 !
 ! A1    A(1,7,2)              113.874          -DE/DX =    0.0                 !
 ! A2    A(1,7,3)              113.874          -DE/DX =    0.0                 !
 ! A3    A(1,7,8)              104.5972         -DE/DX =    0.0                 !
 ! A4    A(2,7,3)              113.874          -DE/DX =    0.0                 !
 ! A5    A(2,7,8)              104.5973         -DE/DX =    0.0                 !
 ! A6    A(3,7,8)              104.5973         -DE/DX =    0.0                 !
 ! A7    A(4,8,5)              107.8749         -DE/DX =    0.0                 !
 ! A8    A(4,8,6)              107.8749         -DE/DX =    0.0                 !
 ! A9    A(4,8,7)              111.0237         -DE/DX =    0.0                 !
 ! A10   A(5,8,6)              107.8748         -DE/DX =    0.0                 !
 ! A11   A(5,8,7)              111.0241         -DE/DX =    0.0                 !
 ! A12   A(6,8,7)              111.0241         -DE/DX =    0.0                 !
 ! D1    D(1,7,8,4)            179.9999         -DE/DX =    0.0                 !
 ! D2    D(1,7,8,5)            -60.0002         -DE/DX =    0.0                 !
 ! D3    D(1,7,8,6)             59.9999         -DE/DX =    0.0                 !
 ! D4    D(2,7,8,4)            -60.0001         -DE/DX =    0.0                 !
 ! D5    D(2,7,8,5)             59.9999         -DE/DX =    0.0                 !
 ! D6    D(2,7,8,6)            179.9999         -DE/DX =    0.0                 !
 ! D7    D(3,7,8,4)             59.9999         -DE/DX =    0.0                 !
 ! D8    D(3,7,8,5)            179.9999         -DE/DX =    0.0                 !
 ! D9    D(3,7,8,6)            -60.0001         -DE/DX =    0.0                 !
 --------------------------------------------------------------------------------
 GradGradGradGradGradGradGradGradGradGradGradGradGradGradGradGradGradGrad
A frequency analysis was then computed on this optimised molecule and the output log file is attached: NH3BH3 frequency log file.
Table 16 displays a summary of the information from this calculation and the "item" section below shows that the forces and displacements converged and that the calculation was completed.
| NH3BH3 6-31G(d,p) frequency | |
|---|---|
| File Type | .log |
| Calculation Type | FREQ |
| Calculation Method | RB3LYP |
| Basis Set | 6-31G(d,p) |
| Final Energy E(RB3LYP) | -83.22468911 a.u. |
| RMS Gradient Norm | 0.00000131 a.u. |
| Dipole Moment | 5.56 Debye |
| Point Group | C1 |
| Job cpu time | 32.0 seconds |
| Table 16. NH3BH3 6-21G frequency Gaussian Calculation Summary | |
The "low frequencies" are reported below and the first line shows the motions of the centre of mass and are both, close to 0 and within the range of +/- 15 cm-1. There are also no negative frequencies reported in the second line of "low frequencies" which shows that the optimised energy is at a minimum point.
Low frequencies ---   -3.3278   -2.6838   -0.0010   -0.0007    0.0014    3.6735
Low frequencies ---  263.3392  632.9604  638.4420
The association energy is calculate below:
E(NH3)= -56.55776872 a.u. E(BH3)= -26.61532360 a.u. E(NH3BH3)= -83.22468911 a.u.
ΔE=E(NH3BH3)-[E(NH3)+E(BH3)]
ΔE= -83.22468911 - [-56.55776872 + -26.61532360]
ΔE= -0.05159679 a.u.
ΔE= - 135.5 kJmol-1
So, from this calculation it can be seen that NH3BH3 is more energetically stable than when the two molecule are separate. This extra stability may be because the N is able to donate its lone pair to the empty pz orbital on B which gives the compound more stability.[2] The dissociation energy calculated seems sensible because the bond energy calculated is in the right ballpark of what bond energies are.
Mini Project - Borane & Carborane Clusters
One borane cluster ([B6H6]2-) and 3 carborane clusters ([CB5H6]-, cis-[C2B4H6] and trans-[C2B4H6]) are compared in this project and analysed in terms of their structure, stability and electronic properties. These compounds have interesting applications in noninvasive theraputic treatments of malignant tumors such as Boron Neutron capture therapy (BNCT).[3] Firstly, it was explored whether the structures that are predicted using Wade's rules, also known as the polyhedral skeletal electron pair theory, are in agreement with the structures that Gaussian would display when the compounds are energetically optimised. All four compounds are predicted to be close octahedron structures and all four are isoelectronic with 26 valance electrons. Also, as a C-H unit is swapped for a B-H unit, it is hypothesised that the IR spectrums will display increasing numbers of peaks due to the more vibrational modes that would exhibit a dipole change. Lastly, the MOs of the four compounds are compared and discussed to see which similarities and difference exist - it is hypothesised that the compound with the most carbons will have the lowest HOMO because C is more electronegative than B. It is also interesting to compare the cis and trans compounds and to see if one is more stable than the other and similarly it is expected that the trans isomer will have less IR peaks because this cluster has more symmetry.
Optimisation
[B6H6]2- 3-21G Optimisation
Using Wade's Rules and Gaussview, a [B6H6]2- molecule was drawn with all the lengths of the B-B bonds set as 1.7 A and the lengths of the B-H bond distances set as 1.5 A. This molecule was then optimised using the B3LYP method with the 3-21G basis set and the keywords "int=ultrafine scf=conver=9" and "nosymm" added.
The D-Space link to this calculation is: DOI:10042/26436
Table 17 displays a summary of the information from this calculation and the "item" section below shows that the forces and displacements converged again and that the calculation was completed.
| [B6H6]2- 3-21G optimisation | |
|---|---|
| File Type | .log |
| Calculation Type | FOPT |
| Calculation Method | RB3LYP |
| Basis Set | 3-21G |
| Charge | -2 |
| Final Energy E(RB3LYP) | - -151.80031938 a.u. |
| RMS Gradient Norm | 0.00000261 a.u. |
| Dipole Moment | 16.82 Debye |
| Point Group | C1 |
| Job cpu time | 3 min 4.0 seconds |
| Table 17. 3-21G Gaussian Calculation Summary | |
 Item               Value     Threshold  Converged?
 Maximum Force            0.000003     0.000015     YES
 RMS     Force            0.000001     0.000010     YES
 Maximum Displacement     0.000039     0.000060     YES
 RMS     Displacement     0.000010     0.000040     YES
 Predicted change in Energy=-2.517448D-10
 Optimization completed.
    -- Stationary point found.
The optimised 3-21G [B6H6]2- was then further optimised using 6-31G(d,p) basis set and then changed to [CB5H6]-, cis-[C2B4H6] and trans-[C2B4H6] . Table 18 displays a summary of the information from these calculation.
| [B6H6]2- | [CB5H6]- | cis-[C2B4H6] | trans-[C2B4H6] | |||||||||||||
|---|---|---|---|---|---|---|---|---|---|---|---|---|---|---|---|---|
|
|
|
| |||||||||||||
| File Type | .log | .log | .log | .log | ||||||||||||
| Calculation Type | FOPT | FOPT | FOPT | FOPT | ||||||||||||
| Calculation Method | RB3LYP | RB3LYP | RB3LYP | RB3LYP | ||||||||||||
| Basis Set | 6-31G(d,p) | 6-31G(d,p) | 6-31G(d,p) | 6-31G(d,p) | ||||||||||||
| Charge | -2 | -1 | 0 | 0 | ||||||||||||
| Final Energy E(RB3LYP) | -152.65765475 a.u. | -166.05969569 a.u. | -179.23892354 a.u. | -179.25278908 a.u. | ||||||||||||
| RMS Gradient Norm | 0.00000283 a.u. | 0.00000067 a.u. | 0.00000259 a.u. | 0.00000093 a.u. | ||||||||||||
| Dipole Moment | 16.82 Debye | 7.54 Debye | 2.28 Debye | 0.0 Debye | ||||||||||||
| Point Group | C1 | C1 | C1 | C1 | ||||||||||||
| Job cpu time | 1 min 28.0 seconds | 3 min 34.0 seconds | 4 min 28.0 seconds | 4 min 32.0 seconds | ||||||||||||
| D-space link | DOI:10042/26437 | DOI:10042/26407 | DOI:10042/26404 | DOI:10042/26401 | ||||||||||||
| Table 18. 6-31G(d,p) Gaussian Calculation Summary | ||||||||||||||||
The RMS gradient of each molecule is very close to 0 which shows that the optimisation has found the lowest energy configuration of this molecule.
The "item" sections below in table 19 shows that the forces and displacements converged for each of the 4 compounds and this section shows that Gaussian finished the job properly for all 4 compounds.
| [B6H6]2- | Item Value Threshold Converged?
Maximum Force 0.000006 0.000015 YES
RMS Force 0.000001 0.000010 YES
Maximum Displacement 0.000031 0.000060 YES
RMS Displacement 0.000008 0.000040 YES
Predicted change in Energy=-5.037528D-10
Optimization completed.
-- Stationary point found.
| ||
|---|---|---|---|
| [CB5H6]- | Item Value Threshold Converged?
Maximum Force 0.000001 0.000015 YES
RMS Force 0.000000 0.000010 YES
Maximum Displacement 0.000003 0.000060 YES
RMS Displacement 0.000000 0.000040 YES
Predicted change in Energy=-6.213739D-12
Optimization completed.
-- Stationary point found.
| ||
| cis-[C2B4H6] | Item Value Threshold Converged?
Maximum Force 0.000002 0.000015 YES
RMS Force 0.000001 0.000010 YES
Maximum Displacement 0.000048 0.000060 YES
RMS Displacement 0.000011 0.000040 YES
Predicted change in Energy=-5.656658D-10
Optimization completed.
-- Stationary point found.
| ||
| trans-[C2B4H6] | Item Value Threshold Converged?
Maximum Force 0.000001 0.000015 YES
RMS Force 0.000000 0.000010 YES
Maximum Displacement 0.000025 0.000060 YES
RMS Displacement 0.000006 0.000040 YES
Predicted change in Energy=-7.196371D-11
Optimization completed.
-- Stationary point found.
| ||
| Table 20. Item sections | |||
Compounds with different atoms or optimisations with different basis sets or methods can not be compared to each other. However, the cis and trans isomers have the same number and types of atoms and therefore can be compared. The final energies of these copings are very similar but the trans isomer has a lower energy of 0.013855 hartree or 8.7 kJ/mol. This may be because the cis isomer causes the octahedral geometry to distort and this is slightly energetically unfavourable while the trans isomer maintains the octahedral geometry much better.
It was noted that the optimised [B6H6]2- molecule was showing a large dipole moment of 16.82 Debye. This is not expected at all since this molecule is a member of the Oh point group and there are only B-H units at each vertex and therefore there should be a dipole moment of 0 Debye. Therefore, the optimisation was run again and this time the symmetry of the molecule was restricted to Oh. The D-space link for this calculation is: DOI:10042/26439 . Table 21 shows the summary of this calculation and this time the dipole moment was recorded as 0 Debye. It may be the case that when the symmetry was not restricted, the bond lengths of this compound were ever so not equal and this was enough to cause a large dipole in the compound. Similarly this may be the case with the other 3 molecules. The "item" section of the calculation is included below.
| [B6H6]2- 3-21G optimisation | |
|---|---|
| File Type | .log |
| Calculation Type | FOPT |
| Calculation Method | RB3LYP |
| Basis Set | 6-31G(d,p) |
| Charge | -2 |
| Final Energy E(RB3LYP) | -152.65765752 a.u. |
| RMS Gradient Norm | 0.00000850 a.u. |
| Dipole Moment | 0.0 Debye |
| Point Group | Oh |
| Job cpu time | 26.0 seconds |
| Table 21. B6H6 symmetry Oh 6-31G(d,p) Gaussian Calculation Summary | |
Item               Value     Threshold  Converged?
 Maximum Force            0.000006     0.000015     YES
 RMS     Force            0.000002     0.000010     YES
 Maximum Displacement     0.000027     0.000060     YES
 RMS     Displacement     0.000007     0.000040     YES
 Predicted change in Energy=-1.527214D-09
 Optimization completed.
    -- Stationary point found.
All the B-B bond distances in [B6H6]2- was computed to be 1.74 A and all the B-H bond distances 1.22 A. This is interesting because the B-H bond distance in BH3 was reported as 1.19 A above. The main reason for this difference is because the B in BH3 is bonding to 3 H atoms while a B in [B6H6]2- is bonding to more than 3 atoms. The effect of this is that there are more atoms competing for electron density from the B and so the B atom is able to share less electron density with its terminal H. This results in a longer B-H bond distance. Further discussion regarding the bonding of [B6H6]2- can be found below in the MO analysis section. Since, [B6H6]2- adopts the geometry of a perfect octahedron, the B-B-B bond angles were computed to be 90.0o and 60.0o and the H-B-B bond angles are all 135.0o.
When analysing the B-B bond distance in [CB5H6]-, the bond distances are shorter than for [B6H6]2-. Four of the B-B bonds are 1.72 A and the B-B bond distances where one of the Bs is trans to the C is 1.73 A. All the C-B bonds are 1.63 A. All these measurement are expected because the C has a fourth valance electron and so can use this extra electron density to form stronger and shorter bonds to its adjacent borons. The B-H bond distances have remained the same at 1.19 A , however, the C-H bond distance was recorded as 1.08 A and this is due to the same reason that the C can afford to share slightly more electron density with its terminal H. Due to the addition of a carbene, this compound no longer adopts the geometry of a perfect octahedron and therefore exhibts bond angles that are slightly different to the bond angles for [B6H6]2-.
For the cis-[C2B4H6] compound, the same trend is observed. The B-B and C-B bond distances are slightly shorter than those recorded for [CB5H6]- and this is due to the same reason as explained for [CB5H6]-. The trans-[C2B4H6] compound has very similar bond distances to its cis isomer and as expected it shows a B-B-B bond angle of 90 around its equatorial borons (when the two carbenes are at the radial positions).
Frequency Analysis
A frequency analysis was conducted on all 4 molecules using their 6-31G(d,p) optimised compounds. Table 22 displays a summary of the information from this caculation.
| [B6H6]2- | [CB5H6]- | cis-[C2B4H6] | trans-[C2B4H6] | |
|---|---|---|---|---|
| File Type | .log | .log | .log | .log |
| Calculation Type | FREQ | FREQ | FREQ | FREQ |
| Calculation Method | RB3LYP | RB3LYP | RB3LYP | RB3LYP |
| Basis Set | 6-31G(d,p) | 6-31G(d,p) | 6-31G(d,p) | 6-31G(d,p) |
| Charge | -2 | -1 | 0 | 0 |
| Final Energy E(RB3LYP) | -152.65765475 a.u. | -166.05969569 a.u. | -179.23892354 a.u. | -179.25278908 a.u. |
| RMS Gradient Norm | 0.00000282 a.u. | 0.00000070 a.u. | 0.00000258 a.u. | 0.00000100 a.u. |
| Dipole Moment | 16.82 Debye | 7.54 Debye | 2.28 Debye | 0.00 Debye |
| Point Group | C1 | C1 | C1 | C1 |
| Job cpu time | 3 min 21.0 seconds | 3 min 28.0 seconds | 3 min 22.0 seconds | 3 min 23.0 seconds |
| D-space link | DOI:10042/26438 | DOI:10042/26406 | DOI:10042/26403 | DOI:10042/26399 |
| Table 22. Freq Gaussian Calculation Summary | ||||
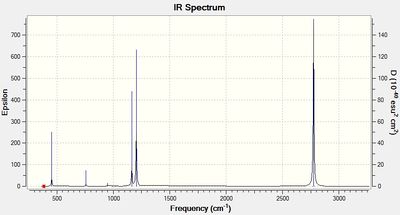
The "low frequencies" are reported in table 23 and the first lines of each molecule show the motions of the centre of mass and are both, close to 0 and within the range of +/- 15 cm-1. There are also no negative frequencies reported in the second line of "low frequencies" which shows that the optimised energy for all 4 molecules are at a minimum point. The IR spectra are also included in table 23.
The point groups of these four compounds are listed below:
B6H6]2- is Oh
[CB5H6]- is C4v
cis-[C2B4H6] is Cs
trans-[C2B4H6] is D4h
Each of the 4 compounds have 12 atoms and therefore they each exhibit 30 vibrational modes. However, some are degenerate and some have 0 intensity and therefore there are less than 30 peaks on each spectrum. The [B6H6]2-spectrum shows just 2 peaks, the [CB5H6]- shows 9 peaks, the cis-[C2B4H6] spectrum shows 15 peaks and the trans-[C2B4H6] spectrum shows 6 peaks. Several of the peaks mentioned have weak intensities and therefore may not be seen easily on the spectra. So as each carbene is added, the number of peaks on the spectra increases. The interesting exception is the trans-[C2B4H6], however, this can be explained since the molecule is trans, some of the dipole moments that are experienced during certain vibrations will be cancelled out and therefore it is expected that this trans molecule would have less peaks than the cis molecule or even less than [CB5H6]-. This can also be seen because the point group of the trans isomer has more symmetry than the point group of the cis isomer.
The reason why the general trend is that there are more peaks as the number of added carbenes are increased is because the amount of symmetry is decreasing and therefore there will be more vibrational modes which have a net dipole moment - this can also be seen from their point group assignment where there is less symmetry as the number of carbenes increase. Also, the lowest peaks are seen to have lower and lower frequencies each time a carbene is added and this is because of v=sqrt(k/μ). Each time a carbene is added, the reduced mass increases and v is inversely proportional to μ and so the frequency is expected to drop. Additionally, the intensity of the strongest peak decreases significantly each time a carbene is swapped for a B-H unit and this is because the change in dipole decreases which is caused by the slightly heavier C atoms. All four spectrums have some peaks at the 1000 cm-1 region, then the spectra appear peak-less till around the 2000-1 region. The explanation for this is that more energy is required for stretching vibrations than for bending vibrations and the peaks at around 1000 cm-1 are due to bending vibrations and the peaks at around 2000-1 are due to stretching vibrations.
MO Analysis
To compute the [B6H6]2- MOs, the optimised 6-31G(d,p) structures was computed with the type set to Energy and the keywords "pop=full" and "int=ultrafine scf=conver=9" added. However, the Gaussian calculation was returned with an error as displayed below. This error may be due to the very high level of symmetry that [B6H6]2- has and since the HOMO of this molecule has a triplet state, Gaussian was not able to find the solution to the Schrodinger equation for some of the orbitals. The log file for this calculation is:[B6H6]2- Energy log file.
           --- Apparent excited state configuration ---
 The following "inverted" NBO labels reflect the actual hybrid overlap:

                 NBO 117 has been relabelled BD

 Unable to label the NBOs properly:  20 unstarred orbitals
                                     19 occupied orbitals
 Error
 Error termination via Lnk1e in C:\G09W\l607.exe at Mon Nov 18 15:05:39 2013.
 Job cpu time:       0 days  0 hours  0 minutes 22.0 seconds.
 File lengths (MBytes):  RWF=      8 Int=      0 D2E=      0 Chk=      1 Scr=
Therefore, the calculation was run again nut this time using "Restricted-Open" spin. This calculation successfully produced the MOs of this molecule and it is these MOs that are used in the MO diagrams below. However, this calculation resulted in a very high amount of total non-lewis (57.28 %) and therefore an NBO analysis for this compound has been ommited in this project. The log file for this calculation has been attached:[B6H6]2- Energy Restricted Open log file. This high level of total non-lewis is displayed below.
--------------------------------------------------------
   Core                      5.99520 ( 49.960% of  12)
   Valence Lewis             2.12162 ( 30.309% of   7)
  ==================       ============================
   Total Lewis               8.11682 ( 42.720% of  19)
  -----------------------------------------------------
   Valence non-Lewis        10.86451 ( 57.182% of  19)
   Rydberg non-Lewis         0.01866 (  0.098% of  19)
  ==================       ============================
   Total non-Lewis          10.88318 ( 57.280% of  19)
 --------------------------------------------------------
So, the calculation was repeated as an energy calculation with a triplet restricted open state. However,an error occurred as displayed below. The log file for this calculation is attached: [B6H6]2- Energy triplet restricted open state log file.
>>>>>>>>>> Convergence criterion not met.
 SCF Done:  E(ROB3LYP) =  -152.421169671     A.U. after  129 cycles
            NFock=128  Conv=0.13D-02     -V/T= 2.0062
 <Sx>= 0.0000 <Sy>= 0.0000 <Sz>= 1.0000 <S**2>= 2.0000 S= 1.0000
 <L.S>= 0.000000000000E+00
 Annihilation of the first spin contaminant:
 S**2 before annihilation     2.0000,   after     2.0000
 Convergence failure -- run terminated.
 Error termination via Lnk1e in C:\G09W\l502.exe at Thu Nov 21 14:20:54 2013.
 Job cpu time:       0 days  0 hours  2 minutes 50.0 seconds.
 File lengths (MBytes):  RWF=      8 Int=      0 D2E=      0 Chk=      1 Scr=      1
The calculation was run again, this time as an optimisation with a triplet unrestriced spin which calculated a much better and more reasonable amount of non lewis (only 7.61 %) as displayed below. The log file for this calculation is attached:[B6H6]2- Energy triplet unrestricted log file.
 --------------------------------------------------------
   Core                      5.99520 ( 99.920% of   6)
   Valence Lewis            12.48284 ( 89.163% of  14)
  ==================       ============================
   Total Lewis              18.47804 ( 92.390% of  20)
  -----------------------------------------------------
   Valence non-Lewis         1.46536 (  7.327% of  20)
   Rydberg non-Lewis         0.05661 (  0.283% of  20)
  ==================       ============================
   Total non-Lewis           1.52196 (  7.610% of  20)
 --------------------------------------------------------
The calculation was run once more, this time as an optimisation with a singlet unrestriced spin which ended with an error as displayed below. The log file for this calculation is attached: [B6H6]2- Energy singlet unrestricted spin log file.
 --- Apparent excited state configuration ---
 The following "inverted" NBO labels reflect the actual hybrid overlap:

                 NBO 117 has been relabelled BD

 Unable to label the NBOs properly:  20 unstarred orbitals
                                     19 occupied orbitals
 Error
 Error termination via Lnk1e in C:\G09W\l607.exe at Thu Nov 21 15:10:34 2013.
 Job cpu time:       0 days  0 hours  0 minutes 37.0 seconds.
 File lengths (MBytes):  RWF=     12 Int=      0 D2E=      0 Chk=      3 Scr=      1
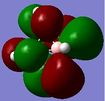
In [B6H6]2-, the s and pz orbitals hybridise to form two sp hybrids.[4] One of these hybrids are used to bond with the H 1s orbital. The other sp hybrid points towards the centre of the [B6H6]2- cluster. The remaining px and py orbitals are called tangental orbitals and are unhybridised. So, besides for the B sp orbital that is used to bond with the terminal H, each B has 3 orbitals that is used in the B6 cluster bonding. So when the 6 B-H units come together, a total of 18 atomic orbitals can combine to form 18 MOs. The 18 MOs are displayed figure 4 and the MOs have been combined using the 6 radial sp orbital with the 12 tangental px and py orbitals. 14 electrons are included in this MO diagram because from the 26 valance electrons this compound has, 12 are used in the B-H units. The computed MOs for the occupied levels and LUMO level are included in figure 4.

Some of the computed MOs show better similarity with the real MOs than others. But in general, the computed MOs are quite accurate and show the bonding and anti bonding areas of each orbital well. It is interesting to note that some of the MOs such as the 2tg orbitals, look like d orbitals.
Table 24 displays all the computed occupied MOs of this compound as well as the LUMO level.
| [B6H6]2- MOs | ||
| MO level | Energy (hartree) | MO diagram |
|---|---|---|
| 20-22 LUMO | 0.46037 | 
|
| 17-19 HOMO | 0.16377 | 
|
| 14-16 | 0.08872 | 
|
| 12-13 | -0.00404 | 
|
| 11 | -0.02657 | 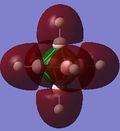
|
| 8-10 | -0.08046 | 
|
| 7 | -0.31228 | 
|
| 5-6 | -6.31403 | 
|
| 2-4 | -6.31436 | 
|
| 1 | -6.31499 | 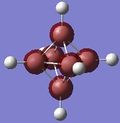
|
| Table 24 DOI:10042/26400 | ||
The energy gap between the HOMO and LUMO level is 0.2966 hartree or 186.12 kJ/mol and this is quite large and explains the large stability that [B6H6]2- has. On figure 4, there are no MOs between the occupied a1g and the 1t1u energy level, however, table 24 hows a doubly degenerate energy level (MOs 12 and 13) that are situated between these two MOs. These two MO correspond to MOs of the B-H units that are omitted on figure 4 as figure 4 only focuses on the B6 MOs. This can also be seen from the semi transparent MOs that MOs 12 and 13 have - there seems to be a high concentration of electron density around the B-H units and a lack of this density between the B6 clusters. Energy level 7 looks like the all symmetrical bonding MO and energy level 11 seems to be the corresponding anti bonding MO.
The HOMO and LUMO MOs for the three carborane clusters are displayed in tables 25, 26 and 27.
|
|
| |||||||||||||||||||||||||||||||||||||||||||||
The energy levels of the MOs can not be directly compared because they have different atoms but it is worth noting that the HOMO level between the four compounds decrease as a carbene is added and this may be because C is more electronegative than B and so this lowers the energy levels of the carborane clusters. Also, form pictures of they MOs, it is clearly visible that the shape of the carborane MOs are slight distorted where the C atoms are - they are in fact smaller on the HOMO/LUMO pictures. This is because C is more electronegative than B and so C has a smaller anti bonding contribution and this is represented by the smaller orbital shapes.
NBO Analysis
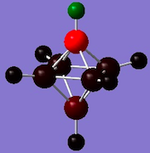
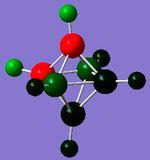
The charge distribution of the four compounds are displayed in table 28.
| [B6H6]2- | [CB5H6]- | cis-[C2B4H6] | trans-[C2B4H6] | |
|---|---|---|---|---|
| Diagram | 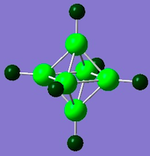
|
|
|

|
| Charge range | -2.364 to 2.364 | -0.719 to 0.719 | -0.530 to 0.530 | -0.670 to 0.670 |
| Table 28. Charge Distribution | ||||
The NBO charges are displayed in table 29.
| [B6H6]2- | [CB5H6]- | cis-[C2B4H6] | trans-[C2B4H6] | |
|---|---|---|---|---|
| B | All 2.364 | 4 at 0.065 and 1 at -0.199 | 2 at 0.147 and 2 at 0.016 | All at 0.148 |
| H | All 0.469 | 4 at -0.016, 1 at -0.012 (B-H) and 1 at 0.253 (C-H) | 2 at 0.033, 2 at 0.029 and 2 at 0.304 (C-H) | All at 0.035 |
| C | - | 1 at -0.719 | 2 at -0.530 | 2 at -0.670 |
| Table 29. Charge Distribution | ||||
The diagrams and charge density values show that for the carboranes, the C's take a large amount of the electron density. From [B6H6]2-, it can be seen that the H are more electronegative than the B and from the carboranes it can be seen that the C is more electronegative than the B and H which is all expected.
The text below is an extract from the [CB5H6]- energy log file.
Occupancy)   Bond orbital/ Coefficients/ Hybrids
 ---------------------------------------------------------------------------------
     1. (1.98466) BD ( 1) H   1 - B   8
                ( 50.42%)   0.7101* H   1 s( 99.97%)p 0.00(  0.03%)
                                            0.9998  0.0029  0.0125  0.0124  0.0016
                ( 49.58%)   0.7041* B   8 s( 33.01%)p 2.03( 66.97%)d 0.00(  0.03%)
                                           -0.0009  0.5729  0.0435 -0.0001 -0.5737
                                            0.0034 -0.5830  0.0034  0.0247  0.0001
                                            0.0136  0.0009  0.0009  0.0000 -0.0080
     2. (1.98467) BD ( 1) H   2 - B   7
                ( 50.42%)   0.7101* H   2 s( 99.97%)p 0.00(  0.03%)
                                            0.9998  0.0029 -0.0124  0.0127 -0.0002
                ( 49.58%)   0.7041* B   7 s( 33.01%)p 2.03( 66.97%)d 0.00(  0.03%)
                                           -0.0009  0.5729  0.0435 -0.0001  0.5518
                                           -0.0033 -0.5949  0.0035  0.1065 -0.0004
                                           -0.0136  0.0011 -0.0011 -0.0006 -0.0080
     3. (1.98466) BD ( 1) H   3 - B   5
                ( 50.42%)   0.7101* H   3 s( 99.97%)p 0.00(  0.03%)
                                            0.9998  0.0029 -0.0123 -0.0117 -0.0051
                ( 49.58%)   0.7041* B   5 s( 33.01%)p 2.03( 66.97%)d 0.00(  0.03%)
                                           -0.0009  0.5729  0.0435 -0.0001  0.5472
                                           -0.0033  0.5113 -0.0031  0.3298 -0.0017
                                            0.0121  0.0063  0.0060  0.0006 -0.0054
     4. (1.98869) BD ( 1) H   4 - B   6
                ( 50.26%)   0.7090* H   4 s( 99.97%)p 0.00(  0.03%)
                                            0.9998  0.0029  0.0126 -0.0120 -0.0033
                ( 49.74%)   0.7053* B   6 s( 29.60%)p 2.38( 70.37%)d 0.00(  0.03%)
                                           -0.0007  0.5423  0.0444 -0.0003 -0.5966
                                            0.0052  0.5576 -0.0038  0.1917 -0.0055
                                           -0.0115 -0.0065  0.0064  0.0015 -0.0062
     5. (1.65725) BD ( 1) B   5 - C  12
                ( 32.48%)   0.5700* B   5 s( 14.84%)p 5.72( 84.96%)d 0.01(  0.19%)
                                           -0.0033  0.3850 -0.0130  0.0025 -0.3792
                                            0.0150 -0.4710  0.0075  0.6928  0.0606
                                            0.0213 -0.0250 -0.0248 -0.0034 -0.0144
                ( 67.52%)   0.8217* C  12 s( 30.41%)p 2.29( 69.56%)d 0.00(  0.04%)
                                           -0.0008  0.5510  0.0226  0.0008  0.3676
                                            0.0021  0.7140  0.0000 -0.2144  0.0687
                                            0.0022 -0.0086 -0.0163 -0.0026 -0.0006
This shows that in the B-H bond, 50.42% of the bond is contributed from the H and 49.58% of the bond is contributed from the B. The contribution of the bond from the H atom is almost 100% from the s orbital and the contribution of the B to the bond is 33% s and 67% p. This is in line with what was discussed earlier regarding the sp hybridised B orbitals bonding with the s H orbital. Similarly, the B-C bond has a 32.48 % contribution from the B atom and a 67.52% contribution from the C. The B in this bond have 15% s character and 85% p character while the C in this bond has 30% s character and 70% p character. This is interesting as earlier it was suggested that the B in this bond would be 100% p character. So it seems that these tangental p orbitals of B also hybridise to a small extent in order to achieve a better overall with C. It is also interesting to note that the NBO analysis that Gaussian performs treats the complex in a way like the Valance Bond theory describes bonding and not like the MO theory as has been used in the MO section of this report.
Conclusion
This project has confirmed that the Wade rules predicted close structures are in agreement with the computed minimum energy structures. Similarly, the IR spectras have confirmed that there are more peaks as the symmetry is reduced and more carbenes are added. The MOs computed have also shown to be very similar to the real MOs. However, there was significant difficulty in being able to compute the MOs for [B6H6]2- due to its high level of symmetry. The MO analysis also showed that the B-H orbitals are in reality spread out through the B6 MO cluster and that as hypothesised, as carbenes are added the HOMO is expected to become lower in energy. The NBO analysis also revealed that the p orbital of B has some hybridisation when bonding to a C in these clusters.
Further Study
There are a number of other experiments that are interesting and could be carried out on this topic.
- Other ligands can be swapped for B-H units and the stability and MOs of these complexes can be compared. For example, instead of a carbene, a C-Me or C-SMe2 could be incorporated.
- Also, the [B6H6]-2 can have its MOs computed and NBO analysis calculated using a different method to see if the problems experienced in this experiment can be avoided.
- Similar, nido or arachno structures could be fully investigated to see how their bonding, electronic behaviour and MOs compare to those of close structures.
- Cluster, such as [Ge9]4- - which is an example of a Zintl anion, could be computed and explored to compare these larger complexes with the ones explored in this report.
References
- ↑ 1.0 1.1 William M. Haynes, "CRC Handbook of Chemistry and Physics", CRC Press., 2012-2013, 93rd Edition, Ch.9 p.15-20
- ↑ Roger L. DeKock, "Chemical Structure and Bonding", University Science Books., 1989, 2nd Edition, Ch.2 p96
- ↑ Barth RF, Soloway AH, Fairchild RG. "Boron neutron capture therapy for cancer", Sci Am., 1990, Vol 263, pp 100-107. DOI:10.1038/scientificamerican1090-100
- ↑ C. Housecroft, A. Sharpe "Inorganic chem.", Pearson, 2008, 3rd Edn. pp 365.


