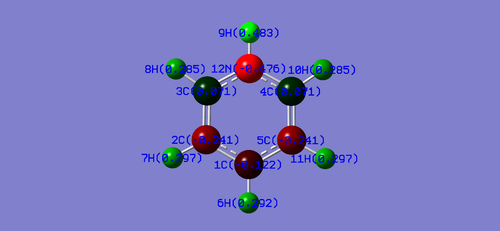
Rep:Mod:lx921011inorg
Week 1
Optimisation and Analysis of BH3
3-21 G Basis
First of all, a molecule of BH3 was created using Gaussview, followed by setting three B-H bond lengths to 1.55 Å , 1.54 Å and 1.53 Å. The resulting molecule was optimised using B3LYP method and 3-21G basis set. The results were summarised in the following tables.
| BH3 optimisation | File:BH3 D1 opt.log |
| File Name | BH3_D1_opt |
| File Type | .log |
| Calculation Type | FOPT |
| Calculation Method | RB3LYP |
| Basis Set | 3-21G |
| Charge | 0 |
| Spin | Singlet |
| E(RB3LYP) | -26.46226418 a.u |
| E(RB3LYP) | -69476.67 kJ/mol |
| RMS Gradient Norm | 0.00011739 a.u. |
| Imaginary Freq | |
| Dipole Moment | 0.00 Debye |
| Point Group | CS |
| Bond Lengths | 1.19 Å, 1.19 Å, 1.19 Å |
| Bond Angles | 120.0o |
| Job cpu time: | 0 days 0 hours 0 minutes 32.7 seconds. |
         Item               Value     Threshold  Converged?
 Maximum Force            0.000297     0.000450     YES
 RMS     Force            0.000123     0.000300     YES
 Maximum Displacement     0.001246     0.001800     YES
 RMS     Displacement     0.000617     0.001200     YES
 Predicted change in Energy=-2.806719D-07
 Optimization completed.
    -- Stationary point found.
                           ----------------------------
                           !   Optimized Parameters   !
                           ! (Angstroms and Degrees)  !
 --------------------------                            --------------------------
 ! Name  Definition              Value          Derivative Info.                !
 --------------------------------------------------------------------------------
 ! R1    R(1,2)                  1.195          -DE/DX =   -0.0003              !
 ! R2    R(1,3)                  1.1946         -DE/DX =   -0.0001              !
 ! R3    R(1,4)                  1.1943         -DE/DX =    0.0                 !
 ! A1    A(2,1,3)              120.0249         -DE/DX =    0.0                 !
 ! A2    A(2,1,4)              119.969          -DE/DX =    0.0                 !
 ! A3    A(3,1,4)              120.0061         -DE/DX =    0.0                 !
 ! D1    D(2,1,4,3)            180.0            -DE/DX =    0.0                 !
 --------------------------------------------------------------------------------
 GradGradGradGradGradGradGradGradGradGradGradGradGradGradGradGradGradGrad
It can be deduced from the item table that the calculation was finished because all of the gradient terms are less than 0.001 and all forces and displacements are converged, suggesting an equilibrium was reached. So the calculation was accomplished. In addition, all of the B-H bond lengths are the same up to 3 significant figures. This agrees with the theoretical expectation that all of the bond lengths are the same for BH3 because of the trigonal planar structure of the molecule. It should be noted that the point group is not D3h as predicted by the point group theory, due to the point group not being restricted.
6-31G (d,p) Basis
To compare the nature of different basis sets, a further optimisation based on the results above using 6-31G(d,p) basis set was completed.
| BH3 optimisation | File:BH3 D1 opt 6-31G dp.log |
| File Name | BH3_D1_opt_6-31G dp.com |
| File Type | .log |
| Calculation Type | FOPT |
| Calculation Method | RB3LYP |
| Basis Set | 6-31G(d,p) |
| Charge | 0 |
| Spin | Singlet |
| E(RB3LYP) | -26.6153236 a.u. |
| E(RB3LYP) | --69878.52 kJ/mol |
| RMS Gradient Norm | 0.000012 a.u. |
| Imaginary Freq | |
| Dipole Moment | 0.00 Debye |
| Point Group | CS |
| Bond Lengths | 1.19 Å, 1.19 Å, 1.19 Å |
| Bond Angles | 120.0o |
| Job cpu time | 0 days 0 hours 0 minutes 13.5 second |
         Item               Value     Threshold  Converged?
 Maximum Force            0.000022     0.000450     YES
 RMS     Force            0.000012     0.000300     YES
 Maximum Displacement     0.000115     0.001800     YES
 RMS     Displacement     0.000067     0.001200     YES
 Predicted change in Energy=-2.904188D-09
 Optimization completed.
    -- Stationary point found.
                           ----------------------------
                           !   Optimized Parameters   !
                           ! (Angstroms and Degrees)  !
 --------------------------                            --------------------------
 ! Name  Definition              Value          Derivative Info.                !
 --------------------------------------------------------------------------------
 ! R1    R(1,2)                  1.1923         -DE/DX =    0.0                 !
 ! R2    R(1,3)                  1.1923         -DE/DX =    0.0                 !
 ! R3    R(1,4)                  1.1923         -DE/DX =    0.0                 !
 ! A1    A(2,1,3)              120.0089         -DE/DX =    0.0                 !
 ! A2    A(2,1,4)              119.9851         -DE/DX =    0.0                 !
 ! A3    A(3,1,4)              120.006          -DE/DX =    0.0                 !
 ! D1    D(2,1,4,3)            180.0            -DE/DX =    0.0                 !
 --------------------------------------------------------------------------------
 GradGradGradGradGradGradGradGradGradGradGradGradGradGradGradGradGradGrad
Again, the calculation was successfully finished indicated by the zero values of -DE/DX and converged forces and displacements. It can be concluded that the computed BH3 bond lengths and bond angles are the same for 6-31G (d,p) and 3-21G basis sets, revealing both methods can optimise the structure of BH3 because of the small size of BH3.
Optimisation and Analysis of GaBr3
To use pseudo-potentials and larger basis sets, a molecule of GaBr3 was created in Gaussview. Then, the symmetry was restricted by setting the tolerance of the point group to be very tight (0.0001), followed by optimising it using HPC service. The information and results were presented in the following tables.
| GaBr3 Optimisation | DOI:10042/26070 |
| File Name | GaBr3 HPC output |
| File Type | .log |
| Calculation Type | FOPT |
| Calculation Method | RB3LYP |
| Basis Set | LANL2DZ |
| Charge | 0 |
| Spin | Singlet |
| E(RB3LYP) (a.u.) | -41.70082783 |
| E(RB3LYP) (kJ/mol) | -109485.51 |
| RMS Gradient Norm (a.u.) | 0.00000016 |
| Imaginary Freq | |
| Dipole Moment (Debye) | 0.00 |
| Point Group | D3h |
| Bond Lengths | 2.35 Å, 2.35 Å, 2.35 Å |
| Literature Bond Lengths | 2.272 Å[1] in GaBr4 |
| Optimised Br-Ga-Br Angles | All 120o |
| Job cpu time | 0 days 0 hours 0 minutes 23.4 seconds. |
         Item               Value     Threshold  Converged?
 Maximum Force            0.000000     0.000450     YES
 RMS     Force            0.000000     0.000300     YES
 Maximum Displacement     0.000003     0.001800     YES
 RMS     Displacement     0.000002     0.001200     YES
 Predicted change in Energy=-1.282682D-12
 Optimization completed.
    -- Stationary point found.
                           ----------------------------
                           !   Optimized Parameters   !
                           ! (Angstroms and Degrees)  !
 --------------------------                            --------------------------
 ! Name  Definition              Value          Derivative Info.                !
 --------------------------------------------------------------------------------
 ! R1    R(1,2)                  2.3502         -DE/DX =    0.0                 !
 ! R2    R(1,3)                  2.3502         -DE/DX =    0.0                 !
 ! R3    R(1,4)                  2.3502         -DE/DX =    0.0                 !
 ! A1    A(2,1,3)              120.0            -DE/DX =    0.0                 !
 ! A2    A(2,1,4)              120.0            -DE/DX =    0.0                 !
 ! A3    A(3,1,4)              120.0            -DE/DX =    0.0                 !
 ! D1    D(2,1,4,3)            180.0            -DE/DX =    0.0                 !
 --------------------------------------------------------------------------------
 GradGradGradGradGradGradGradGradGradGradGradGradGradGradGradGradGradGrad
The completion of the calculation was confirmed because all of the gradient terms are zero and all of the forces and displacements are converged. From Table 3, all of bond lengths and Br-Ga-Br angles are exactly the same, agreeing the theoretical prediction for a trigonal planar molecule. Thus, the calculated point group is D3h, which is the same as the theoretical prediction. The calculated bond lengths are longer than literature bond lengths for about 0.1 Å, which is very small, suggesting the computed results are resonable using the basis set and calculation method stated above.
Reference
- ↑ David R. Lide, ed., CRC Handbook of Chemistry and Physics, Internal Version 2005, 9-18.
Optimisation and Analysis of BBr3
A molecule of BBr3 was created based on the optimised structure of BH3 and optimised using a mixture of basis-set and pseudopotentials due to the heavy nature of bromine. The information and results of the calculation were summarised in the following table.
| BBr3 optimisation | DOI:10042/26090 |
| File Name | BBr3 HPC output |
| File Type | .log |
| Calculation Type | FOPT |
| Calculation Method | RB3LYP |
| Basis Set | Gen ( 6-31G(d,p) for B and LanL2DZ for Br) |
| Charge | 0 |
| Spin | Singlet |
| E(RB3LYP) (a.u.) | -64.43645246 |
| E(RB3LYP) (kJ/mol) | -169177.88 |
| RMS Gradient Norm | 0.00000776 |
| Imaginary Freq | |
| Dipole Moment (Debye) | 0.00 |
| Point Group | CS |
| B-Br Bond Lengths | 1.93 Å, 1.93 Å, 1.93 Å |
| Br-B-Br Angles | All 120.0 o |
| Job cpu time | 0 days 0 hours 0 minutes 41.0 seconds |
         Item               Value     Threshold  Converged?
 Maximum Force            0.000013     0.000450     YES
 RMS     Force            0.000007     0.000300     YES
 Maximum Displacement     0.000042     0.001800     YES
 RMS     Displacement     0.000027     0.001200     YES
 Predicted change in Energy=-8.100060D-10
 Optimization completed.
    -- Stationary point found.
                           ----------------------------
                           !   Optimized Parameters   !
                           ! (Angstroms and Degrees)  !
 --------------------------                            --------------------------
 ! Name  Definition              Value          Derivative Info.                !
 --------------------------------------------------------------------------------
 ! R1    R(1,2)                  1.9339         -DE/DX =    0.0                 !
 ! R2    R(1,3)                  1.9339         -DE/DX =    0.0                 !
 ! R3    R(1,4)                  1.934          -DE/DX =    0.0                 !
 ! A1    A(2,1,3)              120.001          -DE/DX =    0.0                 !
 ! A2    A(2,1,4)              120.0015         -DE/DX =    0.0                 !
 ! A3    A(3,1,4)              119.9975         -DE/DX =    0.0                 !
 ! D1    D(2,1,4,3)            180.0            -DE/DX =    0.0                 !
 --------------------------------------------------------------------------------
 GradGradGradGradGradGradGradGradGradGradGradGradGradGradGradGradGradGrad
The optimisation was converged, indicated by the values of -DE/DX and converged nature of forces and displacements according to the item table above. Here, the point group is Cs, which is different from GaBr3, due to the fact that the symmetry was not restricted.
Cross Comparison and Summary
To cross-compare the bond distances of BH3, BBr3 and GaBr3, the following table was constructed.
| Molecule | Bond Distance (Å) |
| BH3 | 1.19 |
| BBr3 | 1.93 |
| GaBr3 | 2.35 |
By comparing the bond distance between BH3 and BBr3, it can be concluded that changing ligand to from hydride to bromide increases the bond length. This is due to the larger radius and higher polarisability of the bromide compared to the hydride, resulting in a longer bond due to more covalent nature, and orbital overlap is poorer for BBr3 due to the size mismatch. This comparison is based on the fact that the central atom is the same and both of the ligand act as an one-electron donor. In addition, bromide is more electronegative than hydride, resulting in a more polar bond for BBr3, increasing the bond length, also contributed from a poorer overlap due to energy mismatch.
Through the comparison between BBr3 and GaBr3, it can be deduced that a change of the central atom from boron to gallium increases the bond length. This is due to the larger atomic radius of the gallium compared to boron, and the polarising power of gallium is lower than boron. In terms of electronegativity, Ga is less elctronegative than B, causing the increase in bond polarity. So the Ga-Br bond is weaker than the B-Br bond because of the poorer overlap due to the reasons stated above, thus resulting in a longer bond. This comparison is based on the fact that both B and Ga are sp2 hybridised and act as an one electron acceptor.
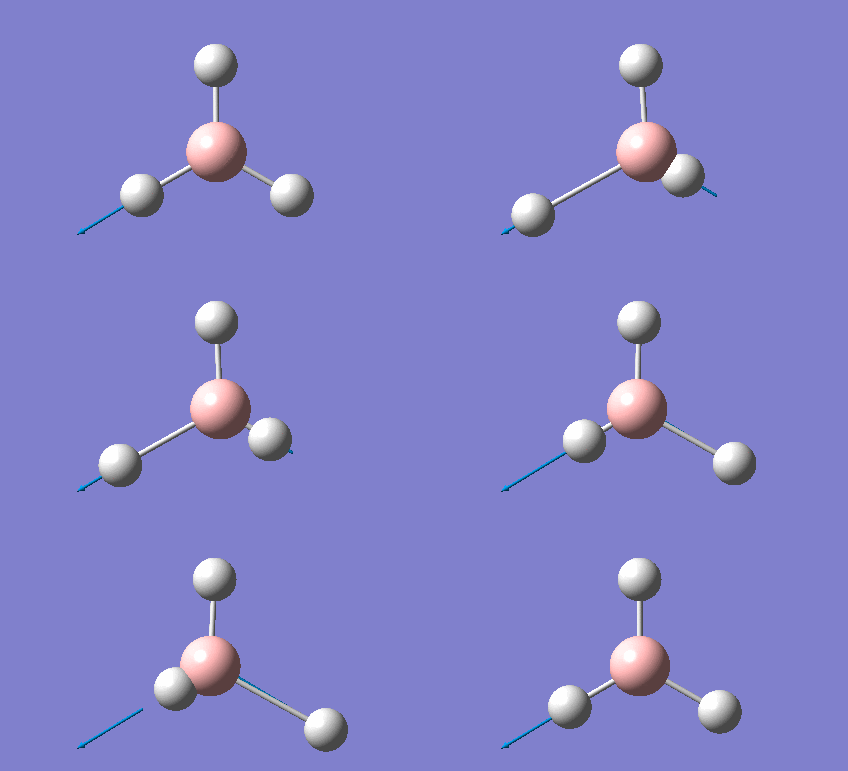
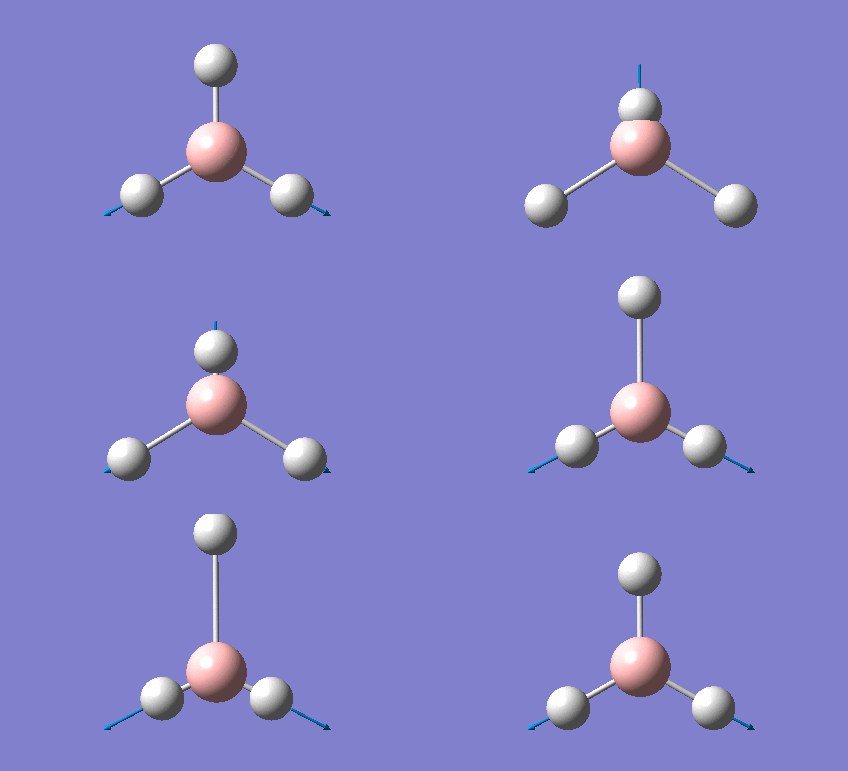
During the initial steps of the optimisation of BH3 by 3-21G basis, there is no bond as shown in Figures 1-3. This is due to the nature of the Gaussview. Because it has a distance limit for a bond to be visible. The bond lengths were increased manually before the optimisation. Consequently, the resulting lengths exceed the limit during the initial steps of the optimisation. There are actually three invisible bonds as the hydrogen atoms still orient in a trigonal planar fashion relative to the central B atom,verifying the existence of the chemical bonds, which is in fact the electrostatic attraction between atoms. Then, bond lengths decrease gradually with the process of the optimisation. The first visible bond appears in Step 3. This phenomenon was not observed for the optimisation by 6-31G basis, because the bond lengths had entered the visible region for Gaussview after the initial optimisation by 3-21 G basis.


Frequency Analysis of BH3
First of all, the point group of the optimised BH3 was restricted to D3h by setting the tolerance to be very tight (0.0001), followed by a frequency analysis using the same method and basis set as in optimisation. The information and results were summarised in the following tables.
| BH3 frequency | File:BH3 D1 OPT 6-31G DP FREQ NEW.LOG |
| File Name | BH3_D1_OPT_6-31G DP_FREQ_NEW |
| File Type | .log |
| Calculation Type | FREQ |
| Calculation Method | RB3LYP |
| Basis Set | 6-31G(d,p) |
| Charge | 0 |
| Spin | Singlet |
| E(RB3LYP) (a.u.) | -26.61532363 |
| E(RB3LYP) (kJ/mol) | -69878.52 |
| RMS Gradient Norm (a.u.) | 0.00000681 |
| Imaginary Freq | 0 |
| Dipole Moment (Debye) | 0.00 |
| Point Group | D3h |
Low frequencies --- -7.6863 -1.5828 -0.0054 0.6435 6.8283 7.0093
Low frequencies --- 1162.9673 1213.1631 1213.1658

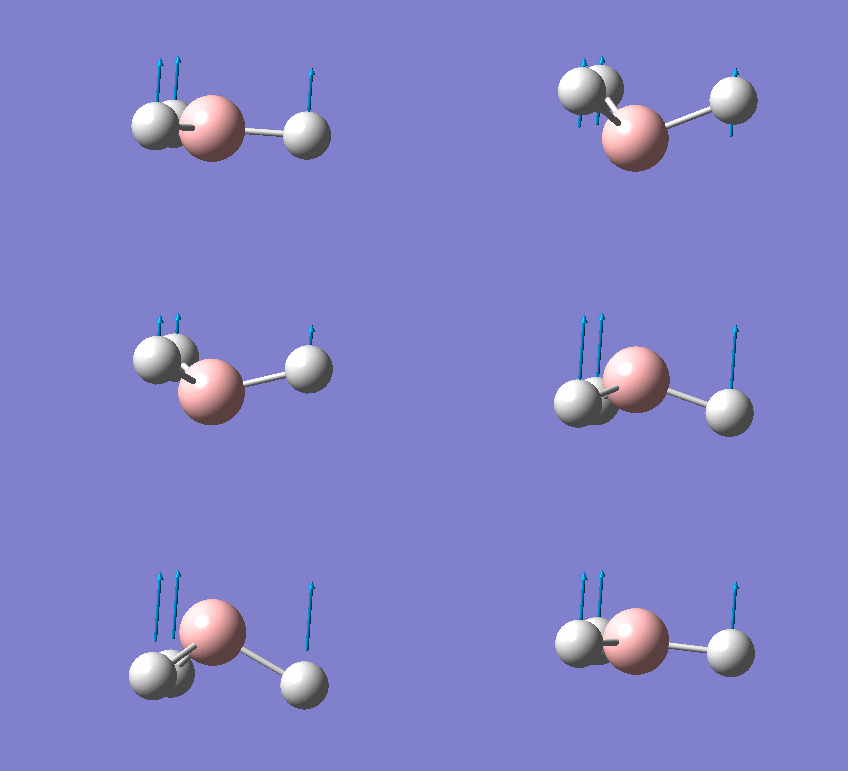
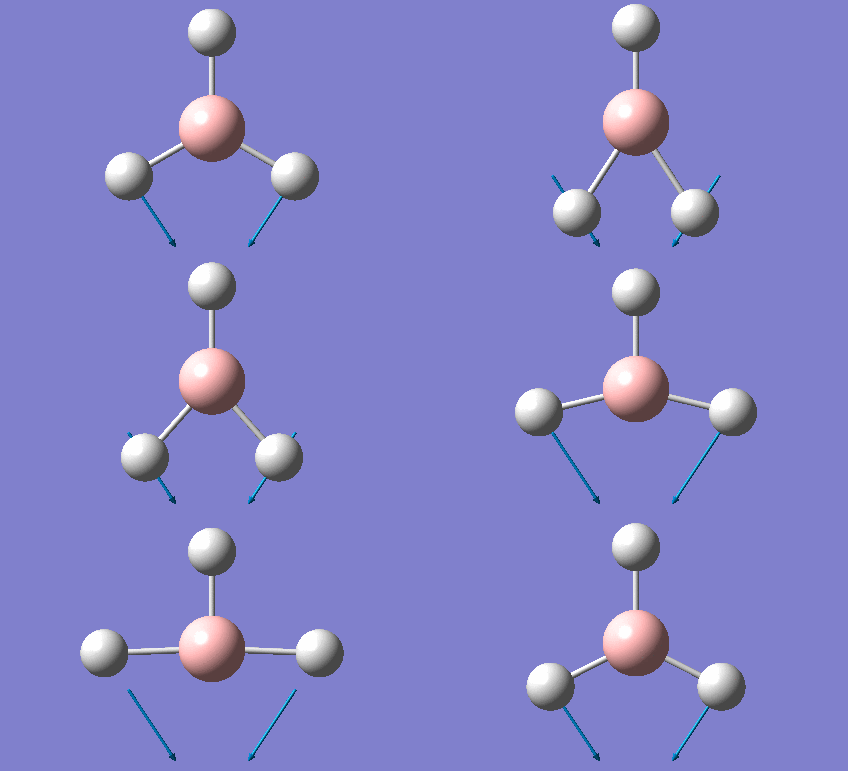
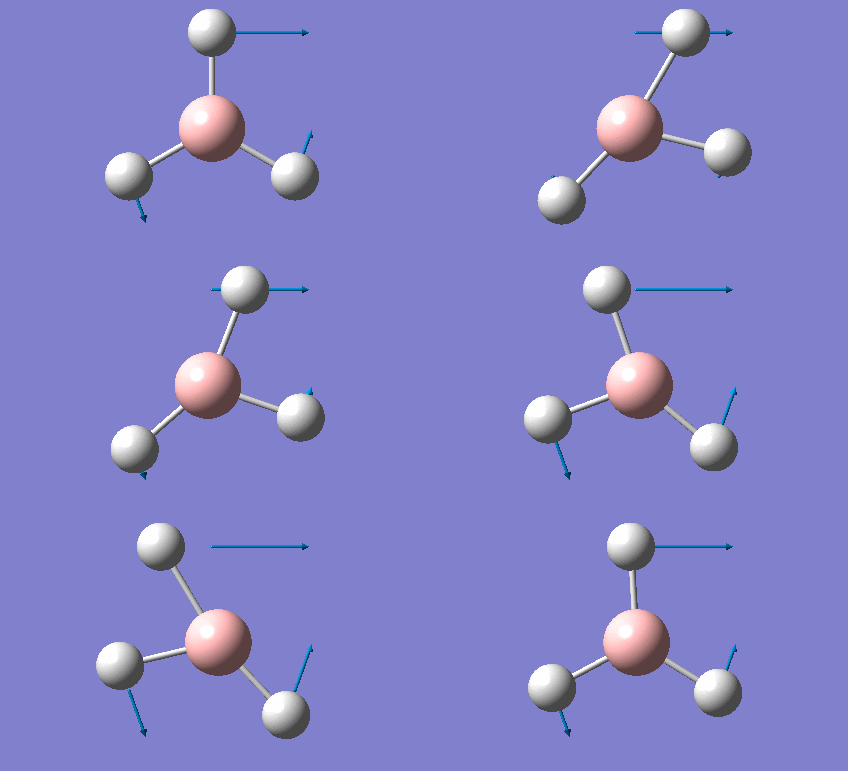
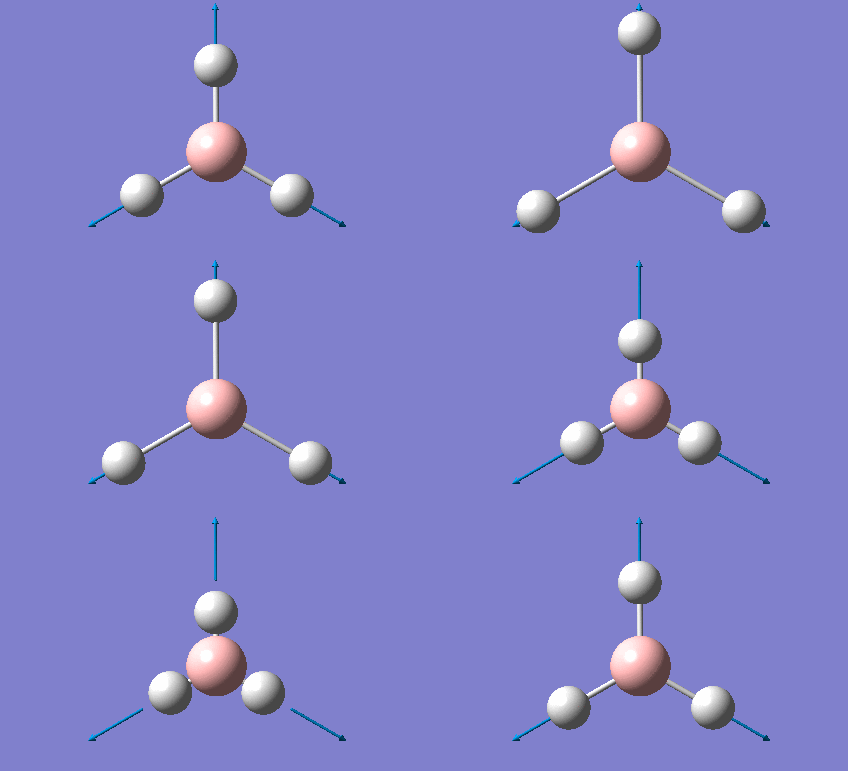
The frequency analysis are judged to be successfully completed by the range of the low frequencies which is within ± 15 cm-1 and these frequencies are close to zero. It can be seen from Figure 4 that there are only 3 peaks, which are less than the number of vibrational modes, which is 6, from the results obtained on Table 7. Because the selection rule for IR spectroscopy is there must be a change in dipole moment during the vibrational motion of the molecule. For the vibrational mode 4, the change of dipole moment is cancelled as the bond angles of BH3 are 120o according to Table 2. Thus, this vibrational motion cannot be revealed by IR spectroscopy. In addition, motions 2 and 3 and motions 5 and 6 are two degenrate sets of vibrations, appearing as one peak for each set in the spectrum. So it can be concluded that there are 3 peaks on the IR spectrum.
Frequency Analysis of GaBr3
To compare the difference between the vibrational motions of GaBr3 and BH3, it is necessary to carry out frequency analysis for GaBr3 using the same method and basis set based on the optimised structure of GaBr3 in the previous part. The results and information were summarised as follows.
| GaBr3 Frequency | DOI:10042/26110 |
| File Name | log_82606 |
| File Type | .log |
| Calculation Type | FREQ |
| Calculation Method | RB3LYP |
| Basis Set | LANL2DZ |
| Charge | 0 |
| Spin | Singlet |
| E(RB3LYP) (a.u.) | -41.70082783 |
| E(RB3LYP) (kJ/mol) | -109485.51 |
| RMS Gradient Norm (a.u.) | 0.00000011 |
| Imaginary Freq | 0 |
| Dipole Moment (Debye) | 0 |
| Point Group | D3h |
| Job cpu time | 0 days 0 hours 0 minutes 19.4 seconds. |
Low frequencies --- -0.5252 -0.5247 -0.0024 -0.0010 0.0235 1.2010
Low frequencies --- 76.3744 76.3753 99.6982
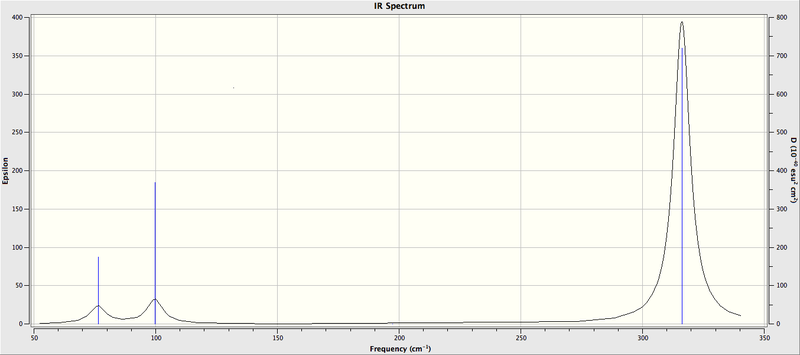
| No. | Frequency (cm-1) | Frequency (cm-1) | |||
| BH3 (cm-1) | Symmtry Label | GaBr3 (cm-1) | Symmtry Label | Type of Motion | |
| 1 | 1162.97 | a2" | 76.37 | e' | bend |
| 2 | 1213.16 | e' | 76.38 | e' | bend |
| 3 | 1213.16 | e' | 99.70 | a2" | bend |
| 4 | 2582.38 | a1' | 197.34 | a1' | bend |
| 5 | 2715.56 | e' | 316.18 | e' | bend |
| 6 | 2715.56 | e' | 316.19 | e' | bend |
The analysis was successfully accomplished according to the low frequencies, which lie within the range of ±15 cm-1 and are close to zero. By comparing Figures 4 and 5, both of the spectra consist of 3 peaks and a similar pattern is observed, due to the same point group, D3h, hence similar vibrational environments for these two molecules. From Table 9, the vibrational frequencies of GaBr3 is much lower than BH3, due to the greater reduced mass of GaBr3 as both Ga and Br are heavier than B and H. Also, the atomic radii of Ga and Br are greater than B and H, resulting in the less rigidity of the Ga-Br bond compared to the B-H bond because of the poorer overlap. So, the Ga-Br bond vibrates slower than the B-H bond.
According to Table 9, the order of the e' and the a2" bends is reversed from BH3 to GaBr3. This might be rationalised from the magneitude of displacement vectors , e' vibrations of GaBr3 involve the significant displacement vectors of all of the Ga and Br atoms. In contrast, a2" vibration only involves the significant motion of Ga atom and smaller dispalcement of Br atoms,which can be deduced from the smaller displacement vectors as shown in the following table, resulting in a higher vibrational frequency.
| No. | Animation | Frequency (cm-1) | Symmetry Label |
| 1 | 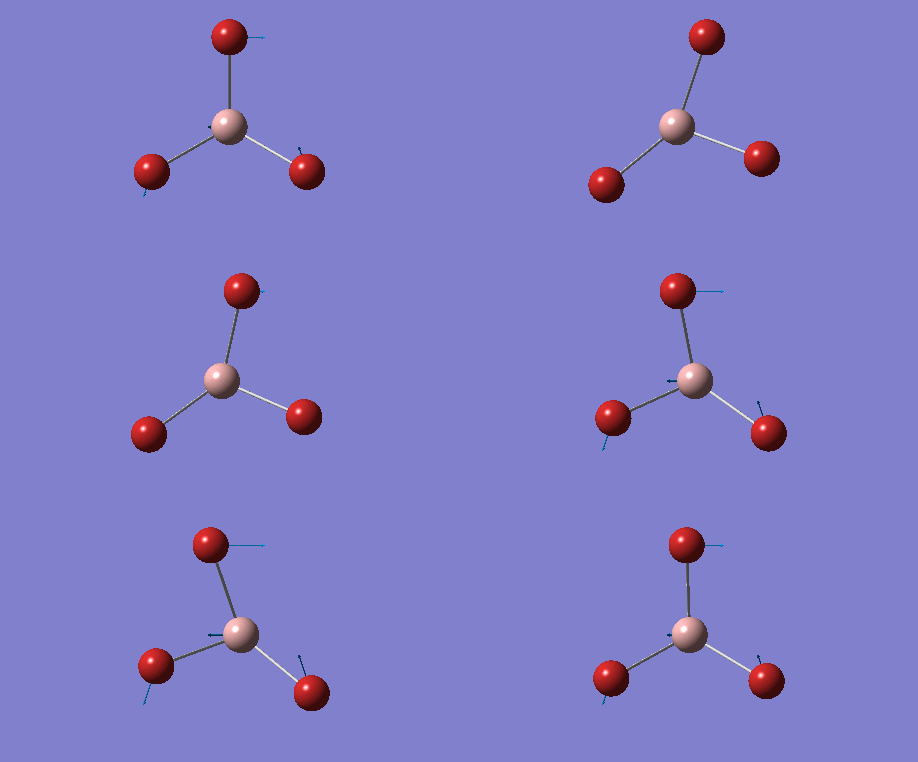 |
76.37 | e' (lowest real mode) |
| 2 | 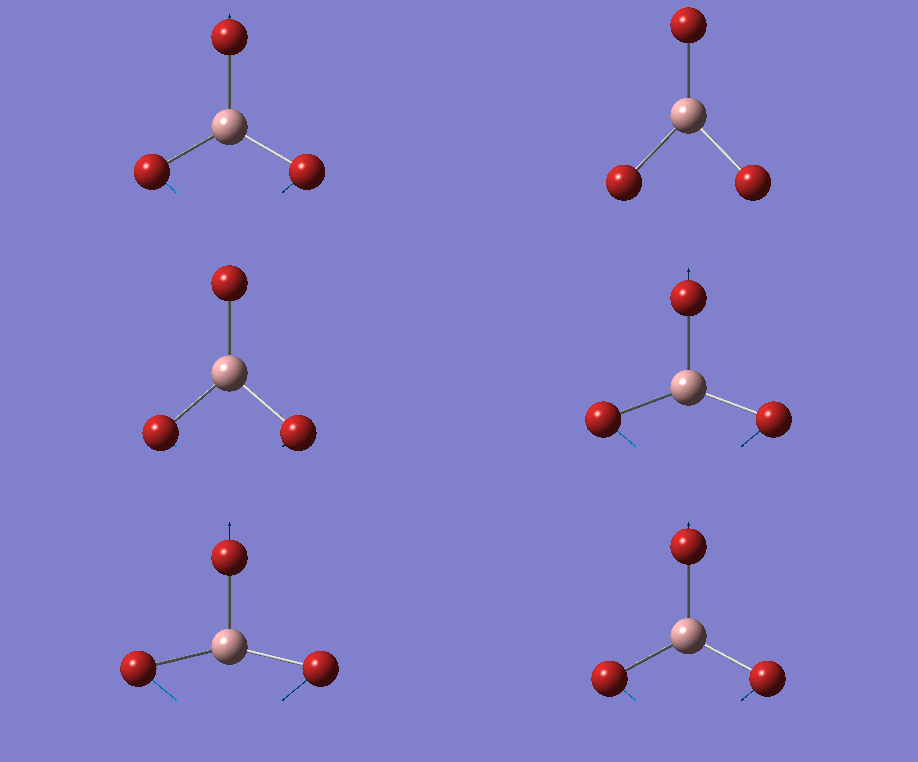 |
76.38 | e' (lowest real mode) |
| 3 | 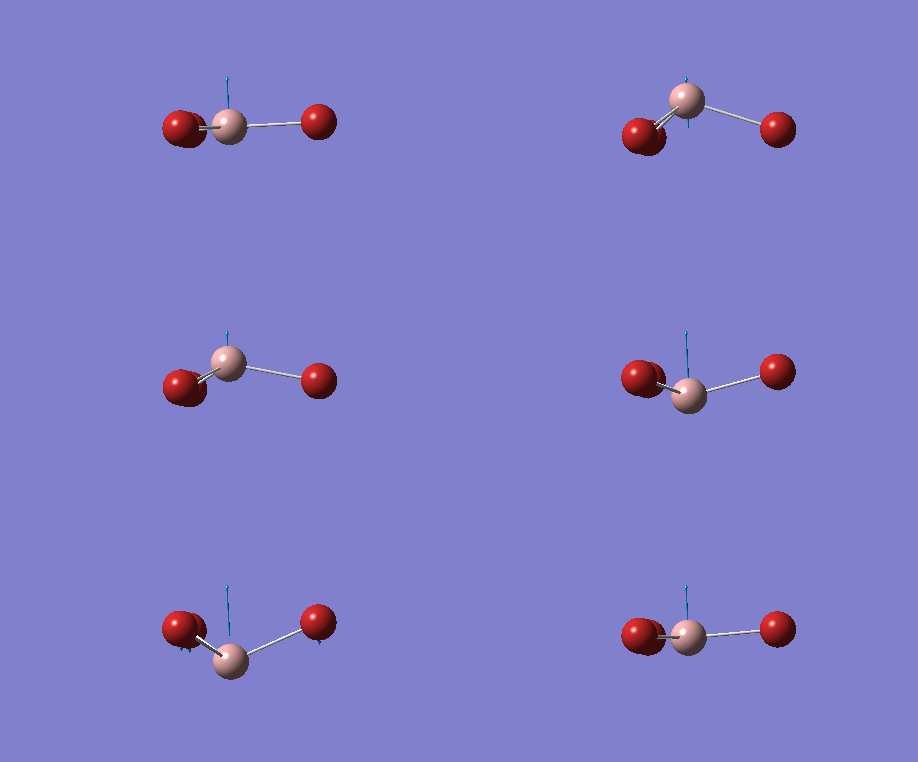 |
99.70 | a2" |
The stretching motion, which involves the dramatic change of bond lengths while the bending motion only requires the slight change in bond lengths. Based on this argument, it can also be deduced from Table 9 that a2" and e' bends, which lie very close ,are lower in energy than a1'and e' stretches. Because bend motions require less energy than stretching motions.
To conclude, the purpose of a frequency analysis is to ensure whether a minimum of the energy of a optimised structure has been reached and to figure out vibrational modes for a molecule, hence computing an IR spectrum. It is based on the result of the optimisation. So same method and basis set must be used to ensure the consistency. Otherwise, the frequency analysis has no significance. The low frequencies are the motions of the centre of the mass, so it is much lower than real frequencies. They are "-6" term in the formula "3N-6" to determine the number of vibration modes for a molecule, where N is the total number of atoms.
Molecular Orbitals of BH3
The analysis of molecular orbitals of BH3 was carried out based on the optimised structure of BH3 by the 6-31G (d,p) basis set. The information of the calculation was summarised in the following table.
| BH3 MO | DOI:10042/26109 |
| File Name | LX_BH3_MO |
| File Type | .fch |
| Calculation Type | SP |
| Calculation Method | RB3LYP |
| Basis Set | 6-31G(D,P) |
| Charge | 0 |
| Spin | Singlet |
| Total Energy (a.u.) | -26.6153236 |
| Total Energy (kJ/mol) | -69878.52 |
| RMS Gradient Norm (a.u.) | 0 |
| Imaginary Freq | |
| Dipole Moment (Debye) | 0.0001 |
| Point Group | |
| Job cpu time | 0 days 0 hours 0 minutes 24 seconds. |
A MO diagram of BH3 based on LCAO theory was drawn using Chemdraw with computed MOs on it to compare the difference of these MOs.

According to Figure 6, LCAO MOs are simply as a result from the combination of the atomic orbitals, which means the electron density is localised on individual atomic orbitals. But for the real MOs, the electron density is delocalised on the whole molecular orbitals. So, LCAO method cannot give a clear picture on the shape and location of the electron density. But, the positions of nodal planes and nodes as labelled on LCAO MOs on Figure 6 are the same with those on calculated MOs, suggesting the LCAO method can predict accurate positions of nodal planes and nodes. To conclude, LCAO method is not good at predicting the location and shape of the electron density but can give accurate positions of nodal planes and nodes.
Analysis of NH3
First, a molecule of NH3 was created using Gaussview, followed by an optimisation using 6-31G(d,p) basis and DFT method with no symmetry. The information was summarised as follows.
| NH3 optimisation | File:LX NH3 OPT 6-31G DP.LOG |
| File Name | LX_NH3_OPT_6-31G DP |
| File Type | .log |
| Calculation Type | FOPT |
| Calculation Method | RB3LYP |
| Basis Set | 6-31G(d,p) |
| Charge | 0 |
| Spin | Singlet |
| E(RB3LYP) (a.u.) | -56.55776872 |
| E(RB3LYP) (kJ/mol) | -148492.40 |
| RMS Gradient Norm | 0.00000095 |
| Imaginary Freq | |
| Dipole Moment (Debye) | 1.85 |
| Point Group | C1 |
| Job cpu time | 0 days 0 hours 0 minutes 21.0 seconds. |
         Item               Value     Threshold  Converged?
 Maximum Force            0.000002     0.000015     YES
 RMS     Force            0.000001     0.000010     YES
 Maximum Displacement     0.000005     0.000060     YES
 RMS     Displacement     0.000003     0.000040     YES
 Predicted change in Energy=-9.677657D-12
 Optimization completed.
    -- Stationary point found.
                           ----------------------------
                           !   Optimized Parameters   !
                           ! (Angstroms and Degrees)  !
 --------------------------                            --------------------------
 ! Name  Definition              Value          Derivative Info.                !
 --------------------------------------------------------------------------------
 ! R1    R(1,2)                  1.018          -DE/DX =    0.0                 !
 ! R2    R(1,3)                  1.018          -DE/DX =    0.0                 !
 ! R3    R(1,4)                  1.018          -DE/DX =    0.0                 !
 ! A1    A(2,1,3)              105.7447         -DE/DX =    0.0                 !
 ! A2    A(2,1,4)              105.7444         -DE/DX =    0.0                 !
 ! A3    A(3,1,4)              105.7444         -DE/DX =    0.0                 !
 ! D1    D(2,1,4,3)           -111.8637         -DE/DX =    0.0                 !
 --------------------------------------------------------------------------------
 GradGradGradGradGradGradGradGradGradGradGradGradGradGradGradGradGradGrad
The calculation was finished because of the converged values of forces and displacements. Also, all of the gradient terms are zero. A frequency analysis was completed to ensure the optimisation result is a minimum. It is necessary to restrict the point group to D3h by setting the tolerance to tight before the analysis.
| NH3 frequency | File:LX NH3 FREQ 6-31G DP NEW.LOG |
| File Name | LX_NH3_FREQ_6-31G_DP_NEW |
| File Type | .log |
| Calculation Type | FREQ |
| Calculation Method | RB3LYP |
| Basis Set | 6-31G(d,p) |
| Charge | 0 |
| Spin | Singlet |
| E(RB3LYP) (a.u.) | -56.55776873 |
| E(RB3LYP) (kJ/mol) | -148492.40 |
| RMS Gradient Norm (a.u.) | 0.00000133 |
| Imaginary Freq | 0 |
| Dipole Moment | 1.85 |
| Point Group | C3v |
| Job cpu time | 0 days 0 hours 0 minutes 8.0 seconds. |
Low frequencies --- -0.0662 -0.0039 0.0017 1.3732 4.3473 4.3478
Low frequencies --- 1089.3706 1693.9316 1693.9316
It can be deduced from the low frequencies that a minimum has been reached as the frequencies lie within ±15 cm-1 and are close to zero and much lower compared to the first vibration at 1089.37 cm-1. So, a NBO analysis can be carried out. The information was summarised as follows.
| NH3 NBO | File:LX NH3 OPT 6-31GDP NBO.LOG |
| File Name | LX_NH3_OPT_6-31GDP_NBO |
| File Type | .log |
| Calculation Type | FOPT |
| Calculation Method | RB3LYP |
| Basis Set | 6-31G(d,p) |
| Charge | 0 |
| Spin | Singlet |
| E(RB3LYP) (a.u.) | -56.55776872 |
| E(RB3LYP) (kJ/mol) | -148492.40 |
| RMS Gradient Norm (a.u.) | 0.00000095 |
| Imaginary Freq | |
| Dipole Moment (Debye) | 1.85 |
| Point Group | C1 |
| Job cpu time | 0 days 0 hours 0 minutes 8.0 seconds. |

The range of the charge distribution is -1.00 - +1.00. The specific NMO charges for H are +0.375 and -1.125 for N. This verifies that nitrogen is more electronegative than hydrogen. Also, the sum of charges for nitrogen and hydrogen are zero, confirming neutrality of this molecule. So, NBO analysis was successful.
Finding Association Energies of H3NBH3
A molecule of H3NBH3 was created on Gaussview. Then, it was optimised with no restriction on symmetry using the same method (B3LYP) and basis set (6-31G (d,p)) as used for optimisations of NH3 and BH3. Information and results for this optimisation were summarised as follows.
| NH3BH3 Opt | File:LX NH3BH3 OPT 6-31G DP.LOG |
| File Name | LX_NH3BH3_OPT_6-31G DP |
| File Type | .log |
| Calculation Type | FOPT |
| Calculation Method | RB3LYP |
| Basis Set | 6-31G(d,p) |
| Charge | 0 |
| Spin | Singlet |
| E(RB3LYP) (a.u.) | -83.22468907 |
| E(RB3LYP) (kJ/mol) | -218506.39 |
| RMS Gradient Norm (a.u.) | 0.00000122 |
| Imaginary Freq | |
| Dipole Moment (Debye) | 5.56 |
| Point Group | - |
         Item               Value     Threshold  Converged?
 Maximum Force            0.000002     0.000015     YES
 RMS     Force            0.000001     0.000010     YES
 Maximum Displacement     0.000027     0.000060     YES
 RMS     Displacement     0.000009     0.000040     YES
 Predicted change in Energy=-9.030556D-11
 Optimization completed.
    -- Stationary point found.
                           ----------------------------
                           !   Optimized Parameters   !
                           ! (Angstroms and Degrees)  !
 --------------------------                            --------------------------
 ! Name  Definition              Value          Derivative Info.                !
 --------------------------------------------------------------------------------
 ! R1    R(1,7)                  1.2098         -DE/DX =    0.0                 !
 ! R2    R(2,7)                  1.2098         -DE/DX =    0.0                 !
 ! R3    R(3,7)                  1.2098         -DE/DX =    0.0                 !
 ! R4    R(4,8)                  1.0185         -DE/DX =    0.0                 !
 ! R5    R(5,8)                  1.0185         -DE/DX =    0.0                 !
 ! R6    R(6,8)                  1.0185         -DE/DX =    0.0                 !
 ! R7    R(7,8)                  1.6677         -DE/DX =    0.0                 !
 ! A1    A(1,7,2)              113.874          -DE/DX =    0.0                 !
 ! A2    A(1,7,3)              113.874          -DE/DX =    0.0                 !
 ! A3    A(1,7,8)              104.5972         -DE/DX =    0.0                 !
 ! A4    A(2,7,3)              113.874          -DE/DX =    0.0                 !
 ! A5    A(2,7,8)              104.5972         -DE/DX =    0.0                 !
 ! A6    A(3,7,8)              104.5973         -DE/DX =    0.0                 !
 ! A7    A(4,8,5)              107.8749         -DE/DX =    0.0                 !
 ! A8    A(4,8,6)              107.8749         -DE/DX =    0.0                 !
 ! A9    A(4,8,7)              111.0237         -DE/DX =    0.0                 !
 ! A10   A(5,8,6)              107.8748         -DE/DX =    0.0                 !
 ! A11   A(5,8,7)              111.0241         -DE/DX =    0.0                 !
 ! A12   A(6,8,7)              111.0241         -DE/DX =    0.0                 !
 ! D1    D(1,7,8,4)           -180.0            -DE/DX =    0.0                 !
 ! D2    D(1,7,8,5)            -60.0            -DE/DX =    0.0                 !
 ! D3    D(1,7,8,6)             60.0            -DE/DX =    0.0                 !
 ! D4    D(2,7,8,4)            -60.0            -DE/DX =    0.0                 !
 ! D5    D(2,7,8,5)             60.0            -DE/DX =    0.0                 !
 ! D6    D(2,7,8,6)           -180.0            -DE/DX =    0.0                 !
 ! D7    D(3,7,8,4)             60.0            -DE/DX =    0.0                 !
 ! D8    D(3,7,8,5)            180.0            -DE/DX =    0.0                 !
 ! D9    D(3,7,8,6)            -60.0            -DE/DX =    0.0                 !
 --------------------------------------------------------------------------------
 GradGradGradGradGradGradGradGradGradGradGradGradGradGradGradGradGradGrad
The optimisation was finished because all forces and displacements are converged and all gradient terms are zero, suggesting a stationary point was reached. To ensure a minimum had been achieved, a frequency analysis was carried out using the same method and basis set with the restriction of the point group to D3h using very tight tolerance (0.0001):
| NH3BH3 Frequency | File:LX NH3BH3 FREQ 6-31G DP.LOG |
| File Name | LX_NH3BH3_FREQ_6-31G DP |
| File Type | .log |
| Calculation Type | FREQ |
| Calculation Method | RB3LYP |
| Basis Set | 6-31G(d,p) |
| Charge | 0 |
| Spin | Singlet |
| E(RB3LYP) (a.u.) | -83.22468909 |
| E(RB3LYP) (kJ/mol) | -218506.39 |
| RMS Gradient Norm | 0.00000134 |
| Imaginary Freq | 0 |
| Dipole Moment (Debye) | 5.56 |
| Point Group | C3v |
| Job cpu time | 0 days 0 hours 0 minutes 21.0 seconds. |
Low frequencies --- -5.1591 -0.2901 -0.0423 -0.0012 1.2790 1.3465
Low frequencies --- 263.3038 632.9632 638.4672
According to the item table, a minimum was reached for H3NBH3 as low frequencies are close to zero, lying within the range of ±15 cm-1 and low frequencies are low.
To find the association energy of H3NBH3, the following table was constructed.
| Energy | |
| BH3 (a.u.) | -26.61532363 |
| NH3 (a.u.) | -56.55776872 |
| H3NBH3 (a.u.) | -83.22468907 |
| Dissociation Energy (a.u.) | -0.05159672 |
| Dissociation Energy (kJ/mol) | -135.47 |
According to Table 17, H3NBH3 is more stable than the NH3 and BH3, due to the formation of a new dative covalent bond by the donation of a lone pair from the sp3 orbital on N to the empty p orbital on BH3, lowering the total energy of the whole system. So this process is spontaneous.
Mini Project: Investigating Aromaticity

The molecules as shown on Figure 8, are isoelectronic and have 6 π-electrons, resulting in the aromaticity as predicted by Hückel's rule (n=1). Starting from benzene as a reference molecule, the MOs of these four molecules, especially occupied π-MOs, were analysed in detail using computational methods to investigate the aromaticity and the effect of changing one C-H fragment on benzene to other isoelectronic fragments such as N+-H and B--H on chemical properties. In addition, NBO analysis was also carried out to give charge distribution patterns to predict the reactivities and regioselectivities.
Optimisation
First and foremost, the optimisations of the structures of these four molecules were completed using B3LYP method and 6-31G (d,p) basis set without restriction on symmetry. The information and results were summarised in the following tables.
| Benzene Optimisation | Boratabenzene Optimisation | Pyridinium Optimisation | Borazine Optimisation | |
| File Name | lx-Benzene-opt | lx-borataben-opt | lx-pyridinium-opt | lx-Borazine-opt |
| File Type | .log | .log | .log | .log |
| Calculation Type | FOPT | FOPT | FOPT | FOPT |
| Calculation Method | RB3LYP | RB3LYP | RB3LYP | RB3LYP |
| Basis Set | 6-31G(d,p) | 6-31G(d,p) | 6-31G(d,p) | 6-31G(d,p) |
| Charge | 0 | -1 | 1 | 0 |
| Spin | Singlet | Singlet | Singlet | Singlet |
| E(RB3LYP) (a.u.) | -232.2582028 | -219.0205229 | -248.6680607 | -242.6845997 |
| E(RB3LYP) (kJ/mol) | -609793.82 | -575038.30 | -652877.90 | -637168.32 |
| RMS Gradient Norm | 0.00000012 | 0.00000036 | 0.00000044 | 0.00000016 |
| Imaginary Freq | ||||
| Dipole Moment (Debye) | 0 | 9.2828 | 8.6349 | 0 |
| Point Group | C1 | C1 | C1 | C1 |
| Job cpu time | 0 days 0 hours 6 minutes 44.6 seconds. | 0 days 0 hours 8 minutes 24.0 seconds. | 0 days 0 hours 7 minutes 8.0 seconds. | 0 days 0 hours 9 minutes 47.4 seconds. |
| Dspace | DOI:10042/26155 | DOI:10042/26154 | DOI:10042/26152 | DOI:10042/26153 |
Item Table of Benzene:
         Item               Value     Threshold  Converged?
 Maximum Force            0.000000     0.000002     YES
 RMS     Force            0.000000     0.000001     YES
 Maximum Displacement     0.000002     0.000006     YES
 RMS     Displacement     0.000001     0.000004     YES
 Predicted change in Energy=-7.235345D-13
 Optimization completed.
    -- Stationary point found.
                           ----------------------------
                           !   Optimized Parameters   !
                           ! (Angstroms and Degrees)  !
 --------------------------                            --------------------------
 ! Name  Definition              Value          Derivative Info.                !
 --------------------------------------------------------------------------------
 ! R1    R(1,2)                  1.3963         -DE/DX =    0.0                 !
 ! R2    R(1,6)                  1.3963         -DE/DX =    0.0                 !
 ! R3    R(1,7)                  1.0863         -DE/DX =    0.0                 !
 ! R4    R(2,3)                  1.3963         -DE/DX =    0.0                 !
 ! R5    R(2,8)                  1.0863         -DE/DX =    0.0                 !
 ! R6    R(3,4)                  1.3963         -DE/DX =    0.0                 !
 ! R7    R(3,9)                  1.0863         -DE/DX =    0.0                 !
 ! R8    R(4,5)                  1.3963         -DE/DX =    0.0                 !
 ! R9    R(4,10)                 1.0863         -DE/DX =    0.0                 !
 ! R10   R(5,6)                  1.3963         -DE/DX =    0.0                 !
 ! R11   R(5,11)                 1.0863         -DE/DX =    0.0                 !
 ! R12   R(6,12)                 1.0863         -DE/DX =    0.0                 !
 ! A1    A(2,1,6)              120.0            -DE/DX =    0.0                 !
 ! A2    A(2,1,7)              120.0            -DE/DX =    0.0                 !
 ! A3    A(6,1,7)              120.0            -DE/DX =    0.0                 !
 ! A4    A(1,2,3)              120.0            -DE/DX =    0.0                 !
 ! A5    A(1,2,8)              120.0001         -DE/DX =    0.0                 !
 ! A6    A(3,2,8)              120.0            -DE/DX =    0.0                 !
 ! A7    A(2,3,4)              120.0001         -DE/DX =    0.0                 !
 ! A8    A(2,3,9)              120.0            -DE/DX =    0.0                 !
 ! A9    A(4,3,9)              120.0            -DE/DX =    0.0                 !
 ! A10   A(3,4,5)              120.0            -DE/DX =    0.0                 !
 ! A11   A(3,4,10)             120.0            -DE/DX =    0.0                 !
 ! A12   A(5,4,10)             120.0            -DE/DX =    0.0                 !
 ! A13   A(4,5,6)              120.0            -DE/DX =    0.0                 !
 ! A14   A(4,5,11)             120.0001         -DE/DX =    0.0                 !
 ! A15   A(6,5,11)             119.9999         -DE/DX =    0.0                 !
 ! A16   A(1,6,5)              120.0            -DE/DX =    0.0                 !
 ! A17   A(1,6,12)             120.0            -DE/DX =    0.0                 !
 ! A18   A(5,6,12)             120.0            -DE/DX =    0.0                 !
 ! D1    D(6,1,2,3)             -0.0001         -DE/DX =    0.0                 !
 ! D2    D(6,1,2,8)           -179.9999         -DE/DX =    0.0                 !
 ! D3    D(7,1,2,3)            179.9999         -DE/DX =    0.0                 !
 ! D4    D(7,1,2,8)              0.0001         -DE/DX =    0.0                 !
 ! D5    D(2,1,6,5)              0.0            -DE/DX =    0.0                 !
 ! D6    D(2,1,6,12)           180.0            -DE/DX =    0.0                 !
 ! D7    D(7,1,6,5)           -180.0            -DE/DX =    0.0                 !
 ! D8    D(7,1,6,12)             0.0            -DE/DX =    0.0                 !
 ! D9    D(1,2,3,4)              0.0002         -DE/DX =    0.0                 !
 ! D10   D(1,2,3,9)            180.0            -DE/DX =    0.0                 !
 ! D11   D(8,2,3,4)            180.0            -DE/DX =    0.0                 !
 ! D12   D(8,2,3,9)             -0.0001         -DE/DX =    0.0                 !
 ! D13   D(2,3,4,5)             -0.0001         -DE/DX =    0.0                 !
 ! D14   D(2,3,4,10)           179.9999         -DE/DX =    0.0                 !
 ! D15   D(9,3,4,5)           -180.0            -DE/DX =    0.0                 !
 ! D16   D(9,3,4,10)             0.0            -DE/DX =    0.0                 !
 ! D17   D(3,4,5,6)              0.0            -DE/DX =    0.0                 !
 ! D18   D(3,4,5,11)           180.0            -DE/DX =    0.0                 !
 ! D19   D(10,4,5,6)          -180.0001         -DE/DX =    0.0                 !
 ! D20   D(10,4,5,11)            0.0            -DE/DX =    0.0                 !
 ! D21   D(4,5,6,1)              0.0001         -DE/DX =    0.0                 !
 ! D22   D(4,5,6,12)           180.0            -DE/DX =    0.0                 !
 ! D23   D(11,5,6,1)          -179.9999         -DE/DX =    0.0                 !
 ! D24   D(11,5,6,12)            0.0            -DE/DX =    0.0                 !
 --------------------------------------------------------------------------------
 GradGradGradGradGradGradGradGradGradGradGradGradGradGradGradGradGradGrad
Item Table of Boratabenzene:
         Item               Value     Threshold  Converged?
 Maximum Force            0.000001     0.000002     YES
 RMS     Force            0.000000     0.000001     YES
 Maximum Displacement     0.000005     0.000006     YES
 RMS     Displacement     0.000001     0.000004     YES
 Predicted change in Energy=-2.592632D-12
 Optimization completed.
    -- Stationary point found.
                           ----------------------------
                           !   Optimized Parameters   !
                           ! (Angstroms and Degrees)  !
 --------------------------                            --------------------------
 ! Name  Definition              Value          Derivative Info.                !
 --------------------------------------------------------------------------------
 ! R1    R(1,2)                  1.4052         -DE/DX =    0.0                 !
 ! R2    R(1,5)                  1.4052         -DE/DX =    0.0                 !
 ! R3    R(1,6)                  1.0915         -DE/DX =    0.0                 !
 ! R4    R(2,3)                  1.3988         -DE/DX =    0.0                 !
 ! R5    R(2,7)                  1.0969         -DE/DX =    0.0                 !
 ! R6    R(3,8)                  1.0968         -DE/DX =    0.0                 !
 ! R7    R(3,12)                 1.5141         -DE/DX =    0.0                 !
 ! R8    R(4,5)                  1.3988         -DE/DX =    0.0                 !
 ! R9    R(4,10)                 1.0968         -DE/DX =    0.0                 !
 ! R10   R(4,12)                 1.5141         -DE/DX =    0.0                 !
 ! R11   R(5,11)                 1.0969         -DE/DX =    0.0                 !
 ! R12   R(9,12)                 1.2184         -DE/DX =    0.0                 !
 ! A1    A(2,1,5)              120.415          -DE/DX =    0.0                 !
 ! A2    A(2,1,6)              119.7929         -DE/DX =    0.0                 !
 ! A3    A(5,1,6)              119.7921         -DE/DX =    0.0                 !
 ! A4    A(1,2,3)              122.1794         -DE/DX =    0.0                 !
 ! A5    A(1,2,7)              117.4558         -DE/DX =    0.0                 !
 ! A6    A(3,2,7)              120.3648         -DE/DX =    0.0                 !
 ! A7    A(2,3,8)              116.012          -DE/DX =    0.0                 !
 ! A8    A(2,3,12)             120.0607         -DE/DX =    0.0                 !
 ! A9    A(8,3,12)             123.9274         -DE/DX =    0.0                 !
 ! A10   A(5,4,10)             116.0124         -DE/DX =    0.0                 !
 ! A11   A(5,4,12)             120.0605         -DE/DX =    0.0                 !
 ! A12   A(10,4,12)            123.9271         -DE/DX =    0.0                 !
 ! A13   A(1,5,4)              122.1798         -DE/DX =    0.0                 !
 ! A14   A(1,5,11)             117.4556         -DE/DX =    0.0                 !
 ! A15   A(4,5,11)             120.3645         -DE/DX =    0.0                 !
 ! A16   A(3,12,4)             115.1046         -DE/DX =    0.0                 !
 ! A17   A(3,12,9)             122.4473         -DE/DX =    0.0                 !
 ! A18   A(4,12,9)             122.4481         -DE/DX =    0.0                 !
 ! D1    D(5,1,2,3)              0.0002         -DE/DX =    0.0                 !
 ! D2    D(5,1,2,7)           -179.9999         -DE/DX =    0.0                 !
 ! D3    D(6,1,2,3)            180.0001         -DE/DX =    0.0                 !
 ! D4    D(6,1,2,7)              0.0            -DE/DX =    0.0                 !
 ! D5    D(2,1,5,4)             -0.0002         -DE/DX =    0.0                 !
 ! D6    D(2,1,5,11)          -180.0001         -DE/DX =    0.0                 !
 ! D7    D(6,1,5,4)           -180.0001         -DE/DX =    0.0                 !
 ! D8    D(6,1,5,11)             0.0            -DE/DX =    0.0                 !
 ! D9    D(1,2,3,8)           -180.0001         -DE/DX =    0.0                 !
 ! D10   D(1,2,3,12)            -0.0001         -DE/DX =    0.0                 !
 ! D11   D(7,2,3,8)              0.0            -DE/DX =    0.0                 !
 ! D12   D(7,2,3,12)           180.0001         -DE/DX =    0.0                 !
 ! D13   D(2,3,12,4)             0.0            -DE/DX =    0.0                 !
 ! D14   D(2,3,12,9)          -180.0            -DE/DX =    0.0                 !
 ! D15   D(8,3,12,4)           180.0            -DE/DX =    0.0                 !
 ! D16   D(8,3,12,9)             0.0            -DE/DX =    0.0                 !
 ! D17   D(10,4,5,1)           180.0001         -DE/DX =    0.0                 !
 ! D18   D(10,4,5,11)            0.0            -DE/DX =    0.0                 !
 ! D19   D(12,4,5,1)             0.0001         -DE/DX =    0.0                 !
 ! D20   D(12,4,5,11)         -180.0            -DE/DX =    0.0                 !
 ! D21   D(5,4,12,3)             0.0            -DE/DX =    0.0                 !
 ! D22   D(5,4,12,9)           180.0            -DE/DX =    0.0                 !
 ! D23   D(10,4,12,3)         -180.0            -DE/DX =    0.0                 !
 ! D24   D(10,4,12,9)            0.0            -DE/DX =    0.0                 !
 --------------------------------------------------------------------------------
 GradGradGradGradGradGradGradGradGradGradGradGradGradGradGradGradGradGrad
Item Table of Pyridinium
         Item               Value     Threshold  Converged?
 Maximum Force            0.000001     0.000002     YES
 RMS     Force            0.000000     0.000001     YES
 Maximum Displacement     0.000005     0.000006     YES
 RMS     Displacement     0.000001     0.000004     YES
 Predicted change in Energy=-4.632836D-12
 Optimization completed.
    -- Stationary point found.
                           ----------------------------
                           !   Optimized Parameters   !
                           ! (Angstroms and Degrees)  !
 --------------------------                            --------------------------
 ! Name  Definition              Value          Derivative Info.                !
 --------------------------------------------------------------------------------
 ! R1    R(1,2)                  1.3987         -DE/DX =    0.0                 !
 ! R2    R(1,5)                  1.3987         -DE/DX =    0.0                 !
 ! R3    R(1,6)                  1.0852         -DE/DX =    0.0                 !
 ! R4    R(2,3)                  1.3838         -DE/DX =    0.0                 !
 ! R5    R(2,7)                  1.0835         -DE/DX =    0.0                 !
 ! R6    R(3,8)                  1.0832         -DE/DX =    0.0                 !
 ! R7    R(3,12)                 1.3524         -DE/DX =    0.0                 !
 ! R8    R(4,5)                  1.3838         -DE/DX =    0.0                 !
 ! R9    R(4,10)                 1.0832         -DE/DX =    0.0                 !
 ! R10   R(4,12)                 1.3524         -DE/DX =    0.0                 !
 ! R11   R(5,11)                 1.0835         -DE/DX =    0.0                 !
 ! R12   R(9,12)                 1.0169         -DE/DX =    0.0                 !
 ! A1    A(2,1,5)              120.0616         -DE/DX =    0.0                 !
 ! A2    A(2,1,6)              119.9693         -DE/DX =    0.0                 !
 ! A3    A(5,1,6)              119.9691         -DE/DX =    0.0                 !
 ! A4    A(1,2,3)              119.0802         -DE/DX =    0.0                 !
 ! A5    A(1,2,7)              121.474          -DE/DX =    0.0                 !
 ! A6    A(3,2,7)              119.4458         -DE/DX =    0.0                 !
 ! A7    A(2,3,8)              123.9412         -DE/DX =    0.0                 !
 ! A8    A(2,3,12)             119.2362         -DE/DX =    0.0                 !
 ! A9    A(8,3,12)             116.8226         -DE/DX =    0.0                 !
 ! A10   A(5,4,10)             123.941          -DE/DX =    0.0                 !
 ! A11   A(5,4,12)             119.2366         -DE/DX =    0.0                 !
 ! A12   A(10,4,12)            116.8223         -DE/DX =    0.0                 !
 ! A13   A(1,5,4)              119.0801         -DE/DX =    0.0                 !
 ! A14   A(1,5,11)             121.4747         -DE/DX =    0.0                 !
 ! A15   A(4,5,11)             119.4452         -DE/DX =    0.0                 !
 ! A16   A(3,12,4)             123.3053         -DE/DX =    0.0                 !
 ! A17   A(3,12,9)             118.3472         -DE/DX =    0.0                 !
 ! A18   A(4,12,9)             118.3475         -DE/DX =    0.0                 !
 ! D1    D(5,1,2,3)             -0.0001         -DE/DX =    0.0                 !
 ! D2    D(5,1,2,7)           -180.0            -DE/DX =    0.0                 !
 ! D3    D(6,1,2,3)           -180.0002         -DE/DX =    0.0                 !
 ! D4    D(6,1,2,7)              0.0            -DE/DX =    0.0                 !
 ! D5    D(2,1,5,4)             -0.0002         -DE/DX =    0.0                 !
 ! D6    D(2,1,5,11)           179.9999         -DE/DX =    0.0                 !
 ! D7    D(6,1,5,4)           -180.0001         -DE/DX =    0.0                 !
 ! D8    D(6,1,5,11)             0.0            -DE/DX =    0.0                 !
 ! D9    D(1,2,3,8)            180.0            -DE/DX =    0.0                 !
 ! D10   D(1,2,3,12)             0.0003         -DE/DX =    0.0                 !
 ! D11   D(7,2,3,8)             -0.0001         -DE/DX =    0.0                 !
 ! D12   D(7,2,3,12)           180.0001         -DE/DX =    0.0                 !
 ! D13   D(2,3,12,4)            -0.0002         -DE/DX =    0.0                 !
 ! D14   D(2,3,12,9)          -180.0001         -DE/DX =    0.0                 !
 ! D15   D(8,3,12,4)           180.0001         -DE/DX =    0.0                 !
 ! D16   D(8,3,12,9)             0.0001         -DE/DX =    0.0                 !
 ! D17   D(10,4,5,1)           180.0            -DE/DX =    0.0                 !
 ! D18   D(10,4,5,11)           -0.0001         -DE/DX =    0.0                 !
 ! D19   D(12,4,5,1)             0.0002         -DE/DX =    0.0                 !
 ! D20   D(12,4,5,11)          180.0001         -DE/DX =    0.0                 !
 ! D21   D(5,4,12,3)             0.0            -DE/DX =    0.0                 !
 ! D22   D(5,4,12,9)          -180.0001         -DE/DX =    0.0                 !
 ! D23   D(10,4,12,3)          180.0002         -DE/DX =    0.0                 !
 ! D24   D(10,4,12,9)            0.0001         -DE/DX =    0.0                 !
 --------------------------------------------------------------------------------
 GradGradGradGradGradGradGradGradGradGradGradGradGradGradGradGradGradGrad
Item Table of Borazine
         Item               Value     Threshold  Converged?
 Maximum Force            0.000000     0.000002     YES
 RMS     Force            0.000000     0.000001     YES
 Maximum Displacement     0.000002     0.000006     YES
 RMS     Displacement     0.000001     0.000004     YES
 Predicted change in Energy=-9.528920D-13
 Optimization completed.
    -- Stationary point found.
                           ----------------------------
                           !   Optimized Parameters   !
                           ! (Angstroms and Degrees)  !
 --------------------------                            --------------------------
 ! Name  Definition              Value          Derivative Info.                !
 --------------------------------------------------------------------------------
 ! R1    R(1,12)                 1.1951         -DE/DX =    0.0                 !
 ! R2    R(2,8)                  1.0097         -DE/DX =    0.0                 !
 ! R3    R(3,11)                 1.1951         -DE/DX =    0.0                 !
 ! R4    R(4,7)                  1.0097         -DE/DX =    0.0                 !
 ! R5    R(5,10)                 1.1951         -DE/DX =    0.0                 !
 ! R6    R(6,9)                  1.0097         -DE/DX =    0.0                 !
 ! R7    R(7,10)                 1.4306         -DE/DX =    0.0                 !
 ! R8    R(7,11)                 1.4306         -DE/DX =    0.0                 !
 ! R9    R(8,11)                 1.4306         -DE/DX =    0.0                 !
 ! R10   R(8,12)                 1.4306         -DE/DX =    0.0                 !
 ! R11   R(9,10)                 1.4306         -DE/DX =    0.0                 !
 ! R12   R(9,12)                 1.4306         -DE/DX =    0.0                 !
 ! A1    A(4,7,10)             118.5662         -DE/DX =    0.0                 !
 ! A2    A(4,7,11)             118.566          -DE/DX =    0.0                 !
 ! A3    A(10,7,11)            122.8677         -DE/DX =    0.0                 !
 ! A4    A(2,8,11)             118.5661         -DE/DX =    0.0                 !
 ! A5    A(2,8,12)             118.5662         -DE/DX =    0.0                 !
 ! A6    A(11,8,12)            122.8677         -DE/DX =    0.0                 !
 ! A7    A(6,9,10)             118.5656         -DE/DX =    0.0                 !
 ! A8    A(6,9,12)             118.5656         -DE/DX =    0.0                 !
 ! A9    A(10,9,12)            122.8688         -DE/DX =    0.0                 !
 ! A10   A(5,10,7)             121.4341         -DE/DX =    0.0                 !
 ! A11   A(5,10,9)             121.434          -DE/DX =    0.0                 !
 ! A12   A(7,10,9)             117.1319         -DE/DX =    0.0                 !
 ! A13   A(3,11,7)             121.434          -DE/DX =    0.0                 !
 ! A14   A(3,11,8)             121.4341         -DE/DX =    0.0                 !
 ! A15   A(7,11,8)             117.132          -DE/DX =    0.0                 !
 ! A16   A(1,12,8)             121.434          -DE/DX =    0.0                 !
 ! A17   A(1,12,9)             121.4341         -DE/DX =    0.0                 !
 ! A18   A(8,12,9)             117.1319         -DE/DX =    0.0                 !
 ! D1    D(4,7,10,5)             0.0            -DE/DX =    0.0                 !
 ! D2    D(4,7,10,9)           180.0001         -DE/DX =    0.0                 !
 ! D3    D(11,7,10,5)         -180.0            -DE/DX =    0.0                 !
 ! D4    D(11,7,10,9)            0.0001         -DE/DX =    0.0                 !
 ! D5    D(4,7,11,3)             0.0            -DE/DX =    0.0                 !
 ! D6    D(4,7,11,8)          -180.0            -DE/DX =    0.0                 !
 ! D7    D(10,7,11,3)          180.0            -DE/DX =    0.0                 !
 ! D8    D(10,7,11,8)            0.0001         -DE/DX =    0.0                 !
 ! D9    D(2,8,11,3)             0.0001         -DE/DX =    0.0                 !
 ! D10   D(2,8,11,7)          -179.9999         -DE/DX =    0.0                 !
 ! D11   D(12,8,11,3)          179.9998         -DE/DX =    0.0                 !
 ! D12   D(12,8,11,7)           -0.0002         -DE/DX =    0.0                 !
 ! D13   D(2,8,12,1)            -0.0001         -DE/DX =    0.0                 !
 ! D14   D(2,8,12,9)           179.9999         -DE/DX =    0.0                 !
 ! D15   D(11,8,12,1)         -179.9998         -DE/DX =    0.0                 !
 ! D16   D(11,8,12,9)            0.0001         -DE/DX =    0.0                 !
 ! D17   D(6,9,10,5)             0.0            -DE/DX =    0.0                 !
 ! D18   D(6,9,10,7)           179.9999         -DE/DX =    0.0                 !
 ! D19   D(12,9,10,5)          180.0            -DE/DX =    0.0                 !
 ! D20   D(12,9,10,7)           -0.0001         -DE/DX =    0.0                 !
 ! D21   D(6,9,12,1)             0.0            -DE/DX =    0.0                 !
 ! D22   D(6,9,12,8)           180.0            -DE/DX =    0.0                 !
 ! D23   D(10,9,12,1)          180.0            -DE/DX =    0.0                 !
 ! D24   D(10,9,12,8)            0.0            -DE/DX =    0.0                 !
 --------------------------------------------------------------------------------
 GradGradGradGradGradGradGradGradGradGradGradGradGradGradGradGradGradGrad
All of optimisations were finished, deduced from the converged values of forces and displacements. Also, all of the gradient terms -DE/DX are zero. So an equilibrium was reached for each optimisation. Also, the computed energies are very negative according to Table 18, suggesting the stabilisation caused by aromaticity.
Frequency Analysis
To ensure the results for optimisations are minimum, frequency analyses of these molecules were carried based on optimised structures in the previous step.
| Benzene Frequency | Boratabenzene Frequency | Pyridinium Frequency | Borazine Frequency | |
| File Name | lx-benzene-freq | lx-Boratabenzene-Freq | lx-Pyridinium-freq | lx-Borazine-Freq |
| File Type | .log | .log | .log | .log |
| Calculation Type | FREQ | FREQ | FREQ | FREQ |
| Calculation Method | RB3LYP | RB3LYP | RB3LYP | RB3LYP |
| Basis Set | 6-31G(d,p) | 6-31G(d,p) | 6-31G(d,p) | 6-31G(d,p) |
| Charge | 0 | -1 | 1 | 0 |
| Spin | Singlet | Singlet | Singlet | Singlet |
| E(RB3LYP) (a.u.) | -232.258202 | -219.020523 | -248.6680609 | -242.6845992 |
| E(RB3LYP) (kJ/mol) | -609793.82 | -575038.30 | -652877.90 | -637168.32 |
| RMS Gradient Norm | 0.00000045 | 0.00000868 | 0.00002064 | 0.00000152 |
| Imaginary Freq | 0 | 0 | 0 | 0 |
| Dipole Moment (Debye) | 0 | 2.84 | 1.87 | 0 |
| Point Group | D6h | C2v | C2v | D3h |
| Job cpu time | 0 days 0 hours 2 minutes 50.3 seconds. | 0 days 0 hours 4 minutes 19.3 seconds. | 0 days 0 hours 4 minutes 21.4 seconds. | 0 days 0 hours 3 minutes 32.2 seconds. |
| Low Frequencies Line 1 | -10.2160 -5.5939 -5.5939 -0.0056 -0.0055 0.0008 | -7.0558 -0.0007 0.0003 0.0004 3.7283 4.7592 | -9.3463 -2.9476 -0.0006 -0.0004 0.0002 1.5571 | -3.7961 -3.7936 -3.2442 -0.0037 0.0164 0.0253 |
| Low Frequencies Line 2 | 414.5469 414.5469 621.0423 | 371.2949 404.4219 565.0804 | 391.9229 404.3452 620.2019 | 289.7365 289.7373 404.5429 |
| Dspace | DOI:10042/26156 | DOI:10042/26159 | DOI:10042/26157 | DOI:10042/26158 |
It can be deduced from Table 19 that all of the optimised structures obtained are minimum, indicated by the first line of low frequencies as all the frequencies are close to zero and lie within the range of ± 15 cm-1. In addition, the low frequencies are low compared to real frequencies.
To further verify the validity of the optimised structures, the computed bond lengths and angles and literature values were presented as follows.
| Benzene | Computed Values | Literature Values |
| C-C Length (Å) | 1.40 | 1.40[1] |
| C-H Length (Å) | 1.10 | 1.10[1] |
| Pyridinium | Computed Values | Literature Values |
| C-N+ (Å) | 1.36 | 1.39[2] |
| Borazine | Computed Values | Literature Values |
| B-N (Å) | 1.44 | 1.44[3] |
| B-N-B Angle (o) | 117 | 118[3] |
| Boratabenzene | Computed Values | Literature Values |
| C-B- Length (Å) | 1.51 | 1.45 and 1.48 [4] |
| C-B--C Angle (o) | 116 | 116 [4] |
It can be deduced from Table 20 that the computed bond lengths and bond angles that are close to literature values,confirming the optimisations were successful. So the method and basis set used are reliable enough to produce bond lengths and bond angles for the molecules under investigation.
To compare IR spectra of different molecules, the following table was constructed.
| ' | IR Spectrum |
| Benzene | 
|
| Boratabenzene | 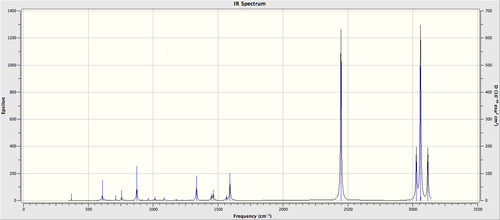
|
| Pyridinium | 
|
| Borazine | 
|
It is clear from Table 21 that benzene produces the simplest IR spectrum due to the most symmetrical structure, causing the greatest number vibrations to be IR inactive due to the cancellation in dipole moments. This is followed by borazine as its structure is more symmetrical than pyridinium and boratabenzene which have the least symmetrical structures. Consequently, pyridinium and boratabenzene have the most complex IR spectra.
References
- ↑ 1.0 1.1 David R. Lide, ed., CRC Handbook of Chemistry and Physics,Internal Version 2005, 9-25. Cite error: Invalid
<ref>tag; name "Benzene" defined multiple times with different content - ↑ David R. Lide, ed., CRC Handbook of Chemistry and Physics, Internal Version 2005, 9-7.
- ↑ 3.0 3.1 David R. Lide, ed., CRC Handbook of Chemistry and Physics, Internal Version 2005, 9-16. Cite error: Invalid
<ref>tag; name "Borazine" defined multiple times with different content - ↑ 4.0 4.1 D. A. Hoic, W. M. Davis and G. C. Fu, Journal of the American Chemical Society, 1995, 117, 8480-8481.
Investigating Molecular Orbitals
MO calculations were completed based on the optimised structures in the previous step by the consistent method (B3LYP) and basis set (6-31G (d,p)). The information was presented in the following table.
| File Name | Benzene MO | Boratabenzene MO | Pyridinium-MO | Borazine-MO |
| File Type | .fch | .fch | .fch | .fch |
| Calculation Type | SP | SP | SP | SP |
| Calculation Method | RB3LYP | RB3LYP | RB3LYP | RB3LYP |
| Basis Set | 6-31G(D,P) | 6-31G(D,P) | 6-31G(D,P) | 6-31G(D,P) |
| Charge | 0 | -1 | 1 | 0 |
| Spin | Singlet | Singlet | Singlet | Singlet |
| Total Energy (a.u.) | -232.2582107 | -219.0205306 | -248.668074 | -242.6845983 |
| Total Energy (kJ/mol) | -609793.84 | -575038.32 | -652877.93 | -637168.32 |
| RMS Gradient Norm | 0 | 0 | 0 | 0 |
| Imaginary Freq | ||||
| Dipole Moment (Debye) | 0.00 | 2.85 | 1.87 | 0.00 |
| Point Group | ||||
| Dspace | DOI:10042/26171 | DOI:10042/26170 | DOI:10042/26168 | DOI:10042/26169 |
To construct a basis for the comparison of MOs, the central part of the MO diagram of benzene was drawn, including both σ and π orbitals. Orbitals 1-6 was not included as they are formed from 1s orbitals of carbon, which are very stable and have little effect on bonding. Each LCAOs was drawn by desconstructing the corresponding MO.
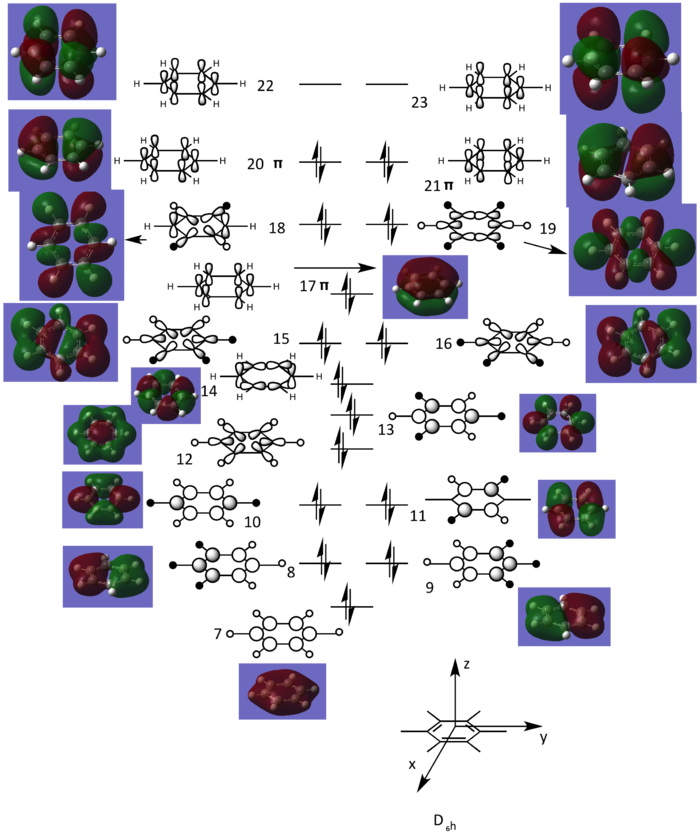
From Figure 9, MO 17, 20 and 21 are π orbitals, formed by the side-on overlap between 2p orbitals on each carbon. This means there are totally 6 π-electrons for the whole system, obeying Hückel's rule (n=1). Moreover, the π-electron density is delocalised across the six-membered ring. So the aromaticity presents in the system.
MOs 17,20,21 were chosen to be compared among benzene, boratabenzene, pyridinium and borazine. Because they are π-bonding MOs, which have more effect on reactivity than σ-bonding MOs. Also, MOs 21 are HOMOs in all of the four isoelectronic molecules,which can be studied to give more insight to reactivity. The following table was constructed.
MOs presented in Table 23 are similar to some extent. They are all π-bonding MOs apart from MO 21 of boratabenzene which is almost non-bonding, deduced from the signs of energies. All of the MOs are occupied. This means totally 6 π-electrons exist. So aromaticity presents in all of the four isoelectronic molecules under investigation.
However, MOs of the same orbital number are different in shapes and energies. It can be deduced from Table 23 that the AOs of boron contribute the least to the MOs, due to the least elctronegativity. For example, the degree of the curvature of the electrodensity for MO 17 of boratabenzene is smaller in the region adjacent to boron compared to the region adjacent to each carbon, suggesting less contribution from corresponding AOs. According to the same reason, nitrogen has the largest LCAOs contribution, which can be deduced from MO 17 for pyridinium, indicated by the greater curvature around it.
By comparing the energies of orbitals in similar shapes, there is a general trend that B--H fragment increases the energy while N+-H fragment decreases the energy. This can be rationalised by more electronegative N-H fragment lowers the energy of corresponding AOs, and hence the energy of corresponding MOs is lowered as well according to LCAO theory. This situation is reversed for B--H fragment as boron is less electronegative than carbon. For instance, MO 17 is the most stable for pyridinium while the least stable for boratabenzene. As for borazine, all of C-H fragments are replaced by either N+-H or B--H, so energies for MOs were closer to benzene compared to boratabenzene and pyridinium. Due to the effect of N+-H and C-H fragments on energies, the degenracy between MOs 20 and 21 is broken from benzene to boratabenzene and pyridinium. But, these two orbitals are much closer in energy for borazine, because of the equal number of N+-H and B--H fragments, resulting in some change in energy being cancelled.
Interestingly, MOs formed by the combination of three 2p orbitals on each side of six-membered rings have different orbital numbers for boratabenzene and pyridinium (21 for boratabenzene and 20 for pyridinium), suggesting the order of MOs is reversed from pyridinium to boratabenzene. This can be explained by evaluating the anti-bonding character between two lobes of different colors as labelled on Table 23. Also, this due to the electropositive nature of boron which rises the energy of corresponding AOs and MOs, and electronegative nitrogen lowers the energy of the MO in this type.
Regarding the full MO diagram, it can be concluded from the argument stated above that substitution of a C-H fragment to a N+-H fragment generally decreases the energies of the MOs involving this fragment and hence lowers the energy of the whole system as indicated on Table 18. This situation is reversed for the substitution of a B--H fragment. The number of degenrate orbitals on the full MO diagram is therefore reduced for pyridinium, boratabenzene and borazine in comparison to benzene.
NBO Analysis
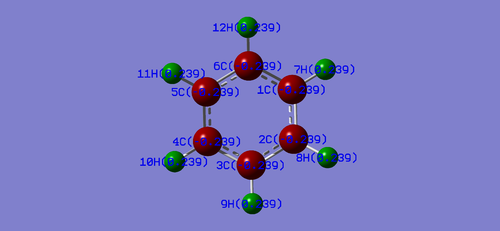
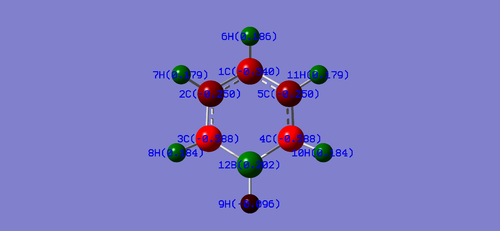
To compare the reactivity, the pattern of charge distribution of molecules was predicted by NBO analysis with a color range of -0.5-0.5.
It is clear from Table 24 that benzene has the most symmetrical charge distribution as all of the fragments are the same, and it has the narrowest charge range, resulting from the less polarity of the C-C and C-H bonds and hence less nucleophilicity and electrophilicity. This distribution pattern is broken in other three molecules due to substitutions of polar fragments. Consequently, addition reactions are extremely hard for benzene. So benzene is the most unreactive compound. Borazine has the widest charge range, resulting from polar B-N,N-H and B-H bonds, making addition reactions relatively easy due to more nucleoophilic and electrophilic nature.
For pyridinium, it is interesting to see that ortho and para carbons are more positive than meta carbons. Same situation exists in borazine, where ortho and para carbons are more negative than meta carbons as shown on Table 24. This is illustrated in terms of resonance structures on Figure 10.

According to Figure 10, the positive and negative charges are more likely on para and meta carbons than meta carbons. Therefore, meta carbons have the least positive or negative charge as shown on Table 24. There are 2 resonace forms for ortho carbons while only one resonance form for para carbon. This verifies the result of patterns of charge distribution where ortho carbons are more positive or negative than para carbons. It can be inferred that reactions such as nucleophilic and electrophilic substitutions are most likely to happen at ortho carbons of pyridinium and boratabenzene respectively, due to the polarity of C-B and C-N bonds.
Conclusion
This project focuses using computational methods to investigate the aromaticity of four isoelectronic compounds as shown on Figure 8. The optimisations were judged to successfully finish because the optimised bond lengths and angles are fairly close to literature values. In addition, all of the forces and displacements are converged and gradient terms are zero according to item tables. Frequency analysis shows that boratabenzene and pyridinium produce more complex IR spectra than benzene due to the less symmetrical structures. From MO analysis, substitution of the C-H fragment to the N+-H fragment decreases the energies of the corresponding MOs due to more electronegativity of nitrogen, while substitution of the B--H increases the corresponding energies. This explains why pyridinium has the most negative energy while boratabenzene has the most positive energy, which can be seen from Tables 22 and 23. The degenracy of certain MOs is broken as a result of the substitutions. NBO analysis reveals borazine is the most reactive compound and benzene is the least reactive, indicated by the charge ranges. So borazine is the most susceptible to addition reactions across the polar B-N bonds. Substitutions of N+-H and B--H fragments on benzene to produce pyridinium and boratabenzene can activate ortho positions on the six-membered ring, deduced from charge distributions and resonance forms, making further reactions such as substitutions and additions possible at ortho positions for the resulting aromatic compounds compared to benzene. Overall, the computational method is reliable enough to predict structure, molecular orbitals and reactivities for the molecules under investigation.
Future Works
Several future works can be completed to establish a better overview of the aromaticity.
- Investigate MOs and NBOs of aromatic molecules such as naphthalene, quinolinium and isoquinolinium the effect of the ring size on aromatic stabilisation, reactivity and regioselectivity.
- Fully compute cyclopentadienyl anion, which also has 6 π-electrons, to find similarities and differences with the molecules investigated in this project.
- Rather than predict reactivities from NBO and MO analysis, we can model the transition states for borazine, boratabenzene and pyridinium for additions and substitutions to further understand reactivities and regioselectivities.

