Rep:Mod:lt912 organic
Organic Synthesis Computational Experiment
Part 1: Cyclopentadiene and Taxol
Conformational Analysis Using Molecular Mechanics
Dimerisation of Cyclopentadiene
Background
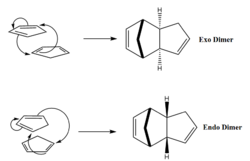
The dimerisation of cyclopentadiene is a Diels-Alder [4πS + 2πS] cycloaddition reaction. As such, it exhibits great stereoselectivity in accordance with the Woodward-Hoffman rules. Furthermore the reaction is spontaneous due to a small activation energy barrier. This is a result of the transition state being stabilized through aromaticity. There are two possible isomers of the product, which are shown in figure 1. The exo product would be expected to predominate under thermodynamic conditions as it is lower in energy than the endo product, which is expected to predominate under kinetic conditions due to a lower energy transition state.
In the case of dimerisation of cyclopentadiene the endo isomer is the major product up until very high temperatures[1]. It can therefore be deduced that the reaction is under kinetic control, which is a result of the two transition states having significantly different energies. This is a result of the endo transition state being significantly stabilised by secondary orbital overlap.
As shown in figure 1, the exo dimer is formed when the non participating double bond is pointed away from the approaching cyclopentadiene. The endo dimer on the other hand is formed when the non participating double bond falls below the approaching diene. This approach allows the non participating double bond to form an overlap with the π system of the approaching cyclopentadiene. This non-bonding interaction is called a secondary orbital overlap and significantly lowers the energy of the transition state, resulting in the reaction proceeding under kinetic control even at ambient temperature.
The simulations performed below are designed to find the relative stability of the two isomers and confirm if the reaction is under kinetic or thermodynamic control.
Results and Discussion
The two isomers of the cyclopentadiene dimer were drawn using Avogadro and had their structures optimized using the MMFF94s force field with the conjugate gradients algorithm. The optimized structures then had an energy calculation performed using the same settings.
| Endo Dimer | Exo Dimer | Difference | |||||
|---|---|---|---|---|---|---|---|
| Model | CH2 bridge group bond angle: 0.1° Junction of dienes bond angle: 3.1° | ||||||
| Total Bond Stretching Energy / kcal mol-1 | 3.46730 | 3.53954 | -0.07224 | ||||
| Total Angle Bending Energy / kcal mol-1 | 33.18858 | 30.77220 | 2.41638 | ||||
| Total Stretch Bending Energy / kcal mol-1 | -2.08235 | -2.04060 | -0.04175 | ||||
| Total Torsional Energy / kcal mol-1 | -2.95137 | -2.69990 | -0.25147 | ||||
| Total Out-of-Plane Bending Energy / kcal mol-1 | 0.02208 | 0.01545 | 0.00663 | ||||
| Total Van der Waals Energy / kcal mol-1 | 12.35958 | 12.78082 | -0.42124 | ||||
| Total Electrostatic Energy / kcal mol-1 | 14.18705 | 13.01311 | 1.17394 | ||||
| Total Energy / kcal mol-1 | 58.1908670 | 55.38061 | 2.810257 |
The results show that, as expected, the endo dimer is higher in total energy than its exo counterpart by 2.81 kcal mol-1. A more in depth analysis of the component energies reveals that while most energies such as stretch bending and out-of-plane bending stay largely the same and are often in fact higher for the exo dimer, the angle bending and electrostatic energies are significantly greater in the endo dimer. The angle bending energy difference alone account for 86 % of the total difference. It is therefore possible to conclude that the endo product is higher in energy predominantly due to a more sterically strained structure.
The two most likely areas of the dimers to experience most of the sterical strain are the CH2 bridge and the carbons connecting both dienes. The latter is strained due to the presence of two large groups, the repulsion between which will result in a large distortion from ideality. It can be seen from the model that the bridging CH2 angle is approximately the same and it therefore does not contribute to the significantly to the energy difference. The angle between the two dienes is however much more strained in the endo form than in exo, this can be deduced from the fact that it is further away from the ideal 109.5° bond angle of an sp3 carbon (9.1° vs 6.2°). It should be noted that there are two such strained bonds, increasing the effect.
These results therefore demonstrate that the dimerisation of cyclopentadiene is kinetically controlled. This is concluded on the basis of two pieces of information. The endo dimer is higher in energy and the major product at room temperature[1]. This outcome is only possible under kinetic control and supported by the Fox paper[1]. This conclusion should however be verified with transition state analysis.
Hydrogenation of Cyclopentadiene Endo Dimer
Background
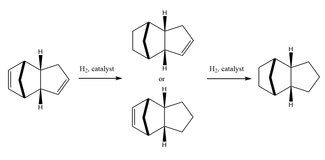
It has been observed[2], that the hydrogenation of the endo dimer investigated above is a 2 step reaction. The initial step forms a stable, singly unsaturated system. The fully saturated product is only obtained after extended catalytic hydrogenation. The reaction scheme for this process is shown in Figure 2. Experimental results show that the intermediate with the saturated bond in the norbornene ring is formed preferentially[3].
In order to determine whether the origin of this selectivity is due to kinetic or thermodynamic control a series of optimizations and energy calculations were run on both possible intermediates.
Results and Discussion
Both intermediates had their structures optimized using the MMFF94s force field and conjugate gradients algorithm. The optimized structures then had an energy calculation performed with the same settings.
| Product A | Product B | Difference | |||||
|---|---|---|---|---|---|---|---|
| Model | Hydrogen Distance between CH2 Bridging Group and pentane/pentene ring: 0.82 Å Hydrogen Distance across Double Bond: 0.07 Å Hydrogen Distance on Carbons connecting 2 rings: 0.05 Å Angle Difference at sp2 carbon: 5.5° Angle Difference in norbornene ring: 2.7° | ||||||
| Total Bond Stretching Energy / kcal mol-1 | 3.38524 | 2.81334 | 0.5719 | ||||
| Total Angle Bending Energy / kcal mol-1 | 28.63105 | 24.76178 | 3.86927 | ||||
| Total Stretch Bending Energy / kcal mol-1 | -1.86534 | -1.64862 | -0.21672 | ||||
| Total Torsional Energy / kcal mol-1 | 1.58834 | -0.32932 | 1.91766 | ||||
| Total Out-of-Plane Bending Energy / kcal mol-1 | 0.01598 | 0.00038 | 0.0156 | ||||
| Total Van der Waals Energy / kcal mol-1 | 13.75400 | 10.56194 | 3.19206 | ||||
| Total Electrostatic Energy / kcal mol-1 | 5.11261 | 5.14740 | -0.03479 | ||||
| Total Energy / kcal mol-1 | 50.62189 | 41.30691 | 9.31498 |
The results show that Product A, containing the unsaturated bond in the norbornene ring, is significantly higher in energy than Product B. The total difference of 9.31 kcal mol-1 is a result of it being higher in energy by in every aspect except electrostatic and stretch bending energies. In these cases it is still only very slightly more stable. The major contribution to this difference is the angle bending energy, which compromises 42 % of the total difference. This is followed closely by Van der Waals energy which accounts for a further 34 %.
In order to determine which features of the molecules cause this difference certain bond angles and atomic distances are highlighted. Since in Product A the angle bending energy is higher it is necessary to look for bond angles which are further away from ideality in Product A than in Product B. In order to locate the features causing the difference in Van der Waals energy one must look either for atoms closer together in Product A than in Product B, as these may either experience a greater Van der Waals repulsion force resulting in destabilization or a greater attractive force causing greater stabilization. Which one is experienced depends on the actual distance. Hydrogen distances below are 2.1 Å are destabilizing while distances closer to 2.4 Å are more stabilizing than those further away.
Bearing this in mind, 3 notable hydrogen distances have been identified. The Van der Waals interactions which destabilize Product A relative to B are as follows. The major difference in Van der Waals interaction, causing the bulk of the energetic difference, is due to the fact that in the saturated norbornene ring in Product B the sp3 hybridized carbon forces its hydrogen atom to be close to the hydrogen on the CH2 bridging group. A distance of 2.60 Å, resulting in a favorable interaction. By contrast, the equivalent, unsaturated carbon in Product A is sp2 hybridized. This forces its hydrogen atom to be much further away from the CH2 bridging group hydrogen. A distance of 3.42 Å. This is a much weaker interaction action (difference of 0.82 Å) and is much less stabilizing. There is a further, less destabilizing interaction between the two hydrogen atoms on opposite ends of the double bond, in this case Product B is 0.07 Å closer to 2.4 Å. Again resulting in B being relatively more stabilized. Finally in Product B the hydrogen atoms on carbons connecting the norbornene and cyclopentene rings are closer to 2.4 Å by 0.05 Å than in Product A.
The bond angles which contribute to the energetic difference in the Angle bending category are the ones at the sp2 carbons on the double bond as well as internally in the norbornene ring. In both products these angles are distorted, but more so in Product A than B, resulting in it being relatively destabilized. The greater difference is at the sp2 carbons, where Product B is 5.5° closer to the ideal 120° angle. Furthermore the angle at the sp3 carbon connected to the CH2 bridging group in norbornene is 2.7° closer to the ideal 109.5° angle.
It is therefore possible to conclude that since the more thermodynamically stable Product B is formed preferentially, the reaction is under thermodynamic control.
Background

The next investigation concerns a key intermediate in the synthesis of taxol. The intermediate is synthesized via an oxy-Cope rearrangement which can result in either isomer depicted in Figure 3[4]. These are atropisomers and present as a result of the rotation of the carbonyl group being severly hindered. However after a sufficient time only the thermodynamically more stable isomer will be present. The investigation below is concerned with finding this isomer.
In order to carry out a complete and thorough investigation, all conformational isomers of each atropisomer have to be taken into account. These more specific isomers are a result of the fact the intermediate in this case consists of 2 rings. In cases of conjugated rings, it is the smallest ring that determines the total number of conformers. This is because smaller rings are more rigid and have fewer conformers. In other words, bigger rings can adjust to each conformation of a smaller ring, but smaller rings cannot adjust to all the conformations of a big ring. In the intermediate examined here the smaller ring is cyclohexane, which has 4 conformers, two boats and two twist boats. As a result there are four of each atropisomer, one corresponding to each cyclohexane conformation.
Results and Discussion
In all the simulations performed below a MMFF94s force field was used along with the conjugated gradients algorithm to optimize the structures. Energy calculations were then performed with the same settings.
| Chair 1 | Twist Boat 1 | Twist Boat 2 | Chair 2 | |||||||||
|---|---|---|---|---|---|---|---|---|---|---|---|---|
| Model | ||||||||||||
| Total Bond Stretching Energy / kcal mol-1 | 7.62287 | 7.76660 | 8.92267 | 8.20184 | ||||||||
| Total Angle Bending Energy / kcal mol-1 | 18.89908 | 19.04875 | 28.36705 | 26.83186 | ||||||||
| Total Stretch Bending Energy / kcal mol-1 | -0.14206 | -0.14198 | -0.31992 | -0.16979 | ||||||||
| Total Torsional Energy / kcal mol-1 | 0.27127 | 3.91084 | 5.46627 | -0.68602 | ||||||||
| Total Out-of-Plane Bending Energy / kcal mol-1 | 0.85434 | 0.96420 | 1.10194 | 1.05174 | ||||||||
| Total Van der Waals Energy / kcal mol-1 | 33.13711 | 34.89589 | 38.75141 | 35.29763 | ||||||||
| Total Electrostatic Energy / kcal mol-1 | -0.05052 | -0.04808 | 0.53841 | 0.17751 | ||||||||
| Total Energy / kcal mol-1 | 60.59208 | 66.39622 | 82.82784 | 70.70477 |
It is clear from these results that the most stable conformer of the ketone down intermediate is Chair 1. This can be expected from due to the fact that boats are lower in energy than twist boats in cyclohexane. It is therefore somewhat surprising that the second most stable conformation is not the other chair, but rather one of the twist boats. In order to understand why one chair is so much less stable than the other a more detailed look at the energetic contributions is necessary. From this it is obvious that the primary reason why Chair 2 is higher in energy is due to having a much larger angle bending energy. The origin of this large difference cannot be attributed to a small number of highly different bond angles. It in fact seems to be a result of a almost all bond angles being closer to the ideal angle by a few degrees in Chair 1.
| Chair 1 | Twist Boat 1 | Twist Boat 2 | Chair 2 | |||||||||
|---|---|---|---|---|---|---|---|---|---|---|---|---|
| Model | ||||||||||||
| Total Bond Stretching Energy / kcal mol-1 | 7.63492 | 9.00715 | 7.91814 | 8.64025 | ||||||||
| Total Angle Bending Energy / kcal mol-1 | 28.29529 | 30.64572 | 29.24532 | 33.79212 | ||||||||
| Total Stretch Bending Energy / kcal mol-1 | -0.07780 | -0.19240 | 0.05027 | 0.09391 | ||||||||
| Total Torsional Energy / kcal mol-1 | 0.35834 | 8.30265 | 3.21308 | 3.01852 | ||||||||
| Total Out-of-Plane Bending Energy / kcal mol-1 | 0.97714 | 1.91880 | 0.96410 | 1.59409 | ||||||||
| Total Van der Waals Energy / kcal mol-1 | 33.06841 | 39.56836 | 34.74543 | 35.61643 | ||||||||
| Total Electrostatic Energy / kcal mol-1 | 0.30708 | 0.41647 | 0.31162 | 0.18858 | ||||||||
| Total Energy / kcal mol-1 | 70.56338 | 89.66676 | 76.44797 | 82.94390 |
An analysis of the ketone up atropisomer reveals that Chair 1 is the lowest energy conformer. Similarly to the ketone down isomer, the second lowest conformer is not the other chair but rather a twist boat. In this case however the difference in energy is a result of a similar increase in angle bending, torsional and Van der Waals energies.
In order to determine the dominant atropisomer the lowest energy conformation of each should be compared. This shows that the ketone down is more stable and therefore dominant by 9.9713 kcal mol-1. The origin of this difference is almost entirely due to greater angle bending energy of the ketone up atropisomer, taking into account approximately 94 % of the total. This can again be attributed to the fact that over the entire structure almost all of the ketone up bond angles deviate from ideality more than in the ketone down isomer.
Hyperstability in an Intermediate Related to the Synthesis of Taxol
Background
Hyperstable alkenes were originally proposed in 1981 by Maier et al.[5] when describing the reactivity of bridgehead alkenes. Bridgehead alkenes are generally associated with being rather unstable compounds, with certain configurations being impossible to synthetize due to their instability. The origin of their instability is rationalized as a result of steric strain. However in their work Maier et al. described a new class of bridgehead alkenes where the parent hydrocarbon is less stable than the alkene[5]. This results in the alkene being abnormally unreactive. Due to the intermediate investigated in the section above being both a bridgehead alkene and reportedly having abnormally long reaction times, it is of some interest to determine whether it is due to being a hyperstable alkene.
Results and Discussion
The structures of both species were optimized using the MMFF94s force field and conjugate gradients algorithm, followed by an energy calculation with the same settings. The isomer with the lowest energy determined in the previous section was used to represent the alkene, as this will be the dominant conformation.
| Alkene | Alkane | Difference | |||||
|---|---|---|---|---|---|---|---|
| Model | Difference in Deviation from ideal angle between sp2 and sp3 carbon 1: 6.5° Difference in Deviation from ideal angle between sp2 and sp3 carbon 2: 8.1° | ||||||
| Total Bond Stretching Energy / kcal mol-1 | 7.62287 | 6.69541 | -0.92746 | ||||
| Total Angle Bending Energy / kcal mol-1 | 18.89908 | 24.69167 | 5.79259 | ||||
| Total Stretch Bending Energy / kcal mol-1 | -0.14206 | 0.44012 | 0.58218 | ||||
| Total Torsional Energy / kcal mol-1 | 0.27127 | 8.14725 | 7.87598 | ||||
| Total Out-of-Plane Bending Energy / kcal mol-1 | 0.85434 | 0.07367 | -0.78067 | ||||
| Total Van der Waals Energy / kcal mol-1 | 33.13711 | 31.50463 | -1.63248 | ||||
| Total Electrostatic Energy / kcal mol-1 | -0.05052 | 0 | 0.05052 | ||||
| Total Energy / kcal mol-1 | 60.59208 | 71.55276 | 10.96068 |
These results show that the parent alkane is in fact more unstable than the alkene. This goes a long way in explaining why the alkene is so unreactive - the products are higher in energy than the reactants. The origin of this instability can be attributed to two main components. Firstly, the alkane experiences a great deal more torsional strain, this accounts for 55 % of the energy increase. Torsional strain arises due to an eclipse of atoms on two sides a C-C bond. In the case of the alkane, the addition of new substituent means that a new eclipsed relationship is formed between the two added hydrogen atoms on either side of the single bond (highlighted). The alkene carbon has no hydrogens to take up such a position. The result is that the alkene is stabilized relative to the alkane.
The next significant contribution to the increase in energy of the alkane relative to the alkene is the angle bending energy, this accounts for a further 40 % of the energy increase. The origin of this increase is due to the sp3 carbon atoms on the alkane deviating more from their ideal angle (109.5°) than the equivalent sp2 carbon atoms (ideal angle = 120°). More specifically, the alkane carbon angles deviate from ideality by 11.9° and 9° whereas the alkene carbon angles deviate from ideality by 2.5° and 3.8° - a significant difference.
Spectroscopic Simulation using Quantum Mechanics
Structure Optimization and Energy Calculation of Taxol Intermediate Derivative
Background
In order to simulate the spectrum of a molecule its dominant conformation or conformations must first be found. This is because the overall NMR spectrum will be a weighted average of its conformational profile, with the more abundant conformations having greater impact. Since the abundance of a conformation is a function of its thermodynamic stability, a series of energy calculations have to be performed. Using the information obtained in the previous sections, it is clear that a the ketone down, chair conformer will be the lowest energy and therefore dominant conformation of the taxol intermediate derivatives. However in order to make use of the all the energy information obtained in the sections below, the ketone down twist boat conformer was also evaluated. The relative energies of these conformations can then be used to asses which one has a greater impact on the total NMR spectrum.
The initial optimization is performed using a simple, quick force field / algorithm. This allows a quick scan of the potential energy surface in order to find an approximate minimum. Once this is carried out a more rigorous QM optimization is performed in order to be able to simulate NMR spectra.
Results and Discussion
Below are optimizations performed using the MMFF94s force field with the conjugate gradients algorithm. The energy calculations were then performed with the same settings.
| Ketone Down Chair Conformer | Ketone Down Twist Boat Conformer | Ketone Up Chair Conformer | |||||||
|---|---|---|---|---|---|---|---|---|---|
| Model | |||||||||
| Total Bond Stretching Energy / kcal mol-1 | 15.00061 | 14.67117 | 15.90151 | ||||||
| Total Angle Bending Energy / kcal mol-1 | 30.93319 | 29.22240 | 31.50315 | ||||||
| Total Stretch Bending Energy / kcal mol-1 | 0.67074 | 0.53738 | 0.18094 | ||||||
| Total Torsional Energy / kcal mol-1 | 9.66559 | 12.73196 | 11.42992 | ||||||
| Total Out-of-Plane Bending Energy / kcal mol-1 | 0.88528 | 0.94195 | 1.23769 | ||||||
| Total Van der Waals Energy / kcal mol-1 | 49.45618 | 50.74122 | 51.93862 | ||||||
| Total Electrostatic Energy / kcal mol-1 | -6.04769 | -5.81169 | -7.50771 | ||||||
| Total Energy / kcal mol-1 | 100.56390 | 103.03440 | 104.68413 |
It is clear from these preliminary calculations that the chair ketone down conformer is the lowest in energy, as expected. It is interesting however that the energy difference with the ketone up chair is less than in the original intermediate. However the ordering of relative energy remains the same and as a result the other conformations were not calculated, the assumption being that the ordering will remain the same as in the original taxol intermediate. Initially the ketone down chair and ketone up structures were reoptimized at the B3LYP/6-31G(d,p) level of theory and had an NMR and frequency calculation performed. However since no reference was found at the same level of theory the NMR data is useless. The energy data was still used in the calculations below in order to find relative concentrations of these two conformers.
Next the two ketone down conformers were re-optimized using B3LYP/6-311+G(2d,p) level of theory. This level of theory was chosen because a TMS reference has been optimized by default in gaussian at this level, allowing meaningful chemical shifts to be calculated. DOI links to these calculations are not present as the calculations crashed at some point during the frequency analysis and the HPC website does not seem to be able to publish the results, despite the log file being downloadble and containing valid NMR data (NMR calculations were performed before frequency analysis).
| Isomer | Free Energy / hartrees |
|---|---|
| Ketone Down Chair DOI:10.14469/ch/139424 | -1651.463259 |
| Ketone Up DOI:10.14469/ch/139383 | -1651.461191 |
Using this free energy difference the equilibrium constant between the conformers can be calculated. This can then provide a quantitative measure of the relative concentration of one conformer relative to the other. An assessment of the relative concentration then allows the calculation of relative contribution to the total NMR spectrum. The free energy difference in this case is -5.43 kJ mol-1. Using:
The equilbrium constant, , is found to be 8.94 at 298.15 Kelvin, where
Therefore for the ketone down chair concentration is found to be almost 9 times more than ketone up. As a result the ketone up makes up around 10 % of the contribution that ketone down does, and this may the reason why there are some deviations in the experimental NMR and that calculated from the ketone down conformations.
NMR Spectrum Calculation and Analysis
Results and Discussion
| Ketone Down Chair Conformer | Ketone Down Boat Conformer | |
|---|---|---|
| 1H | 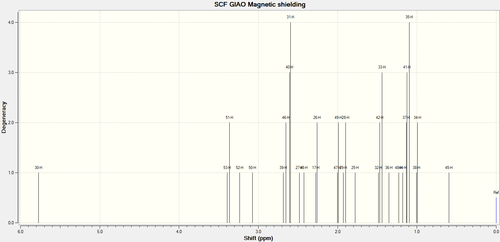 |
|
| 13C |  |
|
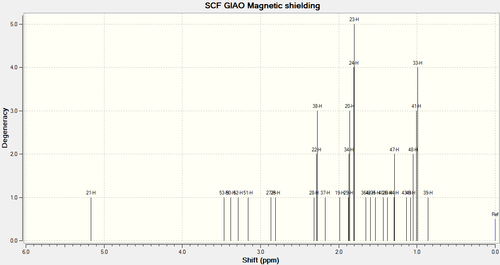
A quick look at both NMR spectra shows that certain notable peaks are significantly shifted between the two conformers. Notably the leftmost peak in the 1H NMR spectrum shifts from about 6 to 5 ppm. A more in depth analysis of the more is undertaken below.

| Ketone Down Calculated δ / ppm | Experimental[6] δ / ppm | Calculated Integral | Experimental[6] Integral (multiplicity) | |
|---|---|---|---|---|
| Chair | Twist Boat | |||
| 5.77 | 5.17 | 5.21 | 1 | 1(m) |
| 3.39 | 3.47 | 3.00-2.7 | 1 | 6 (m) |
| 3.36 | 3.38 | 2 | ||
| 3.24 | 3.29 | 1 | ||
| 3.08 | 3.16 | 1 | ||
| 2.68 | 2.87 | 1 | ||
| 2.65 | 2.81 | 2.7-2.35 | 2 | 4 (m) |
| 2.61 | 2.32 | 3 | ||
| 2.60 | 2.29 | 4 | ||
| 2.48 | 2.27 | 1 | ||
| 2.42 | 1 | |||
| 2.28 | 2.18 | 2.20-1.70 | 1 | 6 (m) |
| 2.26 | 1.99 | 2 | ||
| 2.00 | 1.87 | 1 | ||
| 1.93 | 1.86 | 1 | ||
| 1.90 | 1.80 | 2 | ||
| 1.78 | 1.66 | 1 | ||
| 1.49 | 1.60 | 1.58 | 1 | 1 (t) |
| 1.47 | 1.53 | 1.50-1.20 | 2 | 3 (m) |
| 1.44 | 1.43 | 3 | ||
| 1.35 | 1.38 | 1 | ||
| 1.23 | 1.29 | 1 | ||
| 1.18 | 1.14 | 1 | ||
| 1.13 | 1.08 | 1.07 | 2 | 3 (s) |
| 1.12 | 1.05 | 3 | ||
| 1.10 | 4 | |||
| 1.01 | 1.01 | 1.03 | 1 | 3 (s) |
| 0.99 | 0.99 | 2 | ||
| 0.60 | 0.86 | 1 | ||
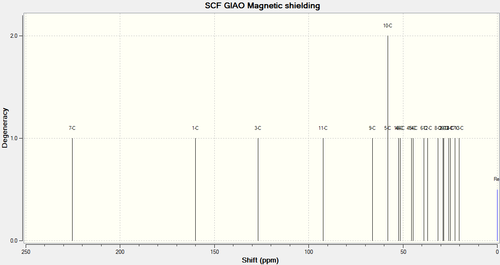
Overall the results obtained tend to agree with literature. The vast majority of simulated and experimental chemical shifts fall fairly close to each other. It is a rather interesting observation that the first chemical shift reported in the table above seems to indicate a predominant ketone boat conformation, despite previous predictions. As mentioned previously the leftmost peak shifts significantly between the two ketones. In the ketone down twist boat case it is near 5.2 ppm whereas in the ketone down chair case it is at about 6 ppm. The experimental result of 5.21 ppm therefore suggests a predominant presence of the boat conformer. The mean magnitude of difference between calculated and experimental chemical shift is 0.12 and 0.089 ppm for chair and boat respectively. The fact that the boat NMR spectrum is closer to the experimental NMR is surprising since it is expected to be the less abundant conformer.
The biggest failure of the calculated NMR seems to be its prediction of peak intensities. These are vastly different to those reported.

| Ketone Down Calculated δ / ppm | Experimental[6] δ / ppm | Calculated Integral | |
|---|---|---|---|
| Chair | Twist Boat | ||
| 204.43 | 225.48 | 211.49 | 1 |
| 140.27 | 160.08 | 148.72 | 1 |
| 112.34 | 126.89 | 120.90 | 1 |
| 86.31 | 92.4 | 74.61 | 1 |
| 52.62 | 66.19 | 60.53 | 1 |
| 47.07 | 57.99 | 51.30 | 1 |
| 46.39 | 57.97 | 50.94 | 1 |
| 41.89 | 52.41 | 45.53 | 1 |
| 41.34 | 51.36 | 43.28 | 1 |
| 38.97 | 45.57 | 40.82 | 1 |
| 34.01 | 44.60 | 38.73 | 2 |
| 33.97 | 38.88 | 36.78 | 2 |
| 30.93 | 36.93 | 35.47 | 1 |
| 26.33 | 31.53 | 30.84 | 1 |
| 25.84 | 28.83 | 30.00 | 1 |
| 20.35 | 28.26 | 25.56 | 1 |
| 18.66 | 25.80 | 25.35 | 1 |
| 16.74 | 24.78 | 22.21 | 1 |
| 14.82 | 22.51 | 21.39 | 1 |
| 13.91 | 20.20 | 19.83 | 1 |
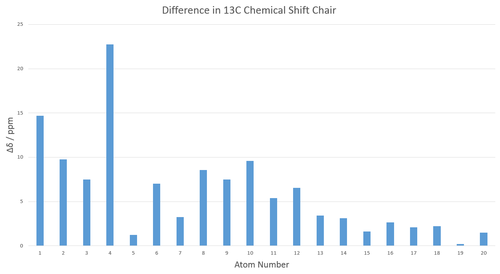
Overall the calculated and experimental spectra seem to be in good agreement.From the figures above it can be clearly seen that the NMR calculation consistently predicts a smaller shift than that reported in literature for the chair conformation while predicting a larger shift for the twist boat conformation. This result makes sense in light of the fact that the experimental NMR is an average of the two. Excluding the anomalously large prediction at carbon 4, the mean magnitude of deviation from experiment is 5.2 and 4.6 ppm for chair and boat respectively. This are acceptably low values and confirm that the method used is a reliable tool for predicting NMR spectra. These spectra also seem to indicate a greater presence of the boat isomer as once again the boat NMR is closer to experiment.
The large deviation is likely to be a result from the presence of heteroatoms, in this case sulfur. The calculation does not take into account spin-orbit coupling which is larger for heavier atoms. As a result the deviation in the chemical shift of the carbon attached to sulfur is quite large.
Part 2
Discussion on the Crystal Structures of Catalysts
Jacobsen Catalyst
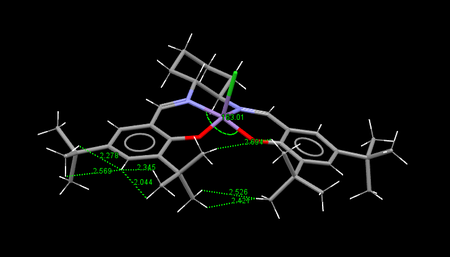
The 3D structure of the catalyst precursor was found by searching the Cambridge Crystal Database using the program Conquest. The overall structure is planar and this is enforced by the presence of numerous rings. Furthermore the rings lock various substituents into place resulting in both favourable and unfavourable interactions. There are two possible conformations TOVNIB01 and TOVNIB02, these differ by the relationship between the t-Bu groups. In the case of TOVNIB01 the hydrogen atoms on the groups are staggered with regards to each other, whereas in TOVNIB02 they are eclipsed. For hydrogen dispersion interactions, a distance of 2.4 Å is the ideal for favourable interactions, while distences less than 2.1 Å are unfavourable.
 |
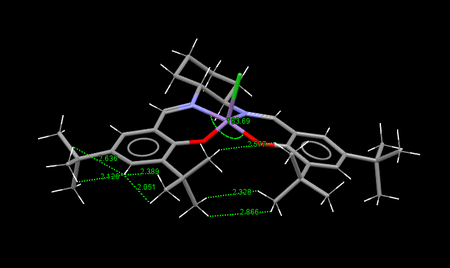 |
By examining the figures above a couple of things immediately become clear. The TOVNIB01 conformation is more bent the selected angle is further away from the linear 180° angle, 163.01° vs 163.69°. Furthermore both conformations seem to have an equal amount of attractive and repulsive H-H interactions and notably the adjacent tBu groups have only attractive interactions between them.
Shi Catalyst
The 3D precursor structure was found in the same way as the Jacobsen catalyst. The Shi catalyst is found to exhibit the anomeric effect. This effect describes the preference of substituents to be in an axial rather than equatorial positions if they are adjacent to heteroatoms in the cyclohexane ring. This is the reverse of a homonuclear cyclohexane, where the steric 1,3 di axial repulsions mean the equatorial orientation is preferred. The effect is present with oxygen heteroatoms atoms because the lone pair of electrons on the oxygen can delocalise into the adjacent σ*C-Substituent anti bonding orbital. The delocalisation results in a lower of the total energy and a shortening of the C-O bond within the cyclohexane as well as a weakening and therefore lengthening of the axial C-O bond. Therefore in order to demonstrate the effect is present in this catalyst precursor the bond lengths are shown in the figure below and summarized in the table. The bond length of C-O without anomeric effects is taken as 1.43 Å and therefore significant deviations from this can be taken as proof of the effect being present. In order for this effect to be maximized the overlap of the lone pair orbital with the σ*C-Substituent has also be maximised, this is done in the anti periplanar arrangement which is why atoms undergoing this interaction are arranged in that way.
In total there are 3 anomeric effects on the left molecule in the figure.

| Atoms | Length / Å |
|---|---|
| C2-O2 | 1.403 |
| C2-O6 | 1.403 |
| C14-O12 | 1.48 |
| C14-O8 | 1.39 |
| C7-O2 | 1.441 |
| C7-O1 | 1.413 |
| C1-O1 | 1.40 |
| C4-O4 | 1.395 |
| C10-O4 | 1.439 |
| C10-O5 | 1.409 |
| C5-O5 | 1.416 |
| C16-O10 | 1.406 |
| C22-O10 | 1.438 |
| C22-O11 | 1.416 |
| C17-O11 | 1.418 |
| C18-O12 | 1.414 |
| C19-O7 | 1.380 |
| C19-O8 | 1.443 |
| C13-O7 | 1.345 |
| C6-O6 | 1.420 |
Optimization of Product Structures
Background
In order to carry out a the various analyses in the sections below, an optimized structure for each epoxide is required. As a result all epoxides were optimized at the B3LYP/+-31G level of theory, with the resulting structures shown in the section below.
Results
| (R)-Styrene Oxide | (S)-Styrene Oxide | (R,R)-Trans-Stilbene Oxide | (S,S)-Trans-Stilbene Oxide | ||||||||
|---|---|---|---|---|---|---|---|---|---|---|---|
| DOI:10042/148766 | DOI:10042/148742 | DOI:10042/148758 | DOI:10042/148763 |
NMR of Epoxides
Background
In order to carry out the NMR calculation, the structures were reoptimized at the B3LYP/6-311+G(2d,p) level of theory, necessary in order to have a matching TMS reference. Only one enantiomer of each epoxide was chosen for these calculations as NMR spectra are not sensitive to chirality. The calculations were performed in a simulated chloroform environment so as to correspond to literature.
NMR of Styrene Oxide
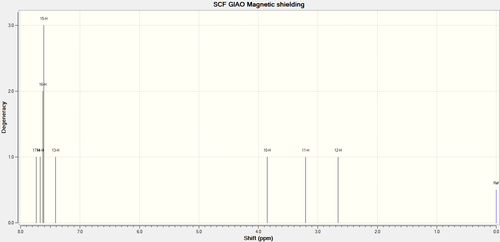
| |||
|---|---|---|---|
| Calculated δ / ppm | Experimental[7] δ / ppm | Calculated Integral | Experimental[7] Integral (multiplicity) |
| 7.502 | 7.25 | 1 | 5 (m) |
| 7.500 | 2 | ||
| 7.471 | 3 | ||
| 7.434 | 4 | ||
| 7.286 | 1 | ||
| 3.650 | 3.88 | 1 | 1 (dd) |
| 3.101 | 3.16 | 1 | 1 (dd) |
| 2.521 | 2.82 | 1 | 1 (dd) |
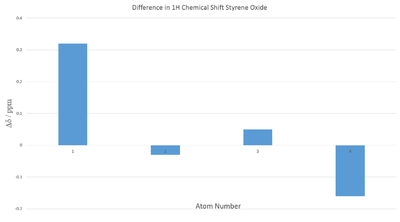
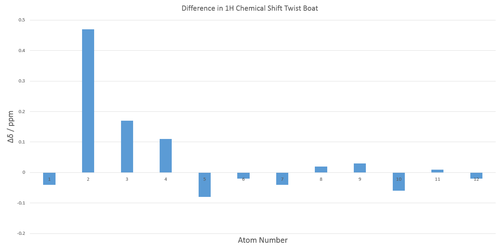
Overall there seems to be a good agreement with literature. In order to evaluate any trends in differences in chemical shift a graph of the differences was plotted in Figure 5. The calculated multiplet peak was calculated to be found at 7.57 ppm by taking the average chemical shifts of the most shielded and deshielded peaks. The average magnitude of displacement in this case is 0.155 ppm with maximum and minimum magnitudes being 0.32 and 0.03 ppm respectively, again demonstrating the predictive power of quantum mechanical calculations.
| ||
|---|---|---|
| Calculated δ / ppm | Experimental[7] δ / ppm | Calculated Integral |
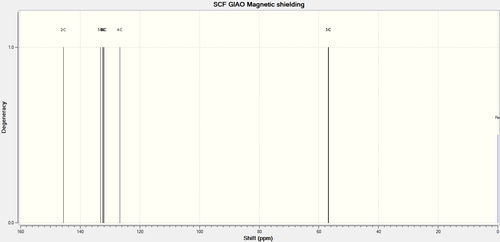
| 145.63 | 137.2 | 1 |
| 133.20 | 128.1 | 1 |
| 132.43 | 127.7 | 1 |
| 132.23 | 1 | |
| 131.92 | 125.1 | 2 |
| 126.711 | 1 | |
| 56.90 | 51.9 | 1 |
| 56.71 | 50.8 | 1 |
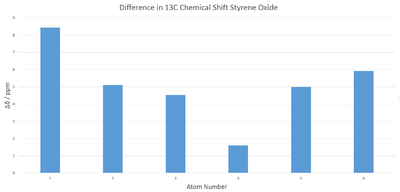
Agreement is less good this time. Notably the calculated spectrum shows more peaks than the experimental one, it is unknown if this is due to the presence of multiplets as this information is not reported in literature. The average ppm difference is 5 ppm , which is just within the realms of acceptability. The fact that all the shifts have displacement in one direction suggests a systematic error. The source of this may be either in the experiment or due to the approximations used in the calculation.
NMR of Trans-Stilbene Oxide

| |||
|---|---|---|---|
| Calculated δ / ppm | Experimental[8] δ / ppm | Calculated Integral | Experimental Integral[8] |
| 7.7453 | 7.57-7.34 | 1 | 10 |
| 7.7450 | 2 | ||
| 7.6788 | 1 | ||
| 7.6785 | 2 | ||
| 7.6250 | 3 | ||
| 7.6243 | 4 | ||
| 7.6229 | 5 | ||
| 7.6229 | 6 | ||
| 7.6161 | 7 | ||
| 7.6142 | 8 | ||
| 3.7527 | 3.91 | 1 | 2 |
| 3.7505 | 2 | ||
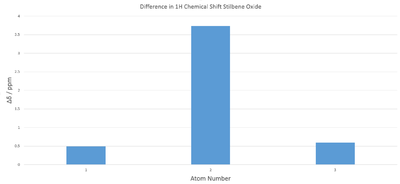
The mean magnitude of displacement is 1.61 ppm, significantly more than in the for styrene oxide. Since the literature reported a range rather than actual peak positions the bottom and top limits of the range were taken as the location of the most shielded and deshielded peaks. It appears that the calculation over estimates the deshielding.
| ||
|---|---|---|
| Calculated δ / ppm | Experimental[8] δ / ppm | Calculated Integral |
| 144.24 | 137.6 | 1 |
| 144.22 | 2 | |
| 133.35 | 129.0 | 1 |
| 133.34 | 2 | |
| 132.60 | 128.8 | 1 |
| 132.51 | 2 | |
| 132.18 | 1 | |
| 132.17 | 2 | |
| 126.66 | 126.2 | 1 |
| 126.64 | 2 | |
| 70.42 | 63.3 | 1 |
| 70.41 | 2 | |
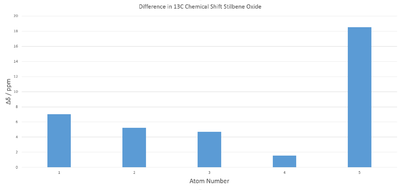
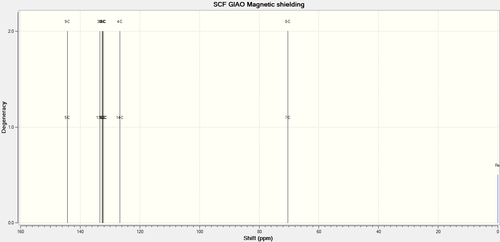
Mean magnitude of displacement in this case is 4.63, therefore slightly better than styrene oxide. This is not counting the anomalously high error on the carbon atoms bonded to oxygen. This is once again likely to be a coupling error.
Assignment of Absolute Configurations
Background
The problem of distinguishing enantiomers is one often mentioned in chemistry. Furthermore the most basic identification test, the rotation of polarized light, does not provide any information regarding R and S assignment. The problem of predicting which enantiomer will rotate light in which direction is non trivial and requires expensive quantum mechanical calculations. It is therefore a great example of the analytic uses of computational chemistry.
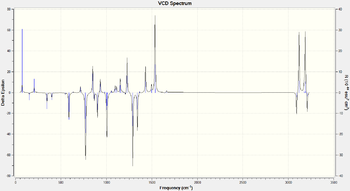
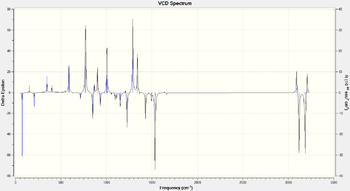
Two further methods which can be used to identify R and S enantiomers are vibrational circular dichroism (VCD) and electronic circular dichroism (ECD). In the case of VCD, the sample is irradiated with polarized UV light. Since each enantiomer interacts with polarised light in a mirrored way, the resulting spectra have their intensities reversed along the X axis (assuming enantiopure samples). Therefore if a predicted VCD spectrum for an R or S enantiomer can be obtained, the experimental spectrum will either have its intensities in the same or opposite direction. If its the same direction then one can be certain that their enantiomer is the simulated one. If however the itensities are reversed, then by exclusion their enantiomer must be the one not simulated.
ECD is another technique which can be used to assign absolute configuration. However it is not as universal as the other two due to requiring suitable chromophores. These are not present in the epoxides studied here and as a result the technique is of no use for our purposed and was not attempted.
Optical Rotary Power
Optical rotary power calculations were performed using the B3LYP/6-311++g(2df,p) level of theory with a simulated chloroform environment - this was chosen since it is the solvent used in literature.
| Product | 589 nm | 365 nm | ||
|---|---|---|---|---|
| Calculated Rotation / ° | Experimental Rotation / ° | Calculated Rotation / ° | ||
| (R)-Styrene Oxide DOI:10042/148969 |
-30.18 | -24.0 (25.15 °C)[9] -21.9 (25 °C)[10] -19.5 (20 °C)[11] |
-94.26 | |
| (S)-Styrene Oxide DOI:10042/148810 |
30.18 | 32.1 (25 °C)[12] 25.1 (24.5 °C)[13] |
94.26 | |
| (R,R)-Trans-Stilbene Oxide DOI:10042/148815 |
298.48 | 296[14] 239 (25 °C)[15] |
1255.88 | |
| (S,S)-Trans-Stilbene Oxide DOI:10042/148961 |
-298.27 | -278[16] -249 (15 °C)[17] |
-1255.18 | |
The calculated optical rotations generally bear good agreement with literature. However deviations up to 20° can be found. This can be attributed to experimental error due to the well known sensitivity of such measurements. As a result multiple sources of optical rotation measurements were attempted to be found. Looking at the various reported rotations seems to demonstrate the sensitivity of such measurements, especially to temperature. Furthermore some of the reported optical rotations did not have a temperature clearly reported making them even more suspect. However it is absolutely clear that these methods can be used to easily identify an R or S epoxide, since the rotations between the two enantiomers are markedly different.
Unfortunately references for optical rotations at 365 nm were not found.
Vibrational Circular Dichroism
VCD calculations were performed using the B3LYP/6-31G(d,p) level of theory along with a simulated chloroform environment.
| Product | VCD Spectrum |
|---|---|
| (R)-Styrene Oxide DOI:10042/148965 |
 |
| (S)-Styrene Oxide DOI:10042/148847 |
 |
| Product | VCD Spectrum |
|---|---|
| (R,R)-Trans-Stilbene Oxide DOI:10042/148841 |
 |
| (S,S)-Trans-Stilbene Oxide DOI:10042/148958 |
 |
In all cases the inverstion along the x axis can clearly be seen. Once again, as in the optical rotation case, an experimental sample can be matched to one of these in order to determine the enantiomer synthetized.
Transition State Analysis
Background
Enantiomeric Excess
Enantiomeric excess (e.e.) is a measure of purity of samples containing chiral compounds. If a sample is racemic its e.e. is defined to be 0% while a enantiopure sample has an e.e. value of 100%. Using the difference in transition state free energies of a compound, it is possible to work out its e.e..
Given that:
where is the equilibrium constant and
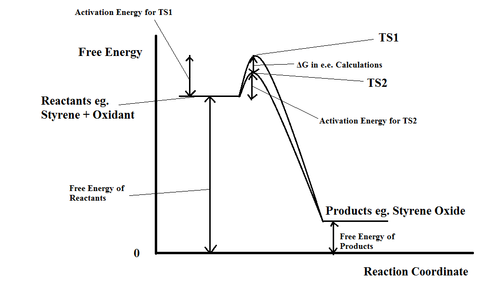
A qualitative energy profile illustrating the origin of is shown in Figure 9. The epoxidation of styrene is used as an example but it applies equally to all cases discussed in the sections below.
Investigating the Non-Covalent Interactions in the Active-Site of the Reaction Transition State
NCIs are interactions such as electrostatic interactions, dispersion and hydrogen bonds and in the transition state they include half formed covalent bonds. However, these half formed bonds are ignored in the analysis of such interactions. The semi qualitative analysis of these interactions in transition states is important to understanding stereoselectivity of catalysis. Being able to locate areas of interaction between a catalyst and substrate is often key to understanding how the final product is formed.
Investigating the Electronic Topology (QTAIM) in the Active-Site of the Reaction Transition State
The aim of this investigation is to locate bond critical points (BCPs) and associate them with either covalent bonds or NCIs. BCPs are stationary points of electron density with respect to all 3 spacial dimensions. This method is complementary to the before mentioned NCI analysis and also provides key insights into the stereselectivity of catalysts. This is because a BCP of a NCI will show exactly where an interaction takes place.
Shi Catalyst
Background
The Shi catalyst has 8 possible transition states when carrying out an epoxidation. All of these have unique energies. There are three causes for this number of transitions states. Firstly either an R or S transition state can be formed. Next there are two possible non equivalent oxygens which can be used for epoxidation and finally there is a choice of orientation of catalyst and substrate. This can be either exo or endo.
Results and Discussion
| R Transition State | Free Energy / hartrees | S Transition State | Free Energy / hartrees |
|---|---|---|---|
| R(1) : DOI:10.6084/m9.figshare.822152 | -1303.730703 | S(1) : DOI:10.6084/m9.figshare.823545 | -1303.733828 |
| R(2) : DOI:10.6084/m9.figshare.828520 | -1303.730238 | S(2) : DOI:10.6084/m9.figshare.8221367 | -1303.724178 |
| R(3) : DOI:10.6084/m9.figshare.822135 | -1303.736813 | S(3) : DOI:10.6084/m9.figshare.828519 | -1303.727673 |
| R(4) : DOI:10.6084/m9.figshare.822137 | -1303.738044 | S(4) : DOI:10.6084/m9.figshare.826003 | -1303.738503 |
The R(4) and S(4) transitions state are clearly the two lowest in energy for their corresponding configuration. Since the free energy difference between them is found to be -1.21 kJ mol-1, using the equations discussed in the background section and (at 298.15 K). This is all from the view of S(4) being the predominant species due to having the lower energy.
This is in rather stark contrast to literature reports on the reaction. The experimental e.e. was found to be 13.6 % towards to R epoxide[18]. There are many potential reasons for this, in summary the computation does not take into account all possible interactions and conditions such as solvation or pH.
| (R,R) Transition State | Free Energy / hartrees | (S,S) Transition State | Free Energy / hartrees |
|---|---|---|---|
| (R,R)(1) : DOI:10.6084/m9.figshare.828552 | -1534.687808 | (S,S)(1) : DOI:10.6084/m9.figshare.829524 | -1534.683440 |
| (R,R)(2) : DOI:10.6084/m9.figshare.830388 | -1534.687252 | (S,S)(2) : DOI:10.6084/m9.figshare.829525 | -1534.685089 |
| (R,R)(3) : DOI:10.6084/m9.figshare.829522 | -1534.700037 | (S,S)(3) : DOI:10.6084/m9.figshare.830389 | -1534.693818 |
| (R,R)(4) : DOI:10.6084/m9.figshare.829523 | -1534.699901 | (S,S)(4) : DOI:10.6084/m9.figshare.830390 | -1534.691858 |
In the case of stilbene-oxide, the lowest energy TS are (R,R)(3) and (S,S)(3), with their energy difference being -16.33 kJ mol-1, with (R,R) conformer being lower in energy overall. This results in and in terms of the (R,R) conformer at 298.15 K. This is somewhat different to the reported literature value for e.e. at 83 %[19]. Possible reasons include that the referenced article did not use a water sovlent and was at pH 9.6 and 273 K - conditions not replicated in the simulation.
|
 |
There are a number of NCI present in the Shi transition state. Interaction A shown in the figure above is a result of NCI of oxygen atoms on the catalyst with non-Phenyl hydrogen atoms on styrene. These relatively powerful interactions force the two components to join in a particular geometry, resulting in an S epoxide. Interaction B is a result of intramolecular hydrogen bonding, locking the catalyst into a specific conformation. Interaction C is a half covalent interaction accounting for the bond formation resulting in an epoxide.
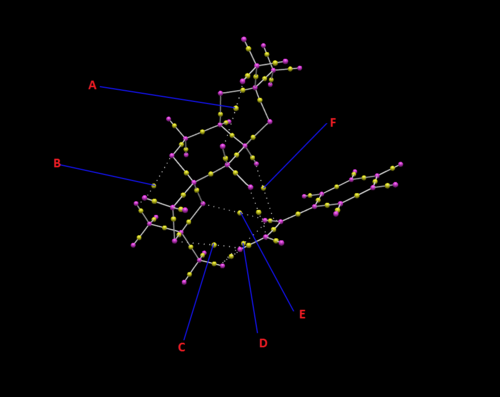
A number of BCPs can be identified from the figure above. Interaction A is due to an intramolecular hydrogen in the Shi catalyst between an oxygen and one of the hydrogens on the tBu groups. It corresponds to interaction B in the NCI above and as a result is not a covalent interaction. The BCP in this case seems to be about equidistant between the two atoms. Interaction B is also an intramolecular hydrogen bond much like A but in this case it is between the the oxygen inside the heterocyclohexane and a hydrogen on one of the tBu groups on the opposite end of the catalyst. It corresponds to interaction D in the NCI analysis. Interaction C corresponds to a hydrogen bond like donation from an oxygen on the catalyst to one of the terminal non phenyl hydrogen atoms on the styrene. This is one of the interaction present in the A interaction in the NCI analysis. Interactions D and E are favorable Van der Waals interactions between hydrogen atoms on the styrene and catalyst. Again one of the interactions compromising A in the NCI analysis. Finally interaction F is the only covalent (in this case half-covalent) interaction described here. It is the bond formation between the oxygen on the catalyst and alkene on the styrene. Corresponds to interaction C in the NCI analysis.
Jacbonsen Catalyst
Background
In the case of the Jacobsen catalyst, there are four possible transition states. This is a result of a choice of either R or S epoxidation as before as well as the choice of endo or exo orientation of the substrate and catalyst.
Results and Discussion
| R Transition State | Free Energy / hartrees | S Transition State | Free Energy / hartrees |
|---|---|---|---|
| R(1) : DOI:10.6084/m9.figshare.860446 | -3343.960889 | S(1) : DOI:10.6084/m9.figshare.860441 | -3343.969197 |
| R(2) : DOI:10.6084/m9.figshare.860449 | -3343.962162 | S(2) : DOI:10.6084/m9.figshare.860445 | -3343.963191 |
The lowest energy enantiomers are R(2) and S(1), with an energy difference of -18.47 kJ mol-1, where the R(2) is higher in energy. therefore , where the S(1) is significantly more abundant. The literature value in this case is reported as only 48 %[20]. The difference is once again due to conditions as mentioned before.
| (R,R) Transition State | Free Energy / hartrees | (S,S) Transition State | Free Energy / hartrees |
|---|---|---|---|
| (R,R)(1) : DOI:10.6084/m9.figshare.899176 | -3574.921174 | (S,S)(1) : DOI:10.6084/m9.figshare.9036254 | -3574.923087 |
There are only two possible TS in this case, with an energy difference of -5.02 kJ mol-1, where the (R,R)(1) is higher in energy. therefore , where the (S,S)(1) is more abundant. The literature value in this case is reported as 25 %[21].
A New Candidate for Investigation
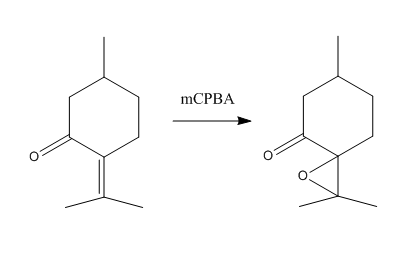
A search of reaxys for epoxides of a molecular mass less than 200 and an optical rotation of less than -300° resulting in finding the epoxide of pulegone, a naturally occurring compound obtain from essential oils of various plants. Its ring structure and stereo centre means that a variety of techniques discussed throughout this work may be used on its analysis. Due to the abundance the pulegone precursor, which may be readily purchased, comparison of any computational analysis to experiment can be done fairly easily. The synthesis requires only mCPBA as shown in the figure below[22]. The resulting epoxide has been reported to have an optical rotation of R pulegone oxide has been reported to be anywhere from 26°[22] to 46.6°[23], strongly dependent on conditions and therefore a computational investigation is certainly warranted.
References
<references> Template loop detected: Template:Reflist
- ↑ 1.0 1.1 1.2 Marye Anne Fox, Raul Cardona, Nicoline J. Kiwiet (1987). "Steric effects vs. secondary orbital overlap in Diels-Alder reactions. MNDO and AM1 studies". J. Org. Chem. 52(8): 1469–1474. doi: 10.1021/jo00384a016.
- ↑ David Skála, Jiří Hanika (2008). "Dicyclopentadiene hydrogenation in trickle-bed reactor under forced periodic control". Chemical Papers 62(2): 215-218. doi: 10.2478/s11696-008-0013-3.
- ↑ Ji-Jun Zou, Xiangwen Zhang, Jing Kong, Li Wang (2008). "Hydrogenation of Dicyclopentadiene over amorphous nickel alloy catalyst SRNA-4". Fuel 87: 3655–3659. doi: 10.1016/j.fuel.2008.07.006.
- ↑ Steven W. Elmore, Leo A. Paquette (1991). "The first thermally-induced retro-oxy-cope rearrangement". Tetrahedron Letters 32(3): 319–322. doi: 10.1016/S0040-4039(00)92617-0.
- ↑ 5.0 5.1 Wilhelm F. Maier, Paul Von Rague Schleyer (1981). "Evaluation and prediction of the stability of bridgehead olefins". J. Am. Chem. Soc. 103(8): 1891–1900. doi: 10.1021/ja00398a003.
- ↑ 6.0 6.1 6.2 Leo A. Paquette, et al. (1981). "[[[3.3] Sigmatropy within 1-vinyl-2-alkenyl-7,7-dimethyl-exo-norbornan-2-ols. The first atropselective oxyanionic Cope rearrangement]]". J. Am. Chem. Soc. 112(1): 277–283. doi: 10.1021/ja00157a043.
- ↑ 7.0 7.1 7.2 Yoshihiro Kon, et al. (2011). "An Effective Synthesis of Acid-Sensitive Epoxides via Oxidation of Terpenes and Styrenes Using Hydrogen Peroxide under Organic Solvent-Free Conditions". Synthesis 7: 1092-1098. doi: 10.1055/s-0030-1258467.
- ↑ 8.0 8.1 8.2 Mathew W. C. Robinson, et al. (2009). "Epoxide ring-opening and Meinwald rearrangement reactions of epoxidescatalyzed by mesoporous aluminosilicates". Organic & Biomolecular Chemistry 12: 2559-2564. doi: 10.1039/B900719A.
- ↑ David C. Forbes, et al. (2008). "S-Methylidene agents: preparation of chiral non-racemic heterocycles". Tetrahedron 65(1): 70–76. doi: 10.1016/j.tet.2008.10.019.
- ↑ Masahiko Hayashi, Hiroshi Miwata, Nobuki Oguni (1991). "Kinetic resolution of racemic aldehydes by enantioselective alkylation". J. Chem. Soc., Perkin Trans. 1 1(5): 1167-1171. doi: 10.1039/P19910001167.
- ↑ Joerg H. Schrittwieser, et al. (1987). "Shifting the equilibrium of a biocatalytic cascade synthesis to enantiopure epoxides using anion exchangers". Tetrahedron: Asymmetry 20(4): 483–488. doi: 10.1016/j.tetasy.2009.02.035.
- ↑ Hui Lin, et al. (2010). "Styrene monooxygenase from Pseudomonas sp. LQ26 catalyzes the asymmetric epoxidation of both conjugated and unconjugated alkenes". Journal of Molecular Catalysis B: Enzymatic 67(3-4): 236–241. doi: 10.1016/j.molcatb.2010.08.012.
- ↑ Hiroshi Toda, et al. (2012). "Efficient biocatalysis for the production of enantiopure (S)-epoxides using a styrene monooxygenase (SMO) and Leifsonia alcohol dehydrogenase (LSADH) system". Tetrahedron: Asymmetry 23(22-23): 1542–1549. doi: 10.1016/j.tetasy.2012.09.017.
- ↑ Arlette Solladié-Cavallo, et al. (1996). "S-Methylidene agents: preparation of chiral non-racemic heterocycles". Tetrahedron: Asymmetry 7(6): 1783–1788. doi: 10.1016/0957-4166(96)00213-3.
- ↑ Scott E. Denmark, et al. (2002). "Chiral Fluoro Ketones for Catalytic Asymmetric Epoxidation of Alkenes with Oxone". J. Org. Chem 67(10): 3479–3486. doi: 10.1021/jo020050h.
- ↑ Marye Anne Fox, et al. (1987). "An Efficient Route to Tetrahydronaphthols via Addition of Ortho-Lithiated Stilbene Oxides to α,β-Unsaturated Fischer Carbene Complexes". Organic Letters 7(22): 4895–4898. doi: 10.1021/ol0518176.
- ↑ John Read, et al. (1930). "The optically active diphenylhydroxyethylamines andisohydrobenzoins. Part III. Optically active diphenylethylene oxides". J. Chem. Soc 7(22): 2377-2384. doi: 10.1039/JR9300002377.
- ↑ Yian Shi, et al. (1997). "An Efficient Catalytic Asymmetric Epoxidation Method". J. Am. Chem. Soc. 119(46): 11224–11235. doi: 10.1021/ja972272g.
- ↑ Yian Shi, et al. (2009). "Asymmetric Epoxidation Catalyzed by α,α-Dimethylmorpholinone Ketone. Methyl Group Effect on Spiro and Planar Transition States". J. Org. Chem. 74(16): 6335–6338. doi: 10.1021/jo900739q.
- ↑ John Hanson, et al. (2001). "Synthesis and Use of Jacobsen's Catalyst: Enantioselective Epoxidation in the Introductory Organic Laboratory". J. Chem. Educ. 78(9): 1266. doi: 10.1021/ed078p1266.
- ↑ Paola Piaggio, et al. (2000). "Enantioselective epoxidation of (Z)-stilbene using a chiral Mn(III)–salen complex: effect of immobilisation on MCM-41 on product selectivity". J. Chem. Soc., Perkin Trans. 2, missing volume(10): 2008-2015. doi: 10.1039/B005752P.
- ↑ 22.0 22.1 Koon-Sin Ngo, et al. (1998). "Synthesis of alpha-Corocalene". J. CHEM. RESEARCH missing volume(1): 80-81. doi: 10.1039/A705069K.
- ↑ Jun Katsuhara (1967). "Absolute configuration of pulegone oxide and piperitenone dioxide". J. Org. Chem 32(3): 797–799. doi: 10.1021/jo01278a062.
