Rep:Mod:lp0190 module2
Introduction
The recent increase in computer power is fueling the extent of which computational techniques are used in chemistry. Computers can now predict and evaluate an increasing amount of properties such as: IR and Raman spectra, NMR spectra and dipole moments. In addition, analysis of electron density gives us information on the bonding and atomic interactions within a molecule. In the first part of this page the molecular orbitals and Natural bonding orbitals of BH3 will be analyzed. In addition TlBr3 will also be analyzed using pseudo-potentials. In the second part of the page Mo(Co)4(PPh3)2 will be calculated (using approximations) in order to predict information about the thermal stability and the spectral characteristics of its Cis and Trans isomers.
At the end of the page a Mini-project focusing on how the Molecular Orbitals change when moving from Benzene, to Pyridine and the Phosphorus and Arsenic is reported.
BH3 Optimization
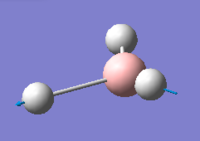
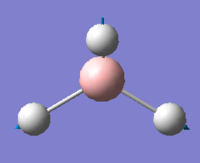
A molecule of BH3 was drawn on Gaussian and its bonds were all set to 1.5 angstrom. The geometry of the molecule was then Optimized.
Optimization in this case is first carried out under the Born-Oppenheimer (BO) approximation, thus solving the Schrodinger equation for the electronic density and the energy. The nuclei are then moved into different geometries and the electronic density and energy is recalculated at every position. This process is continued until the lowest energy is found and this is the optimized product.
For BH3 the commands used for the optimization are reported below (a screen-shot of the Summary of the optimized file was taken)

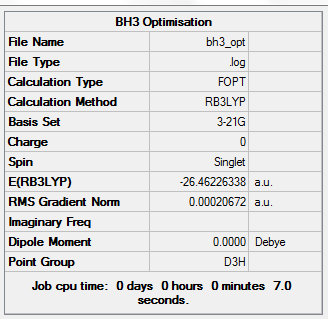
From the picture it can be seen that the molecule was successfully optimized. This can be said by looking at the gradient, which in this case is 0.0002 a.u. If the gradient is less than 0.001 a.u.(the closer to 0 the better), optimization is said to be successful (at least for the accuracy needed for this experiment).
In addition to check whether the job converged or not, the actual Gaussian output text file was analyzed and a snapshot is reported below.
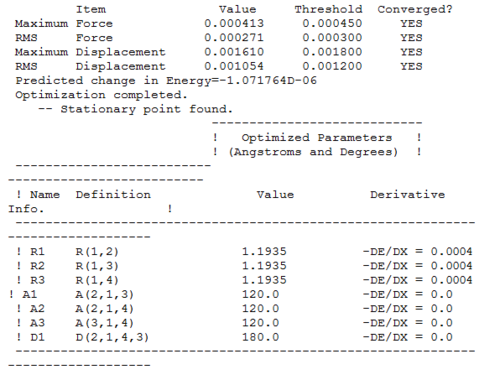
The document clearly confirms that the optimization was completed, as it says that the forces and the placements are converged.
The optimized B-H bond lengths was 1.19 Angstroms and the bond angle was 120 0C.
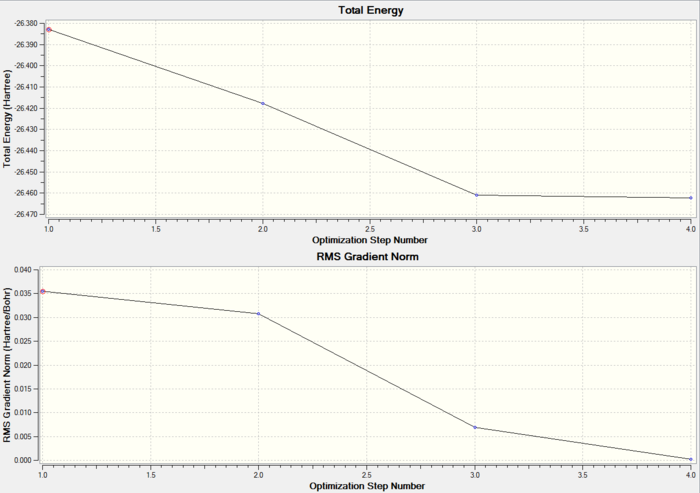
It is possible to see how the energy (and its gradient) changed during the optimization process. The following two graphs were produced using Gaussian.
 |
 |
 |
 |
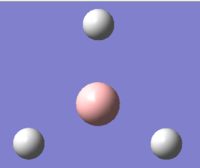
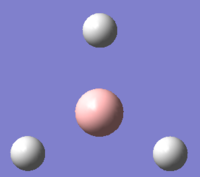
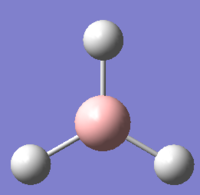
From the graph it can be seen that the energy is decreased every single time. The first structure (i.e. the one with highest energy) doesn't have any bonds. This highlights the point that Gaussview only draws bonds based on the distance criteria. If the distance exceeds some predefined value the bonds will not show. The computer then changed the position of the atoms, in order to reduce the energy. The energy of the graph is reduced until its gradient, which is reported in the bottom graph, is 0. The energy gradient is also known as the RMS (root mean square) and is the first derivative of the energy of the system, therefore when 0 a local minimum (or maximum) is reached. In this case it's clear it is a minimum as the energy is decreased all the time.
Vibrational Analysis
The frequency or vibrational analysis is the second derivative of the potential energy surface. If the frequencies are all positive then the structure is at a minimum, if one of the is negative the structure is at a transition state, while if they are negative the structure wasn't completely optimized. Therefore, it is important to carry out a frequency analysis after every optimization, in order to check whether an energy minimum was actually obtained.
The frequency analysis is also able to provide an IR spectrum which can be compared with experimental value. The methods used for the frequency calculation are summarized below.
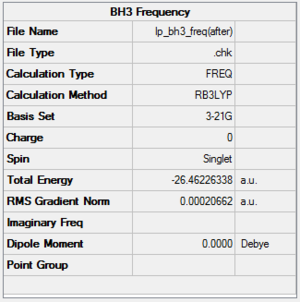
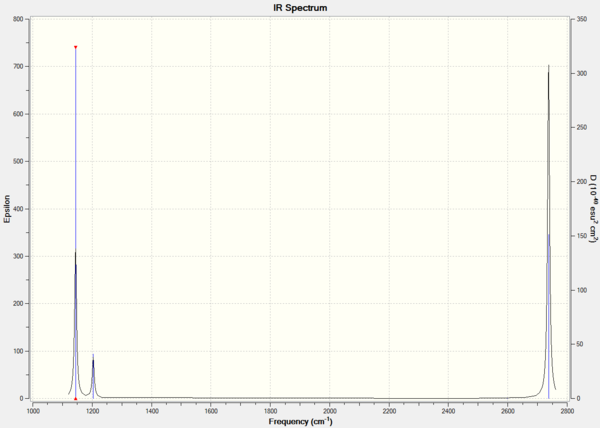
From this data the following IR spectrum was computed.
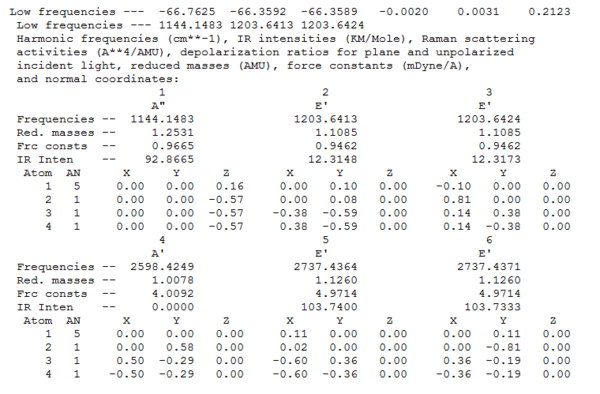
It is also possible to look at the real output in order to see the "low frequencies". These frequencies represent the motion of the center of mass of the molecule and are much smaller than the first vibration listed. In this case a low accuracy method was used, therefore these frequencies are higher than expected (the closer to 0 the more accurate); nevertheless they are still small compared to the first vibration. In addition, by looking at this file it's possible to find the symmetry labels of the vibrations.
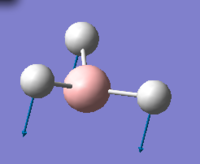
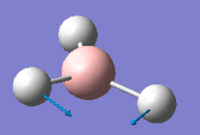
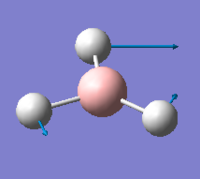
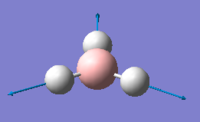
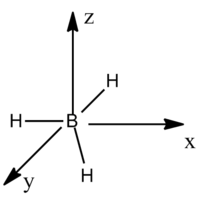
The peaks of BH3 and their vibrational modes are reported below. The axis set used to describe the vibration is also reported.
The table above shows that all frequencies are positive and therefore that the energy minimum was found during the optimization of BH3. Despite the fact that 6 vibrations are reported above and are calculated using the 3N-6 rule, only 3 peaks are present in the IR spectrum. This is because the symmetric stretch (4th vibration) doesn't show up in the IR as it doesn't involve a change in dipole (hence 0 intensity). In addition, vibrations 5 and 6 occur at the same frequency and the same happens for vibrations 2 and 3.
Molecular Orbital Analysis of BH3
One of the most useful aspects of computational chemistry is that it is able to resolve the electronic structure and give out Molecular Orbitals. These quantitative orbitals can be directly compared to the qualitative orbitals produced using MO diagrams.
The orbitals were obtained by setting up a Gaussian calculation using the BH3 output from optimization. The method was set to energy and the additional keyword "pop=full" was added so as to switch on MO analysis. DOI:10042/to-10810 The MO diagram is reported below:

The picture above shows a superimposition of the qualitative LCAOs developed using a MO diagram and the actual MOs obtained computationally. The resemblance between the two is remarkable, both in terms of how the orbitals look and the estimated energy. For the bonding orbitals it is very easy to see the resemblance, while it gets slightly more challenging for the higher energy anti bonding ones, as orbitals become more diffuse. The only difference with the BH3 MO diagram developed during last year course is that the 3a1' orbital is destabilized more than the degenerate 2e' orbitals as shown by the energies provided below.
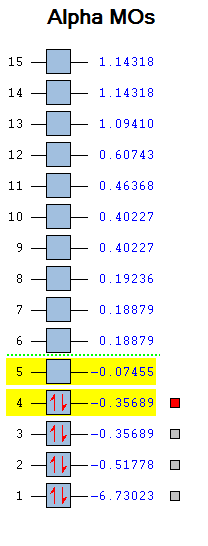
However, considering how easy the MO diagram approach is (no quantum mechanics and equations involved) the results are very impressive, thus making it a powerful technique.
NBO analysis of BH3
By opening the file used to produce the Molecular Orbitals in the previous section as a .log file, important information regarding the Natural Bond Orbitals (NBO) can be found.
The first bit of information that can be obtained are the charges on each atom, which are reported in the picture below.
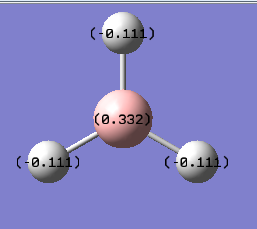
However, much more information can be obtained by looking at the real output. The first property that can be found is the description of the bonding in the compound. This is reported below.
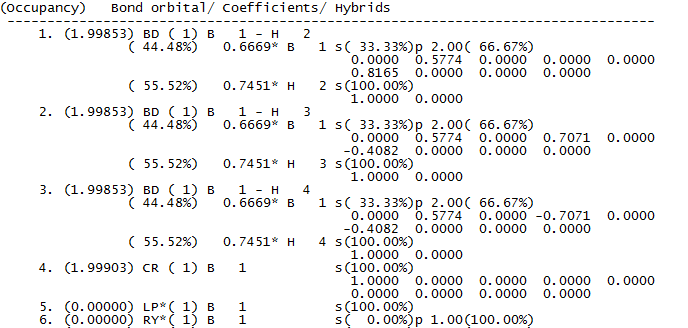
The figure above, clearly describes the bonding in the molecule. In the first three bonds, the contribution from Boron contains 66.67% p character and 33.33% s character, thus clearly highlighting an sp2 hybridization of Boron. The contribution due to Hydrogen is, instead, as expected a 100% s orbital. The fourth orbital is the non bonding core 1s orbital, while the 5th orbital is a Boron lone pair orbital. The software reports the lone pair in a 100% Boron s orbital, this is probably due to a mistake in the calculation set-up as the lone pair should be in a 100% Boron p orbital.
The file also provides information about mixing. In the case of BH3 no mixing is observed and this is reported in the file in terms of a low energies (mixing is only significant if the energy is over 20Kcalmol-1)

The last file that can be obtained is a summary of the NBO which records the energy and population or occupation of the B-H bonds and the boron lone pair (B(LP*)). This is reported below.

TlBr3 Optimization
TlBr3 is a very electron rich molecule at the quantum mechanical level used for computational calculations. Both atoms therefore exhibit relativistic effects which can’t be recovered by the standard Schrodinger equation. However, some of these relativistic effects can be recovered using a Pseudo-Potential. This function makes calculations for heavy atoms (third row and below) much easier as it is able to model the core electrons, thus reducing computational demand.
Apart from the need of using Pseudo-potentials when computing atoms in the second row and above, the accuracy of the calculations needs to be improved. This means that the Basis Set has to be improved, as this represents the number of functions used to describe the electronic structure.

The figure below is the summary of the optimization of TlBr3 DOI:10042/to-10601
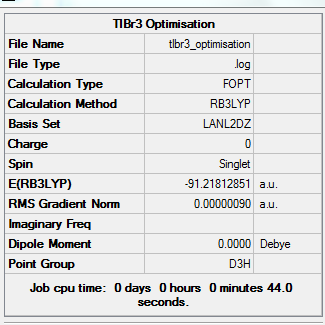
The optimized Tl-Br bond distance is 2.65 Angstroms, while the Bond angle is 1200C.
To test if the structure was really at a minimum in energy, a frequency analysis was run.
Vibrational analysis of TlBr3
Vibrational analysis was carried out using the method outlined below. It is important to use the same method and basis set for each calculations because otherwise it would be impossible to compare the energies. DOI:10042/to-10803
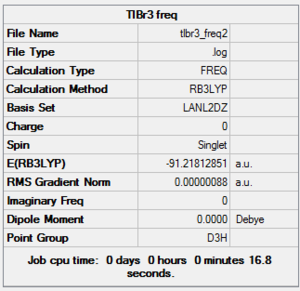
The IR spectrum is reported below.
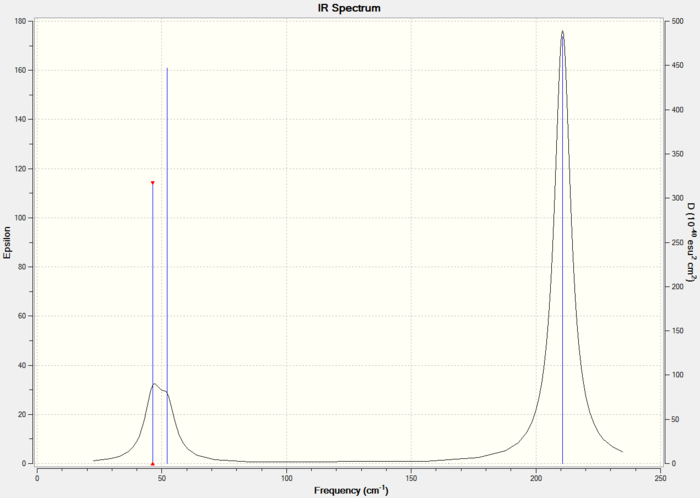
The predicted peaks ad their intensity are reported below.
| no. | form of the vibration | frequency /cm-1 | intensity | symmetry |
| 1 | scissoring | 46 | 4 | E' |
| 2 | rocking | 46 | 4 | E' |
| 3 | wagging | 52 | 6 | A2' |
| 4 | symmetric stretching | 165 | 0 | A1' |
| 5 | symmetric stretching | 211 | 25 | E' |
| 6 | asymmetric stretching | 211 | 25 | E' |
Similarly to BH3 peaks 5 & 6 and peaks 1 & 2 vibrate at the same frequency, while peak 4 is not reported in the IR spectrum as it is symmetric. This explains why the spectra only contains 3 peaks. Peak 1 and peak 2 are really similar in frequency (only 6 cm-1 difference) so they overlap and give rise to the broad signal visible in the IR spectrum.
Again all the frequencies are positive, thus confirming the optimization was successful. In addition it can be seen by the figure below that the low frequencies due to the movement of the center of mass are lower than the first "real" mode, which as reported above was 46 cm-1

What is a bond? A bond is the electrostatic interaction between opposite charges. In a covalent bond nuclei are attracted to a region of shared electron density. How strongly they are attracted depends on distance, for this reason Gaussian, as discussed in the optimization of BH3, doesn't sometimes show bonds as it only recognizes a bond in terms of a predefined distance term between two atoms. If the distance is greater than the predefined value it will not draw a bond, but that doesn't mean that the electrostatic interaction (i.e. the bond) is not there.
Cis and Trans Isomerism of Mo(CO)4L2
It is possible to distinguish between the Cis and Trans isomers of Mo(Co)4L2 by looking at the number of CO bands present in the IR spectra. According to group theory four carbonyl bands are expected for the Cis compound, while only one carbonyl band is expected for the Trans-Compound.
In this assignment, Mo(Co)4(PPh3)2 will be calculated in order to predict information about the thermal stability and the spectral characteristics of the two isomers. However, since calculating the full molecule would be too demanding in terms of computer power, the Phenyl rings were substituted in the calculations by Chlorine atoms, as these have similar electronic contributions to the molecule as phenyl rings and are also sterically quite large.
The first step carried out was the optimization of the two structures (Cis and Trans) after having drawn them on Gaussian.
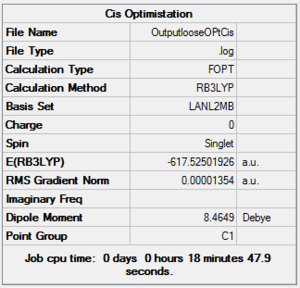
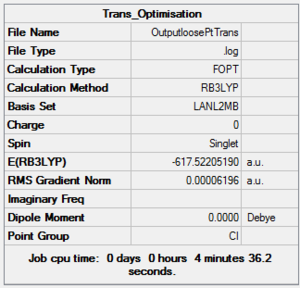
Firstly, a loose optimization was carried out using the B3LYP method and the low-level pseudo-potential LANL2MB. This calculation is not accurate and only used to give good enough bond lengths and angles, therefore the convergence limit has to be set to loose, because otherwise the normal limits would be more accurate than the method employed. The summary of this process is reported below. CisDOI:10042/to-10804 Trans DOI:10042/to-10805 .
 |
 |
 |
 |
Before carrying out the second optimization, the geometry of the molecules was changed, in order to obtain a starting point which will yield the global minimum on further optimization, rather than just another local minimum. For the Trans isomer the Chlorine atoms were rearranged in an eclipsed position, with one of the Cl atom from each group laying over one of the CO bond. For the Cis isomer one of the Chlorine atom of one group was put up parallel to the axial bond, while the Cl of the other group was made to point down. This is illustrated in the picture. The jmol of the modified loosely optimized structures are reported below.

These two modified structures were then further optimized using the B3LYP method with the LANL2DZ pseudo-potential and basis set using the normal optimization criteria. LANL2DZ is a much more accurate pseudo potential than MB so much tighter convergence criteria were needed, hence the extra “int=ultrafine scf=conver=9” keyword was added. Cis DOI:10042/to-10806 Trans DOI:10042/to-10807
 |
 |
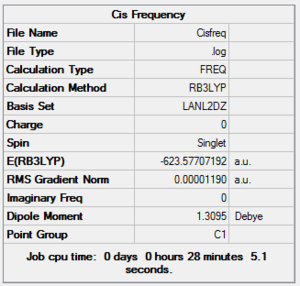
To confirm the geometry were fully optimized a frequency analysis was carried out for the two structures. These were computed using the same basis set and method as the optimization and their summary is reported below. Cis DOI:10042/to-10808 DOI:10042/to-10809
 |
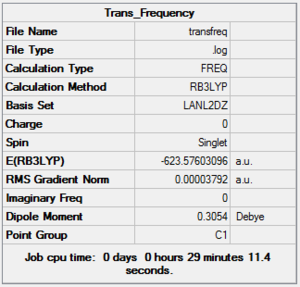 |
As it will be discussed below no negative frequencies were present thus confirming that an energy minimum was reached for both structures.
Comments on structure
The bond angles and bond lengths for the optimized structures were measured for the two isomers and are reported below. A comparison is also made with data from the literature: Cis[1] and Trans[2]
| Cis Isomer | |||||
| Bond | Measured length /Å | experimental/ Å | Angle | Measured angle/ ° | experimental/° |
| Mo-P | 2.51 | 2.58 | P-Mo-C cis CO | 91.9 | 91.7 |
| Mo-C axial | 2.01 | 1.97 | P-Mo-C trans CO | 176.1 | 173.2 |
| Mo-C equatorial | 2.06 | 2.02 | C-Mo-C cis | 89.1 | 90.1 |
| C-O axial | 1.18 | 1.13 | C-Mo-C trans | 178.3 | 174.1 |
| C-O equatorial | 1.17 | 1.15 | |||
| Trans Isomer | |||||
| Bond | Measured length /Å | literature values/ Å | Angle | Measuered angle/ ° | Literature value/° |
| P-Mo | 2.44 | 2.5 | P-Mo-P | 177.4 | 180 |
| P-C | 2.06 | 1.85 | P-Mo-C | 91.3 | 92.2 |
| C-O | 1.17 | 1.16 | C-Mo-C cis | 89.5 | 87.2 |
| C-Mo-C trans | 180 | 180 | |||
The table above shows that the data obtained computationally closely matches the experimental data. This proves firstly the power of computational techniques, especially in this case of optimization. Secondly the results point out that the approximation used (substitute benzene rings with Cl) was appropriate, as computational demand was significantly decreased, while not affecting the results.
Comments on energy
By comparing the structures after the second optimization, it can be seen that the Cis isomer is more stable than the Trans isomer by just 2.73 kJmol-1. However this difference is very small and lies within the 10% error expected for the calculations. Therefore, it is impossible to say which isomer will be more stable.
Comments on IR
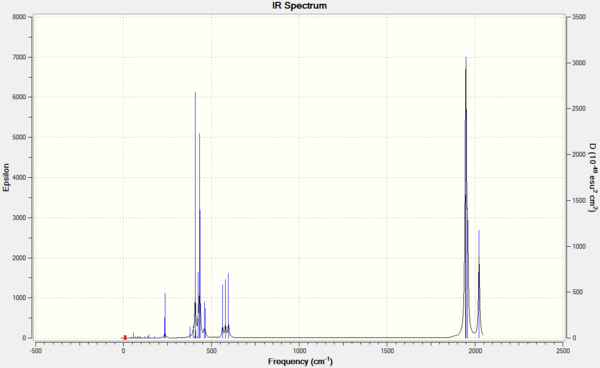
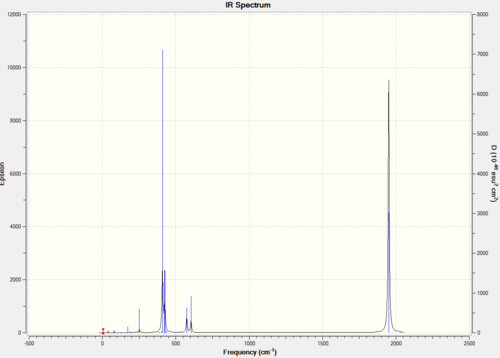
The frequency analysis produced the following IR spectra.
 |
 |
Some of the vibrations occurred at very low frequencies and are reported below.
| Stretching mode | frequency/cm-1 | Intensity | Animation |
| 1 | 11 | 0.026 | 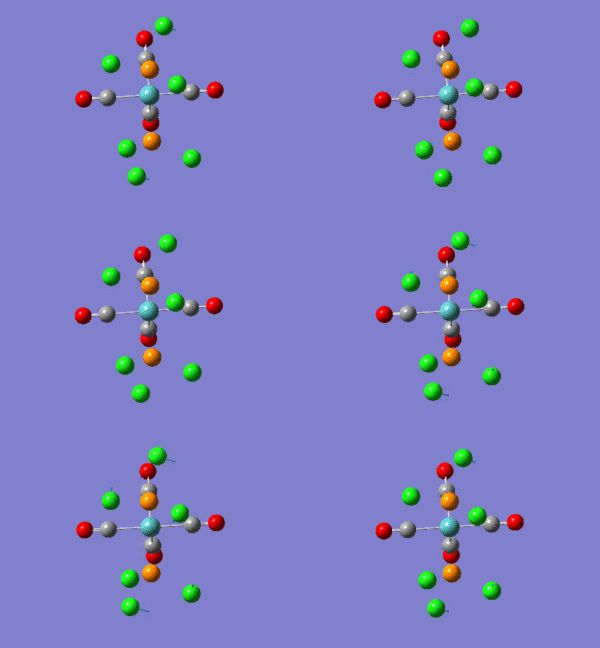 |
| 2 | 18 | 0.0073 |  |
| 3 | 42 | 0.0048 | 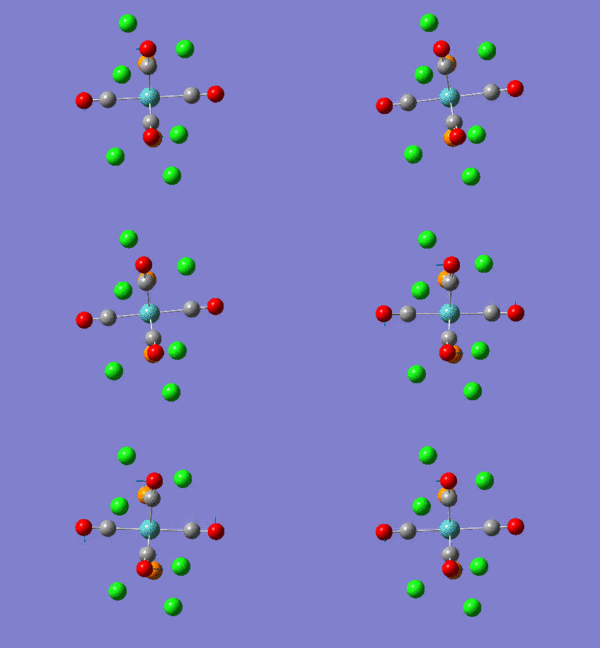 |
| Stretching mode | frequency/cm-1 | Intensity | Animation |
| 1 | 5 | 0.904 | 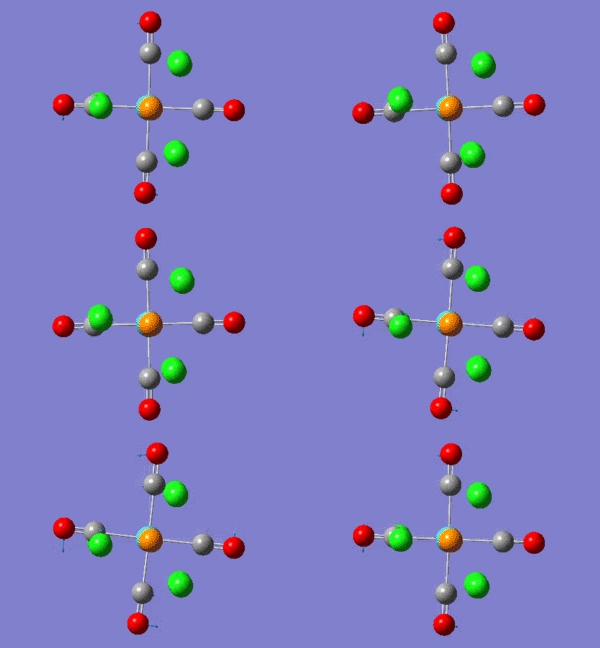 |
| 2 | 6 | 0 | 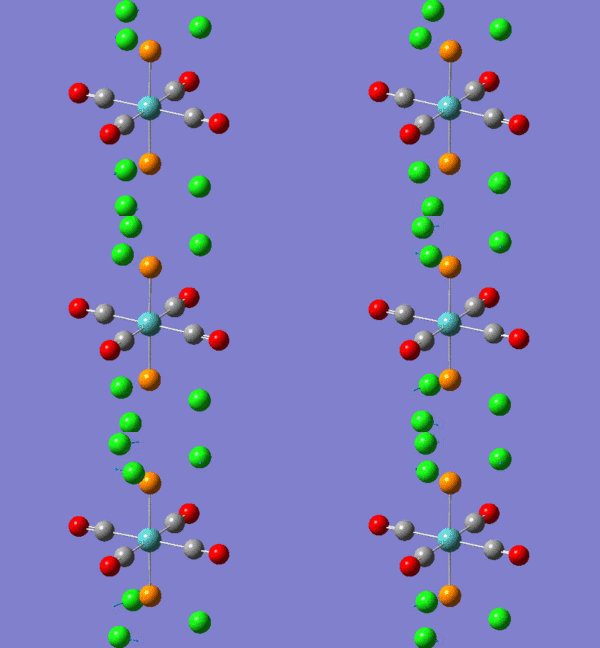 |
| 3 | 37 | 0.4 | 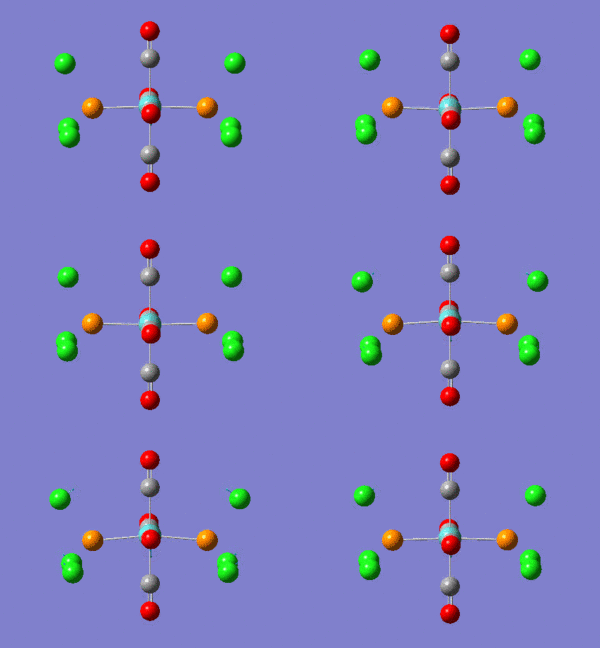 |
All of the reported vibrations were positive, thus confirming a minimum in energy was obtained. Below are reported the carbonyl stretches for the two different isomers. Experimental values for reference are given for both the Cis and Trans products[3]. The geometry of these vibrations under the C2v (Cis) and D4H (Trans) point groups are given.
| Stretching mode | frequency/cm-1 | Intensity | Literature frequency/cm-1 | Symmetry |
| 42 | 1945 | 763 | 1941 | B2 |
| 43 | 1949 | 1499 | 1948 | B1 |
| 44 | 1958 | 633 | 1965 | A1 |
| 45 | 2023 | 597 | 2049 | A1 |
| Stretching mode | frequency/cm-1 | Intensity | Literature frequency/cm-1 | Symmetry |
| 42 | 1951 | 1475 | 1943 | Eu |
| 43 | 1951 | 1467 | 1943 | Eu |
| 44 | 1977 | 0.6 | 1985 | B1g |
| 45 | 2031 | 4 | 2050 | A1g |
The two tables above show that in theory the same number of peaks is predicted for both isomers. However, while the Cis isomer gives rise to 4 fairly strong absorptions at slightly different frequencies, the Trans isomer has two of its only strong stretches at the same frequency (vibration 42 and 43). The other two stretches (44 and 45) are so weak that they are not seen. Thus this explains why when running a normal IR the trans-isomer will give 4 peaks while the Trans will only give one. This can also be seen in the IR spectra reported at the beginning of this section.
Miniproject: Effects on MOs and NBOs by substituting the benzene ring with group 15 atoms
Introduction
Similar compounds to pyridine but with different heteroatoms were only first synthesized in 1971. This had a huge impact in chemistry, because by studying their structures it is possible to infer the degree of aromaticity and participation of the d orbitals of the heteroatom in the bonding. In this report the techniques used in the previous part of the course were used to computationally determine the differences between benzene, pyridine, phosphabenzene and Arsenine.
Optimization
The 4 molecules were all optimized using the same method and basis set in order to make comparisons possible.
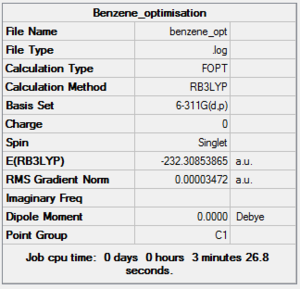 |
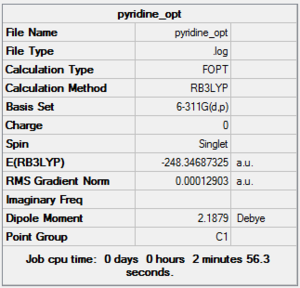 |
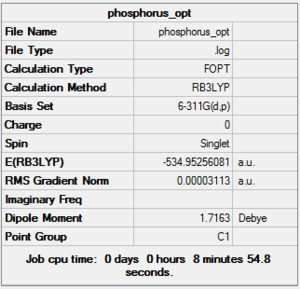 |
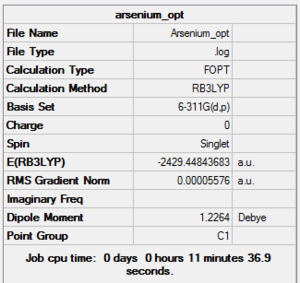 | |||
The point group is however clearly wrong for the three molecules. The predicted point group would be D6h for Benzene and C2V for pyridine. For phosphabenzene and Arsenine the point group depends on whether the heteroatom moves above or below the ring, thus removing the planar geometry. However, considering they didn't move in the above optimizations, which were carried out with no geometry constrains, it is likely that the only effect is a stretch in the carbon to heteroatom bond as the group is descended. The optimizations were therefore carried out again setting the geometry tight to the expected point group.
Final Optimisations
Benzene DOI:10042/to-10877 PyridineDOI:10042/to-10879 PhosphobenzeneDOI:10042/to-10883 ArsebenzeneDOI:10042/to-10891
Frequency analysis
Frequency analysis was carried out on all four molecules in order to determine if a global minimum was obtained in the optimization. Same method and basis set was used as from the optimization step.
Benzene DOI:10042/to-10892 Pyridine DOI:10042/to-10893 Phosphabenzene DOI:10042/to-10894 Arsenine DOI:10042/to-10895
No negative frequency was noticed for any of the structures, thus the project was continued to show the structural difference between the molecules.
Structural analysis
As expected by analyzing the optimized benzene the C-C-C angle was found to be 120° while the C-C bond length was found to be 1.39 Å.
The C-N bond length in pyridine was measured to be 1.34Å while the C-C bond length stayed constant at 1.39Å. The C-N-C angle was 117° while the C-C-C went to 119°.
In Phosphabenzene the C-P length increased to 1.74Å while the C-C stayed constant. The C-P-C angle measured 123°.
In Arsenine the C-As bond length increased even further to 1.86Å and correspondingly the angle C-X-C angle (where X is the heteroatom, As in this case) decreased to 96.8°.
All 4 molecules are flat. The reason why the C-X bond length increases when going down group, is because of the interaction between the aromatic ring and the filled d orbitals. This repulsive interaction pushes the heteroatom away from the ring thus increasing the bond length.
MO diagrams
The following MO diagrams were obtained by reopening the optimized geometry file in Gaussian and the calculation was set for energy; in order to find the molecular orbitals. The same method as for the optimization was used with the addition of the full NBO requirement and the key word pop=full. The computed MOs are reported below.
Benzene DOI:10042/to-10907 Pyridine DOI:10042/to-10909 Phosphabenzene DOI:10042/to-10910 Arsenine DOI:10042/to-10968
Full MO diagram of benzene
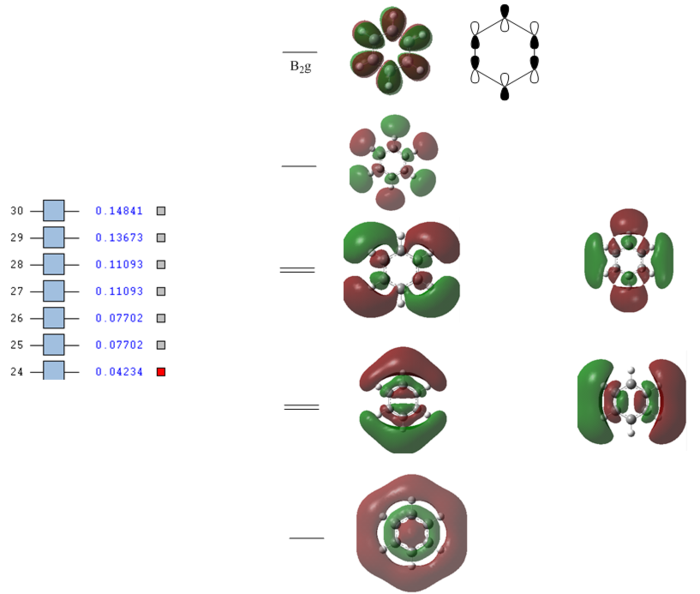
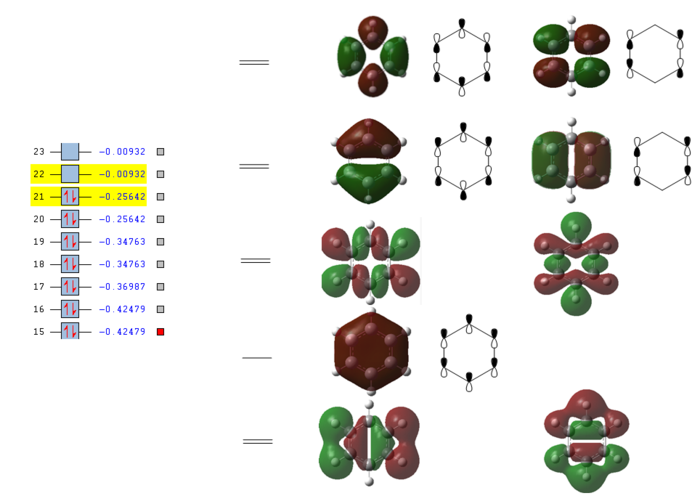
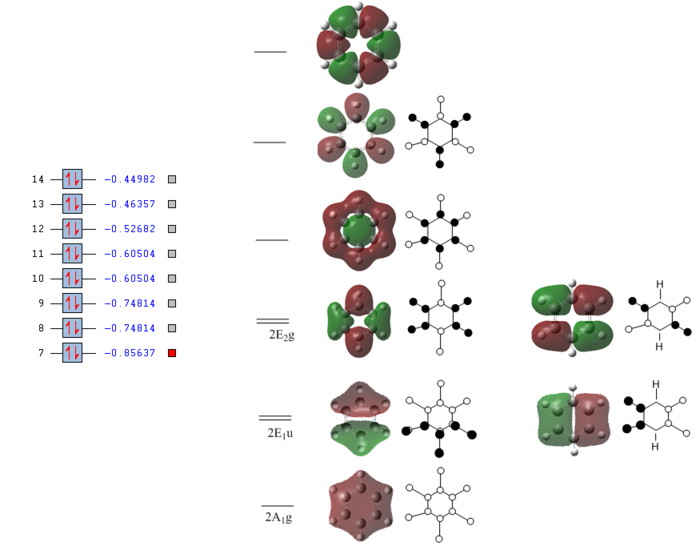
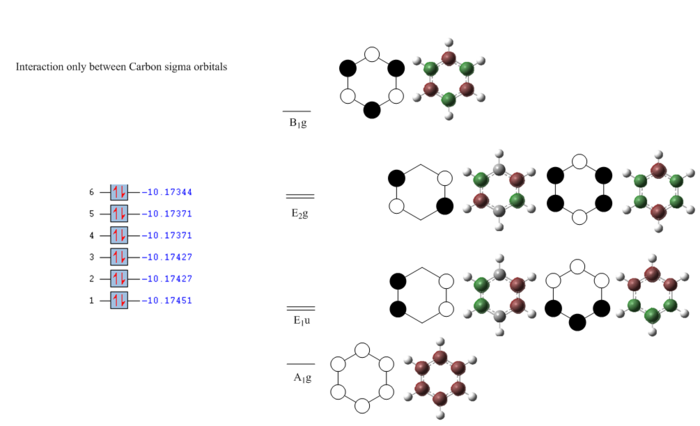
The energy of each orbital was reported by taking a snapshot of Gausview and pasted next to the orbitals of interest. This also shows which orbitals are filled and which ones are empty.
The diagram clearly shows how at low energies the C s orbitals bond interact only between themselves. At higher energies The hydrogen s orbitals start interacting with the carbon s orbital network and at even higher energies the p orbitals on the carbon atom get involved. Going up the MOs it becomes increasingly difficult to assign their symmetry label. No literature was found containing the full MO diagram of benzene, as usually only the p-orbitals are considered.
Developing a full qualitative MO diagram for benzene, starting from appropriate fragment orbitals, is a very complex task and outside the scope of this project. This is a very good example of when quantitatively computing the actual MOs is easier than qualitatively representing them.
Simplified MO diagram for pyridine
For simplicity this time only the p orbitals where considered in the diagram.

From the simplified diagram above it can be seen that the orbitals for pyridine closely resemble those from benzene. The MOs for phosphabenzene were also calculated and again the result looked almost identical to the MOs from pyridine and benzene.
The only difference is between the three is that when a heteroatom is added to the system a loss of symmetry occurs. In benzene most of the orbitals come as degenerate pairs, this is no longer the case in pyridine and phosphabenzene due to the loss of symmetry. This is easily observed by looking at the energies of the MOs on the diagrams above.
IR analysis
The repulsion of the heteroatom from the ring will cause the C-X bond to get weaker when moving from P to As. This will be inspected in this section. To see the animation click on the picture.
Phosphabenzene
| vibration mode number | frequency/cm-1 | intensity | animation |
| 7 | 766 | 0.27 |  |
| 8 | 780 | 1.6 |  |
Arsenine
| vibration mode number | frequency/cm-1 | intensity | animation |
| 6 | 665 | 2 |  |
| 7 | 676 | 0.09 |  |
The selected data from the two IR spectra seems to confirm the theory of the bond getting weaker on going down the group. The frequency of the C-X stretch clearly decreases in going from Phosphorous to Arsenic.
Conclusion
The project was able to provide a first account on the differences between benzene pyridine, phosphabenzene and arsenine using the techniques learned in this module. In particular, the differences in the MO and structure was discussed. IR was also computationally developed in order to confirm the observed trends.

