Rep:Mod:lp0190 module1
Module 1: Modelling with Molecular Mechanics
Introduction
The molecular mechanics (MM) approach tries to study molecular properties such as strain, hindrance and stability of molecular conformation, without the need of solving wave equations; it studies them in terms of bond properties thus not using quantum mechanical approaches. MM assumes that the energy of a molecular system comes from 5 additive and non-interacting terms:
- The sum of all diatomic bond stretches (each expressed as a simple Hookes law potential). Stretch
- The sum of all triatomic bond angle deformations (also a simple Hookes law potential). Bend
- The sum of all tetra-atomic bond torsions (a cosine dependance).Torsion
- The sum of all non-bonded Van der Waals repulsions (using a simple 6/12 potential). Van Der Waals
- The sum of all electrostatic attractions of individual bond dipoles. Dipole-Dipole
This terms were found and compared, using ChemBio 3D in order to predict the geometry and regioslectivity of:
- the hydrogenation of a cyclopentadiene dimer
- the conformation/atropisomerism of a large ring ketone intermediate in one synthesis of the anti-cancer drug Taxol
In the second part of the course modelling was carried out using Semi-empirical Molecular Orbiatal Theory. This approach was used to explain the regioselective addition of dichlorocarbene on a nuocleophillic reagent.
A combination of these two methods was then used to study Glycosidation.
Finally, The miniproject was instead focused on comparing experimentally obtained spectra for the synthesis of (-)Cubebol with spectra produced computationally, in order to check the reliability of computational methods.
The Hydrogenation of Cyclopentadiene Dimer


Cyclopentadiene dimerizes via a [4+2] cycloaddition reaction to give the Endo product (2) in preference to the Exo product (1), as predicted by the Endo rule[1] . In this experiment the energy of the two products were analyzed using MM2.
Table 1: Comparison of the energies of the Exo and Endo products
| Energies/ kcal mol-1 | |||||||
| Stretch | Bend | Stretch-Bend | Torsion | Van der Waals | Dipole-Dipole | Total | |
| Exo isomer | 1.29 | 20.58 | -0.84 | 7.66 | 2.81 | 0.38 | 31.88 |
| Endo isomer | 1.25 | 20.84 | -0.84 | 9.51 | 2.77 | 0.45 | 34.00 |
From the table it can be seen that the Exo product (1) is lower in total energy by 2.12Kcal/mol, as a result of less torsional strain. This means that the Exo product (1) must be the thermodynamic product. The fact that product (2) is usually produced in preference during a reaction, must mean that this is instead the kinetic product. This means that product (2) is formed at a faster rate than product (1), which is the result of having a lower activation energy. The reason why the Endo product, transition state, has a lower activation energy and is therefore formed in preference during the reaction (if carried out under kinetic conditions) is due to good positive( almost bonding) overlap between the HOMO orbitals of one ring and the LUMO orbitals of the other ring as shown by the arrows in the picture below. This doesn't exist in the Exo transition state (TS), thus leading the Exo TS to be higher up in energy.
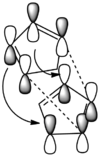
The dotted lines represent the sigma bonds made, while the curly lines represent the stabilization due to the positive overlap.
When the dimer is hydrogenated, the hydrogen initially attacks only one C-C double bond, thus forming either Product (3) or Product (4). Again MM2 was used to determine the lowest energy structure.


Table 2: Comparison of the energies of the hydrogenation products
| Energies/ kcal mol-1 | |||||||
| Stretch | Bend | Stretch-Bend | Torsion | Van der Waals | Dipole-Dipole | Total | |
| Structure 3 | 1.24 | 18.94 | -0.76 | 12.13 | 4.22 | 0.16 | 35.93 |
| Structure 4 | 1.09 | 14.53 | -0.55 | 12.49 | 3.44 | 0.14 | 31.15 |
From the table it’s possible to see that the difference between structure (3) and structure (4) is 4.78 Kcal/mol. This is due to the difference in bend energy between the two, which, as defined in the introduction, is the result of the angular strain. In structure 4 the angle is 113 oC, while in structure 3 this angle is only 108oC. This poses great strain on structure 3, as the ideal angle would be 120oC, as the carbon is sp2 hybridized. Thus structure 4 will be the lowest in energy and the thermodynamic product.
Stereochemistry and Reactivity of an Intermediate in the Synthesis of Taxol.
Below are reported two key intermediates in the synthesis of Taxol. On standing the compound isomerises to the alternative carbonyl isomer. Isomer 9 has the carbonyl pointing upwards, while Isomer 10 has the carbonyl pointing downwards. This is an example of altropisomerism. This is the distinction between two molecules which arises due to restricted rotation about a single bond, usually (as in this case) because of high steric demand.
In order to determine the stereochemistry of the carbonyl addition the most stable isomer was determined using MM2.
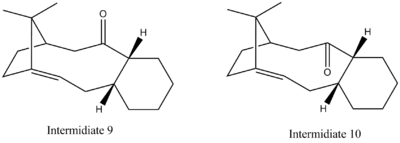
Table 3: Comparison of the energies of the two intermediates
| Structure | Total Energies/ kcal mol-1 | ||
| MM2 | MMFF94 | 3D structure | |
| Isomer 9 (chair) | 47.84 | 70.54 |
|
| Isomer 9 (twist boat) | 53.01 | 78.98 |
|
| Isomer 10 (chair) | 42.68 | 60.55 |
|
| Isomer 10 (twist boat) | 48.16 | 66.32 |
|
The table above shows that while it’s not possible to compare directly the magnitude of MM2 and MMFF94, as they are 2 different approaches in calculating the total energy, they are still very similar in terms of trends. To minimize the energy, the structure was changed manually and it can be seen that both intermediates are at lower energy when the hexane ring is in the chair conformation. From the table it can be deduced that intermediate 9 is formed first but then converts to intermediate 10 as this is lower in energy by 5.16 Kcal/mol.
The functionalization of the alkene proceeds really slowly due to the fact that both isomers are hyperstable alkenes[2]. This means that they do not tend to hydrogenate. This can again be explained in terms of angular strain. As reported below the double in the Taxol intermediate bond has almost no angular strain as its bond angles are very close to the ideal angle for an sp2 carbon center of 1200C. On the other hand, the alkane derivative has two bond angles much smaller than the sp3 ideal angle of 109.5 and two angles much bigger. This poses a lot of strain on the system, thus causing hydrogenation to be very slow as additional energy is required to make the reaction viable. The exact angles as calculated from ChemBio 3D can be seen in the picture below.
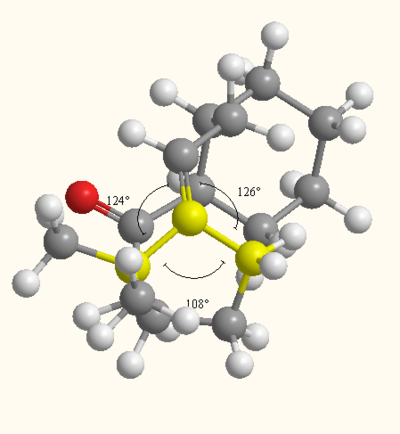 |
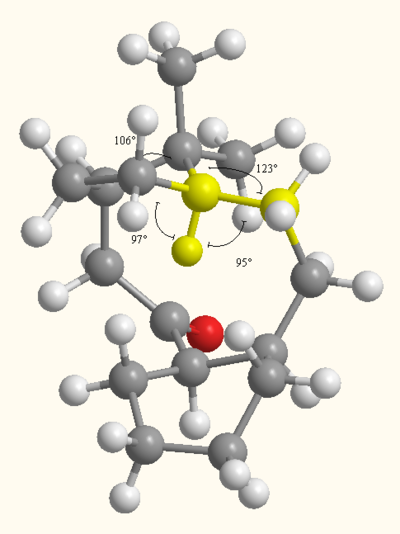 |
Modelling Using Semi-empirical Molecular Orbital Theory

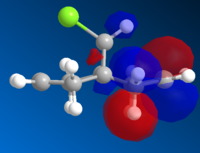
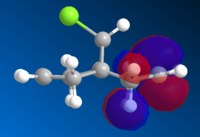
The reaction of compound 12 with electrophilic reagents (dichlorocarbene in this case) was used to illustrate the orbital control of reactivity. An approximation of the valence-electron molecular wavefunctions was developed using the MOPAC/RM1 MO method. Unlike Molecular mechanics, this method takes into consideration the electrons involved in the molecule and therefore treats the molecule using a quantum mechanical approach.
 |
 |
 | ||
 |
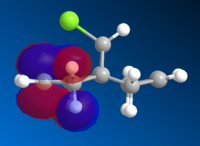 |
The HOMO is clearly the most reactive orbital of product 12, as it is the highest energy occupied MO. As a result the HOMO is the orbital involved in the nucleophillic attack at the carbene. From the graphical representation it can be seen that the HOMO is exclusively on the Endo double bond, thus explaining the regioselectivity of the attack. The system therefore does discriminate between the two rings and in particular between the two double bonds.
The reason for this discrimination is because the π orbital of the EXO double bond (which from the picture can be seen as the HOMO-1) can easily overlap with the σ* antibonding orbital of the C-Cl bond (which in the picture is depicteda s the LUMO+1. The Exo π orbital, tehrefore donates electrons to the antibonding orbital of the C-Cl bond thus leading to a stabilisation of the Exo π orbital and a destabilisation of the C-Cl orbital. This means that the tendency of the Exo double bond to act as a nucleophile is decreased as the orbital is lowered in energy. Also according to this argument the C-Cl orbital should be weaker. A way to assess this is to use IR spectroscopy.
IR data
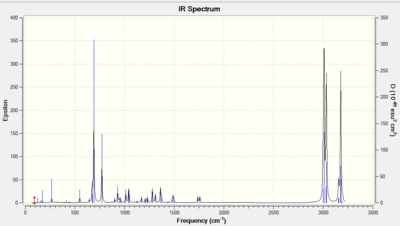
An IR of structure 12 DOI:10042/to-10480 and hydrogenated structure 13 DOI:10042/to-10481 was simulated using Gaussian. Their spectra and the individual peaks are reported below in order to prove the previous argument.

 |
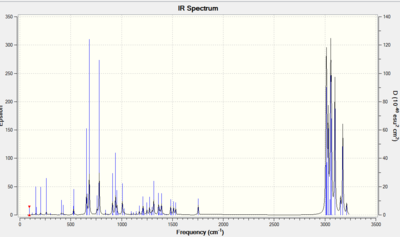 | |
Table 4: Comparison of the IR data for the two prodcuts (all figures are expressed in cm-1)
| IR - peaks | Compound 12 | Compound 13 | |
| C-Cl | 770.81 | 780.03 | |
| C=C (endo) | 1757.43 | 1753.72 | |
| C=C exo | 1737.01 | N/A |
As expected the C=C Endo double bond in product (12) is higher in wavenumber (and therefore higher in energy) than the C=C Exo double bond, thus confirming the previous argument involving the donation from the Exo π bond into the C-Cl σ* antibonding orbital. Another confirmation of the previous argument is the fact that the C-Cl stretch gets stronger in Product (13) as there is no more electron donation into its antibonding orbital.
Monosaccharide chemistry: glycosidation
In this section the facial preferences (diastereospecificity) of glycosidation were modeled using MM2 and MOPAC/PM6 methods. MOPAC/PM6 is better duited for the task as it views the molecule from a quantum mechanical perspective and is therefore able to take into account orbital effects which MM2 is not able to do. Me was chosen as an appropriate R group for the calculation as it represents the chemistry, while keeping the computational demand minimal.
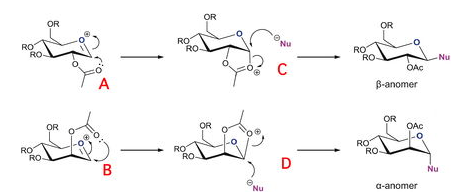
These methods were used to find which conformers had the lowest energy.
Table 5: MM2 and MOPAC energies of A, A', B, B' (all figures are expressed in Kcal/mol)
| Conformer | Stretch | Bend | Stretch-Bend | Torsion | Non-1,4 VDW | 1,4 VDW | Charge/Dipole | Dipole/Dipole | MM2 Total Energy | MOPAC/PM6 heat of formation |
| A | 2.2877 | 11.0314 | 0.8495 | 1.1219 | -0.665 | 19.2574 | -19.6728 | 7.2798 | 21.49 | -87.8197 |
| A' | 2.3888 | 11.2056 | 0.9027 | 1.3279 | -0.5658 | 19.1496 | -9.3255 | 6.4076 | 31.4908 | -80.73995 |
| B | 2.3585 | 10.5919 | 0.9248 | 3.7672 | -1.8727 | 19.4619 | -10.6142 | 5.8558 | 30.4731 | -88.71881 |
| B' | 2.6136 | 16.243 | 1.2093 | 4.565 | -1.6493 | 18.8353 | 4.9063 | 5.5576 | 52.2809 | -72.84482 |
From the table it’s easy to see how the conformation of A and B are more stable than their dashed reciprocals. A is more stable than A’ by 7.15 kcal/mol and B is more stable than B’ by 15.87 Kcal/mol, as explained in the beginning MOPAC values are used instead of MM2 as these are more accurate and more likely to represent the global minimum. The difference between the two conformers arises because in A and B the oxonium ion is stabilised as the acyl group points towards it, however, this stabilisation doesn’t occur in their dashed reciprocals, where the acyl group points away from the oxonium ion.
Due to different methods (Classical versus Quantum mechanical) the structure of the molecule changes when minimised from MM2 to MOPAC/PM6, therefore Jmol files, showing the structure after each minimisation are provided below.
Table 6: 3D structures of A, A', B, B'
| Conformer | MM2 3D structure | MOPAC/PM6 3D structure |
| A | Jmol | Jmol |
| A' | Jmol | Jmol |
| B | Jmol | Jmol |
| B' | Jmol | Jmol |
The same calculation was carried out for the intermediates C and D and the results are reported below.
Table 7: MM2 and MOPAC energies of C, C', D, D' (all figures are expressed in Kcal/mol)
| Conformer | Stretch | Bend | Stretch-Bend | Torsion | Non-1,4 VDW | 1,4 VDW | Charge/Dipole | Dipole/Dipole | MM2 Total Energy | MOPAC heat of formation |
| C | 1.807 | 16.811 | 0.764 | 8.594 | -3.669 | 17.433 | -4.838 | -0.109 | 36.793 | -91.66 |
| C' | 2.770 | 17.972 | 0.860 | 9.603 | -2.299 | 19.384 | -0.114 | -1.659 | 46.516 | -66.84 |
| D | 1.814 | 15.326 | 0.569 | 6.311 | -3.221 | 17.966 | -10.197 | -0.869 | 27.698 | -87.99 |
| D' | 2.642 | 19.249 | 0.768 | 6.210 | -2.724 | 18.453 | -2.153 | -1.017 | 41.427 | -65.29 |
Table 8: 3D structures of C, C', D, D'
| Conformer | MM2 3D structure | MOPAC/PM6 3D structure |
| C | Jmol | Jmol |
| C' | Jmol | Jmol |
| D | Jmol | Jmol |
| D' | Jmol | Jmol |
Comparing table 5 and table 6 it can be seen how, under the MOPAC/PM6 optimisation, structure A is almost equal in energy to structure C and structure B is almost equal to structure D (only a few kcal/mol differences, probably due to the difficulty of locating exactly the global minimum). This is because MOPAC sees A in the same way as C and B in the same way as D as it minimises the energy by considering the molecule as a whole. Therefore, the electronic interactions between the acyl group and the oxonium ion in A and B are the considered, by MOPAC, to be the same as an actual bond, as in C and D.
From table 5 it can be seen that C’ and D’ are much less stable than C and D. The difference between the two is 24.82 kcal/mol (between C and C’) and 23Kcal/mol (between D and D’). The explanation for this difference can be found in the anomeric effect[3]. In C and D the C-O σ* orbital is in the correct orientation (axial) to overlap with the (axial) orbital of the oxygen lone pair, thus donation from the lone pair to the C-O σ* strengthens the structure, by delocalising the positive charge. This doesn’t happen in C’ and D’ as they are equatorial, as shown in the picture below.

The computational results can therefore be used to rationalise the diastereospecificity in glycosidation, as they show how the extra stability of the anomeric effect pushes the neighbouring group to occupy the axial face of the oxonium ion and therefore leads the nuocleophile to attack from the opposite face.
Miniproject: The total synthesis of (-)Cubebol
The aim of this project is to use computational techniques in order to test whether the information and assignment of the experimentally obtained spectra for the synthesis of (-)Cubebol, was correct. The absolute configuration argued for in the literature[4] is reported below.
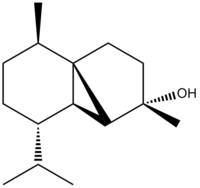
The compound was first analyzed using 13 Carbon NMR. The spectra was obtained using the GIAO method, which consists of first optimizing the geometry using MM2, Mopac and DFT methodsDOI:10042/to-10487 .
The predicted 13C NMR DOI:10042/to-10386 of the product is reported below and compared to the literature. The atom assignment used is also reported below.
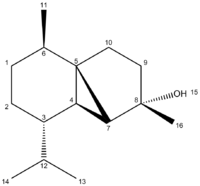

Table 9: '''Computationally obtained NMR data compared with experimentally obtained literature.'
| Carbon Atom | Chemical shift/ ppm | Literature/ppm |
| 8C C-OH | 78.5931 | 80.3 |
| 3C | 39.5805 | 44.1 |
| 9C | 37.7113 | 39 |
| 10C | 34.7207 | 36.3 |
| 5C | 34.3296 | 33.6 |
| 7C | 34.2256 | 33.4 |
| 12 C | 31.0369 | 31.7 |
| 16 C | 30.6429 | 30.8 |
| 6C | 30.349 | 29.5 |
| 4C | 25.4678 | 27.9 |
| 1C | 25.1072 | 26.4 |
| 12C | 23.3314 | 22.6 |
| 14C CMeMe | 21.6358 | 20.1 |
| 2C CMeMe | 20.86 | 19.6 |
| 11 C CHME | 20.1029 | 18.7 |
From the table it can be seen that the computationally obtained 13C NMR data is in agreement with the experimentally obtained one from the literature, as the difference between peaks is never greater than 5ppm.
The IR spectrum of Cubebole DOI:10042/to-10423 was also computed, in order to see to what extent the computational techniques are in agreement with the experimental results. The spectrum was computed after optimizing the geometry with B3LYP/6-31G(d,p). The spectrum is reported below.

Table 10: '''Computationally obtained IR data compared with literature values experimentally obtained.'
| IR peaks | Computationally obtained/ cm-1 | Literature/cm-1 |
| O-H stretch | 3794.66 | 3350 |
| C-H stretch | 2992.78 | 2951 |
| C-H bend | 1499 | 1490 |
The peaks are very similar for the C-H stretch and the C-H bend while the predicted peak for the O-H stretch is much higher than the literature value one. This is because high energy peaks are systematically too high by about 8%. Therefore if this is taken into consideration the computationally obtained OH peak will be 3491 cm-1, thus fairly close to the literature value. This shows (at least in this case) the effectiveness of computational techniques in determining IR spectra.
Cubebol is a chiral molecule, therefore, the easiest way to determine whether the absolute configuration shown is right is to measure the optical rotations. This can be done computationally using the Cambridge variation on the B3LYP (cam-b3lyp). The wavelength of the incident light was set to 589nm (which is the sodium D line).
The computationally calculated optical rotation was 13.85 deg.DOI:10042/to-10486 while the value reported in the literature is -48.3deg.. What is by far the most likely reason for this difference is that the geometry of the molecule was slightly wrong. A copy of the optimized geometry file, used for NMR, was used to calculate the optical rotations, however, optical rotation is much more sensible to conformations than NMR and a slight change in conformation can lead to massive changes in the rotation of light.
A good way to further test if the result was wrong or not, would be to perform an optical rotation analysis of the opposite conformer and see the result. If the optical rotation for the opposite conformer is positive it would clearly highlight something wrong with my structure or the method (as my result for the opposite conformer was also positive), while if it was negative it could suggest a problem with the literature data or with the method used to compute the results.
References
- ↑ Clayden, J.; Greeves, N.; Warren, S.; Wothers, P.; ‘Organic Chemistry’, 1st Ed., Oxford University Press, Oxford, 2001, pp. 916
- ↑ Wilhelm F. Maier, Paul Von Rague Schleyer, J. Am. Chem. Soc., 1981, 103, 1891. DOI: 10.1021/ja00398a003
- ↑ E. Tate, bioorganic chemistry, second year, Chemistry department, Imperial College
- ↑ K. Mori, The Chemical Record, 2005, ii5, 1-16. DOI:10.1002/tcr.20030
