Rep:Mod:llq211
Bonding and molecular orbitals in Main Group compounds
BH3 molecule
BH3: B3LYP/3-21G level
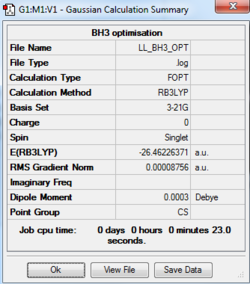
The optimisation log file of Cs point group is here
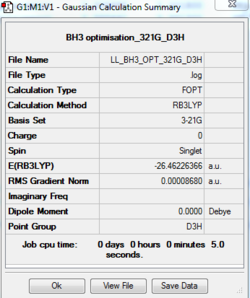
The optimisation log file of D3H point group is here
The pointing group obtained initially was Cs, which is not the right symmetry for BH3, D3H. This is because the program, Gaussview, is not accurate enough for optimizing the molecule by using such a low-accuracy basic set: 3-21G. Also, the symmetry of the molecule would change with a small difference in the x,y,z coordinates. By changing the bond distance (which is what the instruction says), the C3 rotational symmetry has been broken and led to the incorrect point group labelled.
By changing the point group to be D3h, finally, a trigonal planar geometry was achieved with H-B-H bond angle of 120°.
A better basis set was used for the following optimisation and analysis.
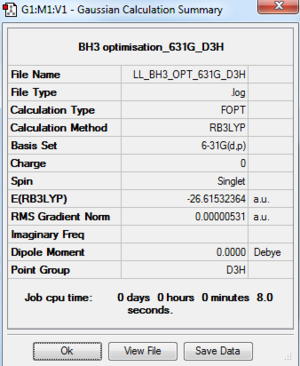
BH3: B3LYP/6-31G(d,p) Level
The optimisation log file is here
| Summary data | Convergence | Jmol | |||
|---|---|---|---|---|---|
 |
Item Value Threshold Converged? Maximum Force 0.000011 0.000450 YES RMS Force 0.000007 0.000300 YES Maximum Displacement 0.000042 0.001800 YES RMS Displacement 0.000027 0.001200 YES |
|
GaBr3: B3LYP/LANL2DZ
The optimisation file is DOI:10042/195207 and the optimisation log file is here
| Summary data | Convergence | Jmol | |||
|---|---|---|---|---|---|
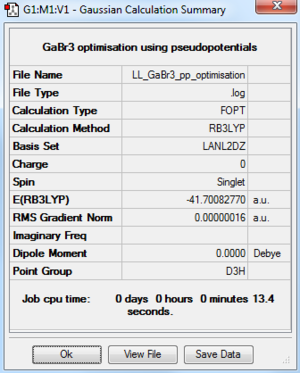 |
Item Value Threshold Converged? Maximum Force 0.000000 0.000450 YES RMS Force 0.000000 0.000300 YES Maximum Displacement 0.000003 0.001800 YES RMS Displacement 0.000002 0.001200 YES |
|
BBr3: B3LYP/GEN 6-31G(d,p) for B atom, LanL2DZ for Br atoms
The optimisation file is DOI:10042/195289 the optimisation log file is here
| Summary data | Convergence | Jmol | |||
|---|---|---|---|---|---|
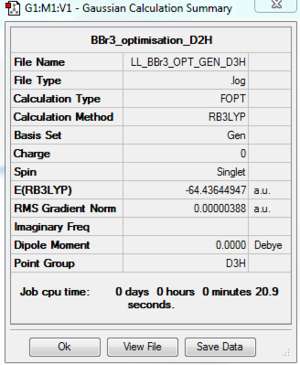 |
Item Value Threshold Converged? Maximum Force 0.000008 0.000450 YES RMS Force 0.000005 0.000300 YES Maximum Displacement 0.000036 0.001800 YES RMS Displacement 0.000024 0.001200 YES |
|
The point group obtained initially is Cs and after symmetrising, another optimisation is carried out to get the correct D3H point group.
Geometry Comparison
| BH3 | BBr3 | GaBr3 | |
|---|---|---|---|
| r(E-X) / Å | 1.19 | 1.93 | 2.35 |
| θ(X-E-X) / ° | 120.0 | 120.0 | 120.0 |
Comment
When comparing the bond length/strength of the molecules, there are mainly two factors that need to be considered: the size of atomic orbitals of individual atoms and the difference in electronegativities between different atoms.
By comparing the BH3 and BBr3 molecules, the difference is the ligands around the central atom, B. Changing from H to Br leads to an increase in bond length or a decrease in bond strength. The valence electronic configuration of H is 1s1 and Br is 4s24p5, so both atoms are one electron deficient from the perfect octet electronic configuration. Since both molecules have covalent bonds, the difference in electronegativities of two atoms would affect the bond length. The electronegativities of B, H, and Br are 2.0, 2.1, and 2.8 respectively, this means that the B and H would have a electronegativity difference of 0.1, whereras the B and Br is 0.8. If only the difference in electronegativity is considered: the larger the difference, the stronger the bond; this would give a strong B-Br bond than a B-H bond. However, by looking at the data shown above, B-Br has a longer and weaker bond than B-H, which mainly due to the atomic orbital overlap. As H, B, and Br are in period 1, 2, and 4 respectively, H has a better match in orbital size with B than Br does. The closer the size of the atomic orbitals, the stronger the bond. These two effects give opposite results, but the dominating effect here is the orbital overlap. Therefore, B-H bond is stronger and shorter than B-Br bond. In addition, as Br atom is larger and would have some extent of steric hinderance when binding to the central B atom, this would weaken the bond as well.
By comparing the bond length of BBr3 and GaBr3, the difference is due to the different central atoms. Both B and Ga are group 3 atoms, which have the same number of valence electrons; but Ga is in period 4 and is much larger than B. Although both the size and electronegativity tend to give a stronger Ga-Br bond, the effective orbital overlap between the central atom and the ligand is weaker for Ga (a more diffuse atomic orbital), and thus a weaker Ga-Br bond is formed.
All three molecules have relatively same bond angel, as the total structure does not change much.
Comparison of bond strength
A chemical bond refers to the interaction between atoms that allows the formation of a compound which contains two or more atoms. [1] It is mainly caused by the electrostatic force of attraction between atoms. The two atoms have opposite charges or they have some extent of induced charges.
The main types of intramolecular chemical bonding are covalent bonding, ionic bonding, and metallic bonding. They are all considered to be relatively strong or medium bond compared to intermolecular bonding, e.g. Van der Waals forces. [2]
1. Ionic bonding
Ionic bond is the strongest bond and formed by the electrostatic interaction between one positively charged species and one negatively charged one, due to their large electronegativity difference. The bond strength is often interpreted as “lattice energy”, which is a measure of attraction between ions in the solid.[3] The strength of ionic bonding is proportional to the charge of each ion and inversely proportional to the atomic radii. For example, the lattice dissociation enthalpy of MgO is greater than that of NaCl; and the lattice dissociation enthalpy of NaCl is greater that of NaBr. All these three bonds are considered as relatively strong bond.[4]
| Ionic Species | MgCl2 | NaCl | NaBr |
|---|---|---|---|
| Lattice dissociation enthalpy / kJ/mol | 2526 | 787 | 736 |
2. Covalent bonding
Covalent bonding is formed by sharing of electrons between two atoms. The strength of bond can be affect by many factors. For example, the electronegativity difference between two atoms. The larger the difference, the stronger the bond; as this covalent bond contains more extent of ionic character than those with small electronegativity difference. The three bonds shown below are considered as medium bond.[4]
There is a special type of bonding called dative bond, which is formed by donation of electrons from one atom (donor) to the other (acceptor). The so-called dative / co-ordinate bond is relatively weak, e.g. 110 kJ/mol for carbon monoxide.
| Compound | N-N | N-O | N-F |
|---|---|---|---|
| Dissociation enthalpy / kJ/mol | 163 | 201 | 272 |
The other important factor that can affect the bond energy is the hybridisation. The more s character contained in the bond, the stronger the bond, as s orbital is less diffuse than p orbital. In a simple comparison, triple bond is stronger than double bond, than single. (The trend does not work for all bonds, but explains well for C-C, N-N bond etc.)[4]
| Compound | N-N | N=N | N≡F |
|---|---|---|---|
| Dissociation enthalpy / kJ/mol | 163 | 418 | 941 |
3. Van der waals force
Van der waals force is an intermolecular interaction, which is the sum of attraction or repulsion forces between molecules. It mainly contains the dispersion energy, instantaneous dipole-dipole interaction, hydrogen bonding and π-π stacking. They are all relatively weak bond. Even the hydrogen bond, which is the strongest bond among those bondings (3-50 kJ/mol), is weaker than ionic and covalent bonding. The phenyl-phenyl (π-π stacking) is even less than 10 kJ/mol.
How Gaussview presents bond
Gaussview has a set of pre-defined bond lengths stored in the system, and when an optimisation is carried out, the programme finds the "minimum energy" in the potential energy surface and computes the structure. If the bond length of the optimised structure is longer than the pre-defined value, Gaussview would consider it as no longer a bonding exist, which is actually not true. In addition, the pre-defined bond lengths are based on organic compound and the molecules calculated here are inorganic, there would be slightly difference between them, thus sometimes leading to the absence of bonds shown.
Analysis of BH3: B3LYP/6-31G(d,p)
Frequency Analysis of BH3: B3LYP/6-31G(d,p)
The frequency analysis log file: here
| Summary data | Low modes |
|---|---|
 |
Low frequencies --- -12.3726 -12.3659 -7.7026 -0.0008 0.0238 0.4053 Low frequencies --- 1163.9693 1213.1355 1213.1357 |
Vibrational Analysis of BH3: B3LYP/6-31G(d,p)
| Wavenumber / cm-1 | Intensity | IR active? | Type | Vibrational Motion |
| 1163 | 93 | Yes | bend | 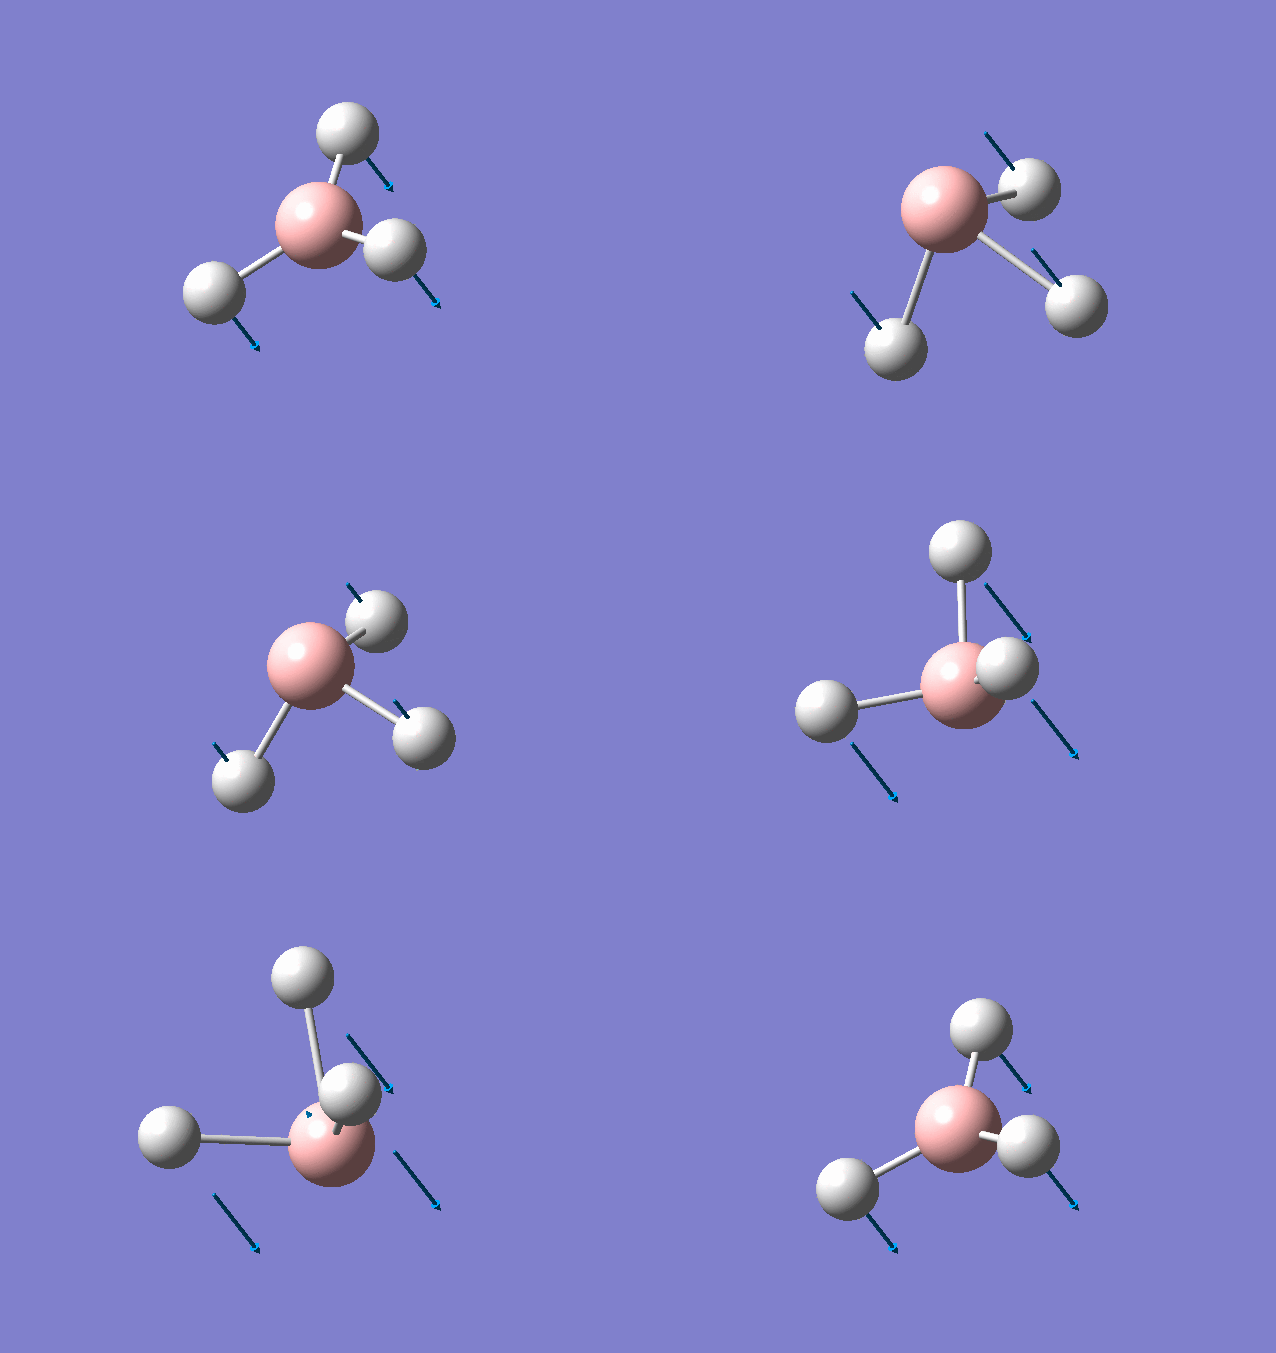
|
| 1213 | 14 | Yes(slight) | bend | 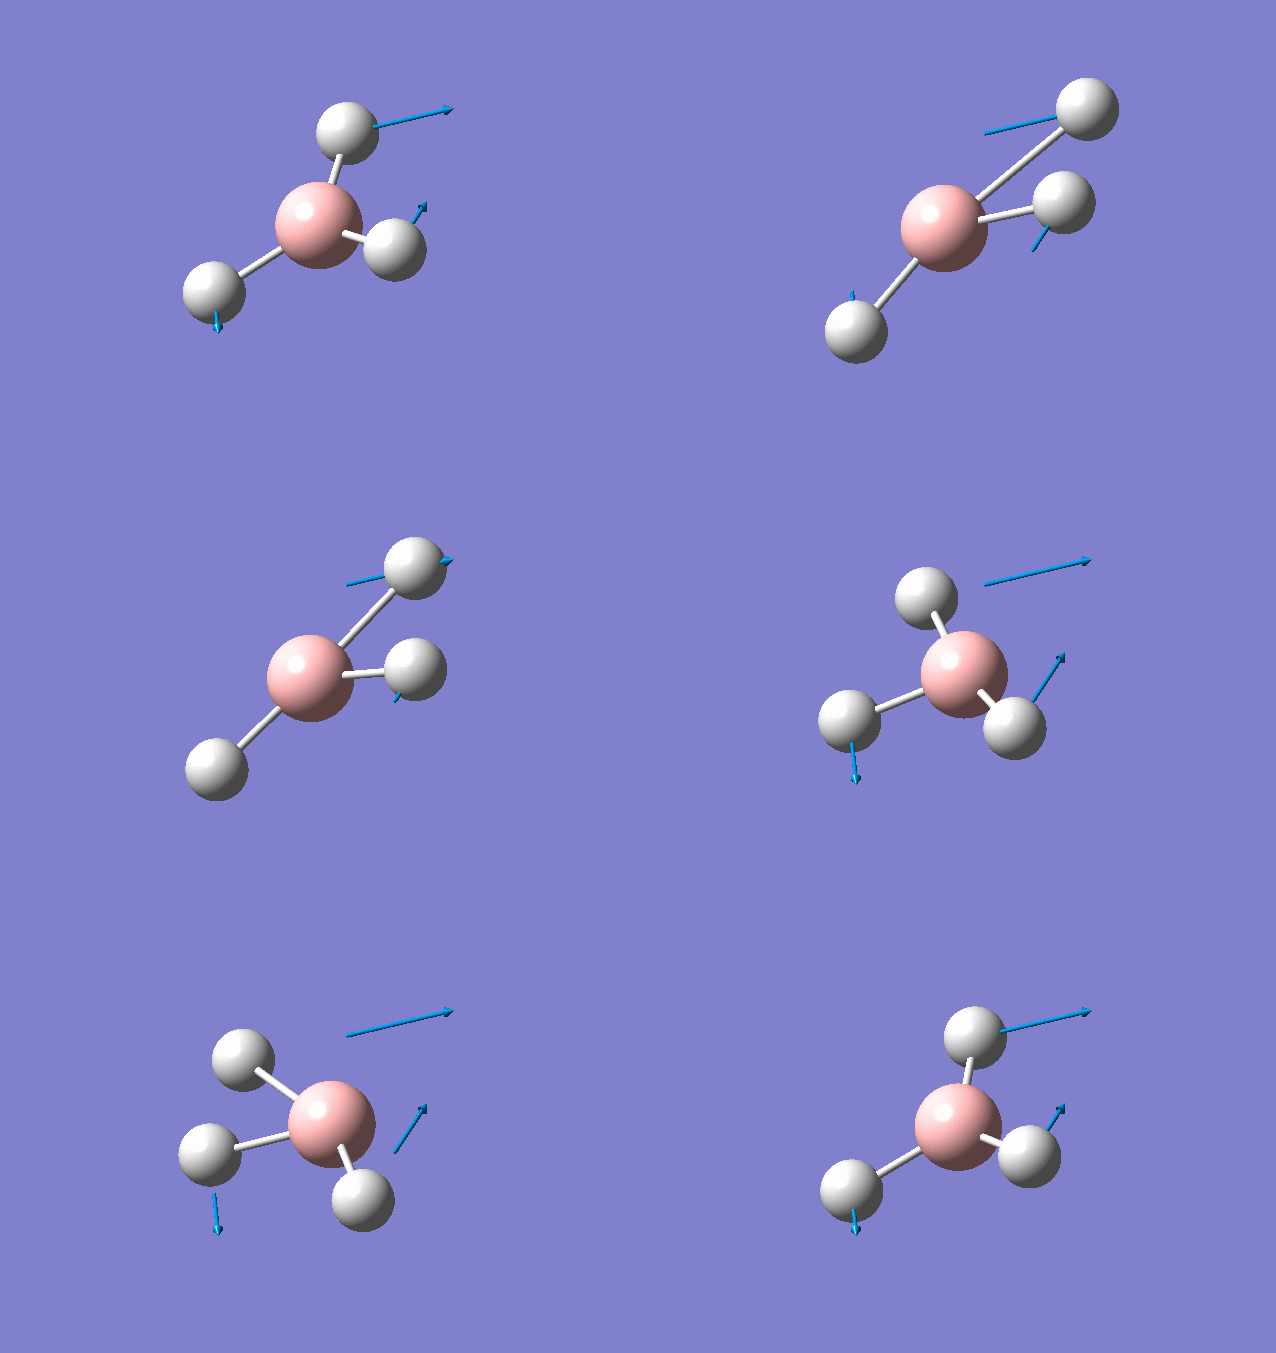
|
| 1213 | 14 | Yes(slight) | bend | 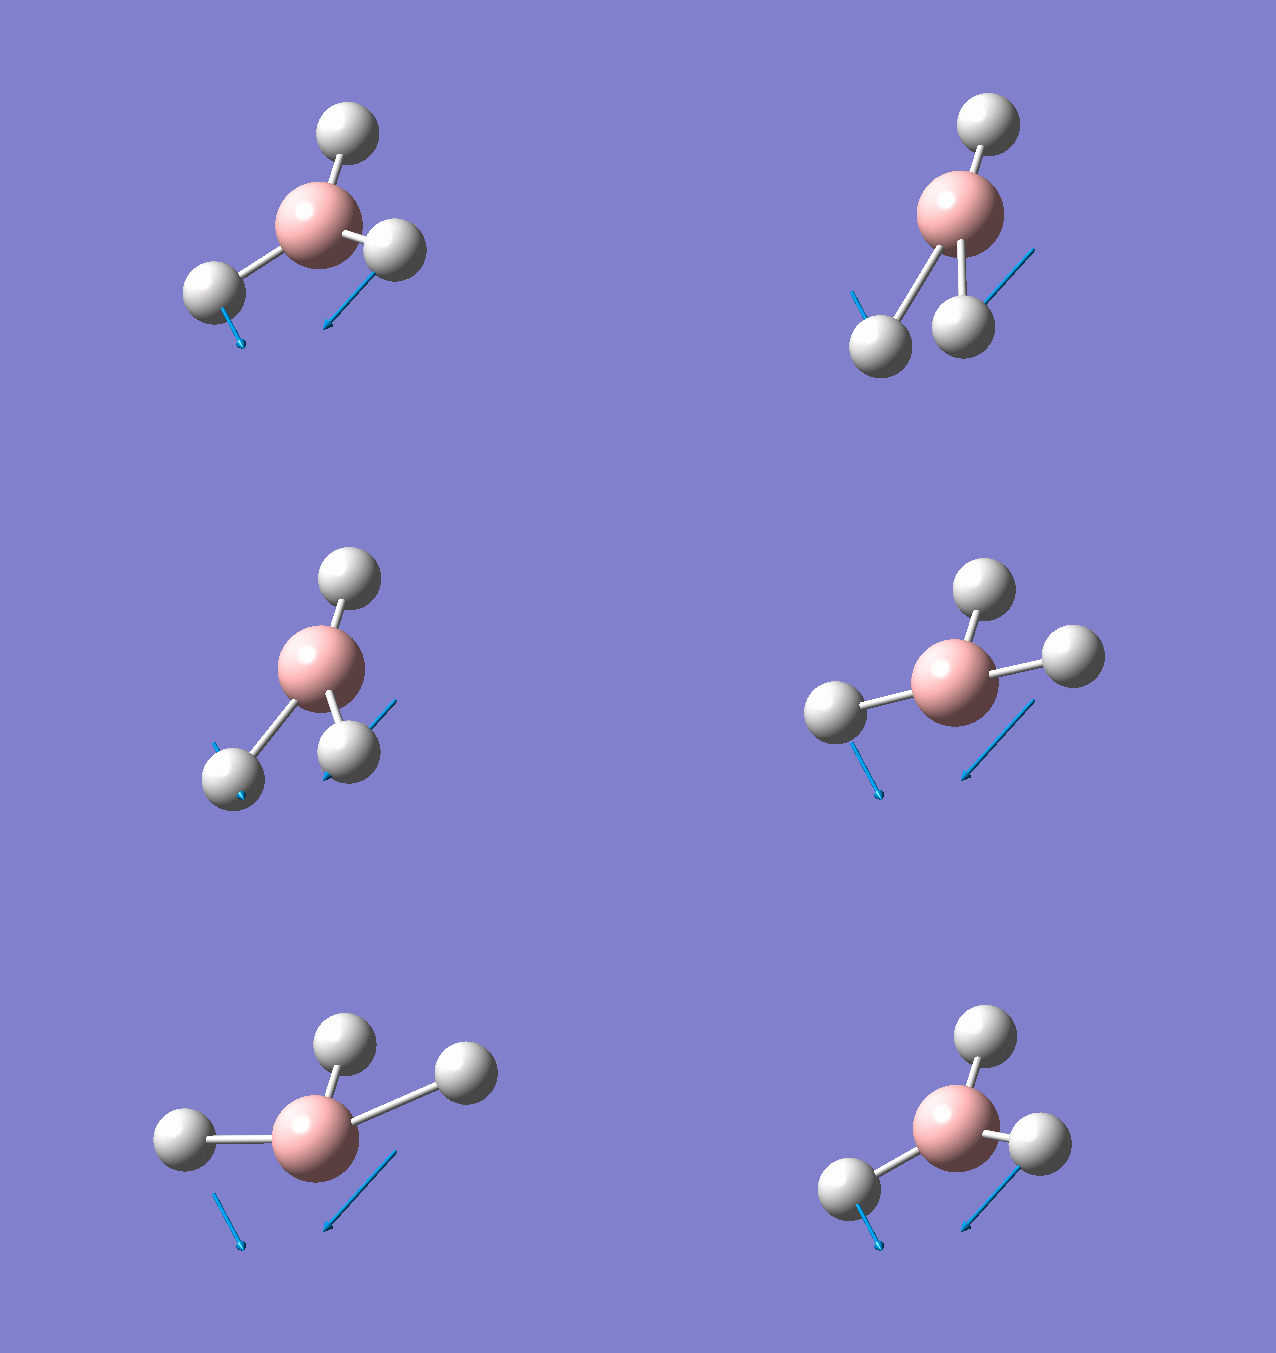
|
| 2583 | 0 | No | stretch | 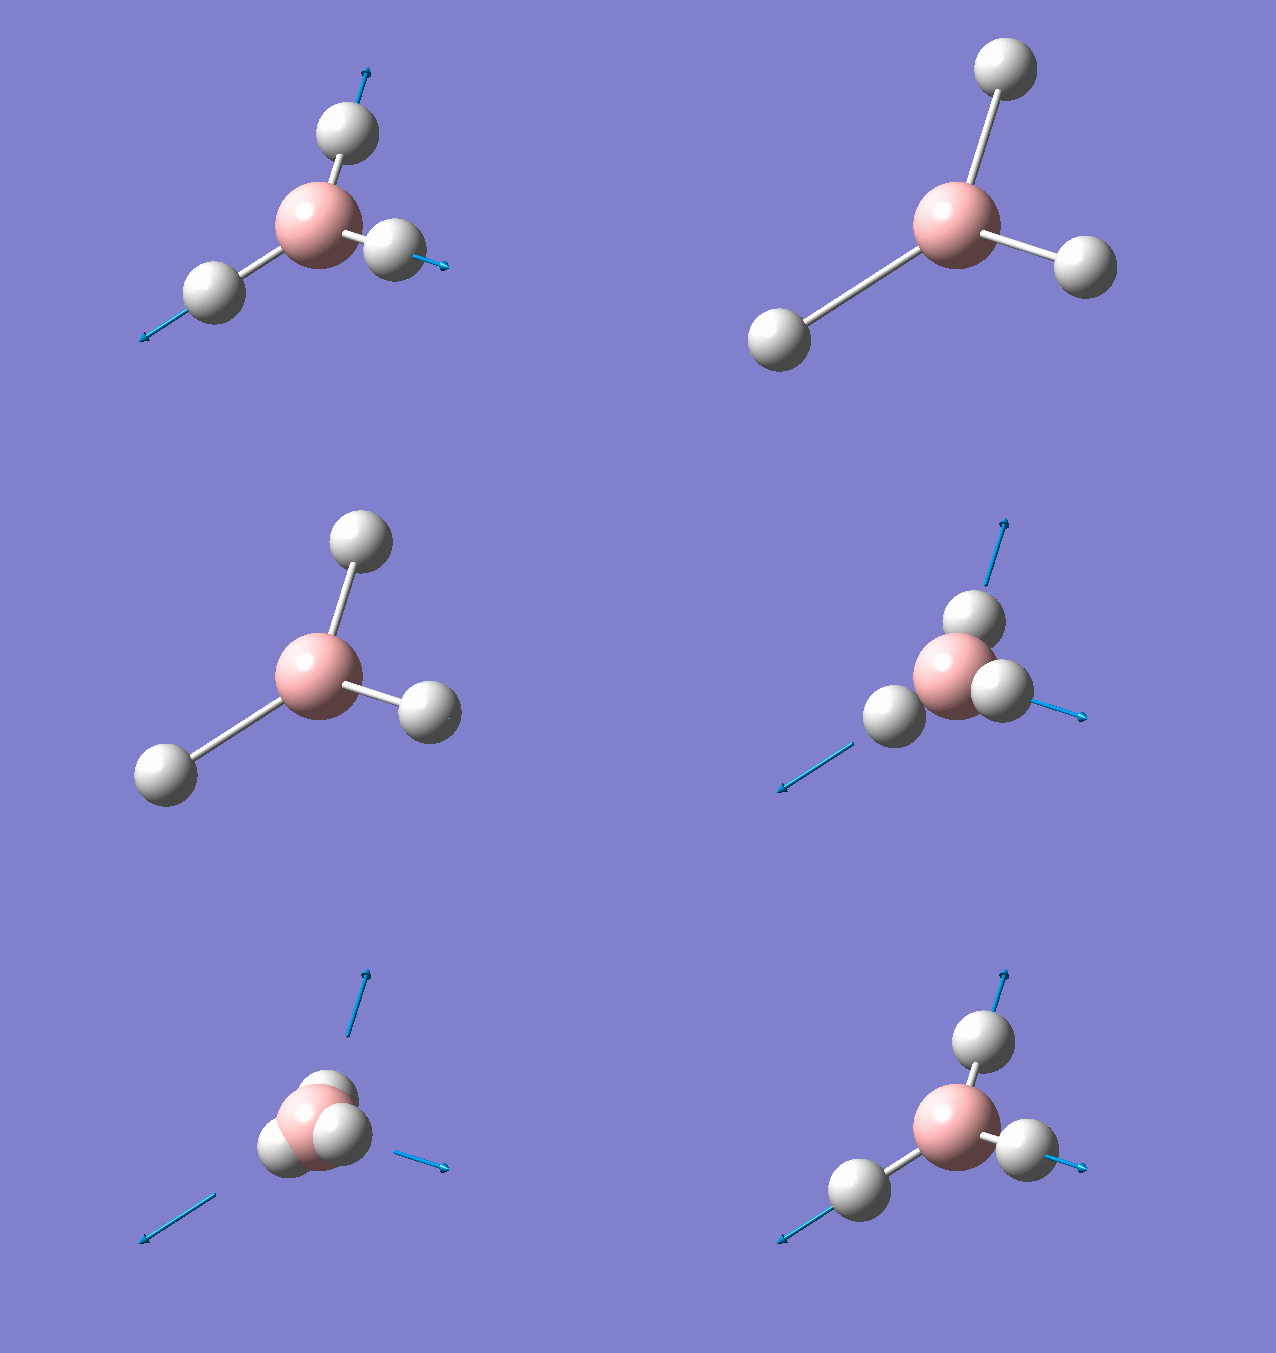
|
| 2716 | 126 | Yes | stretch | 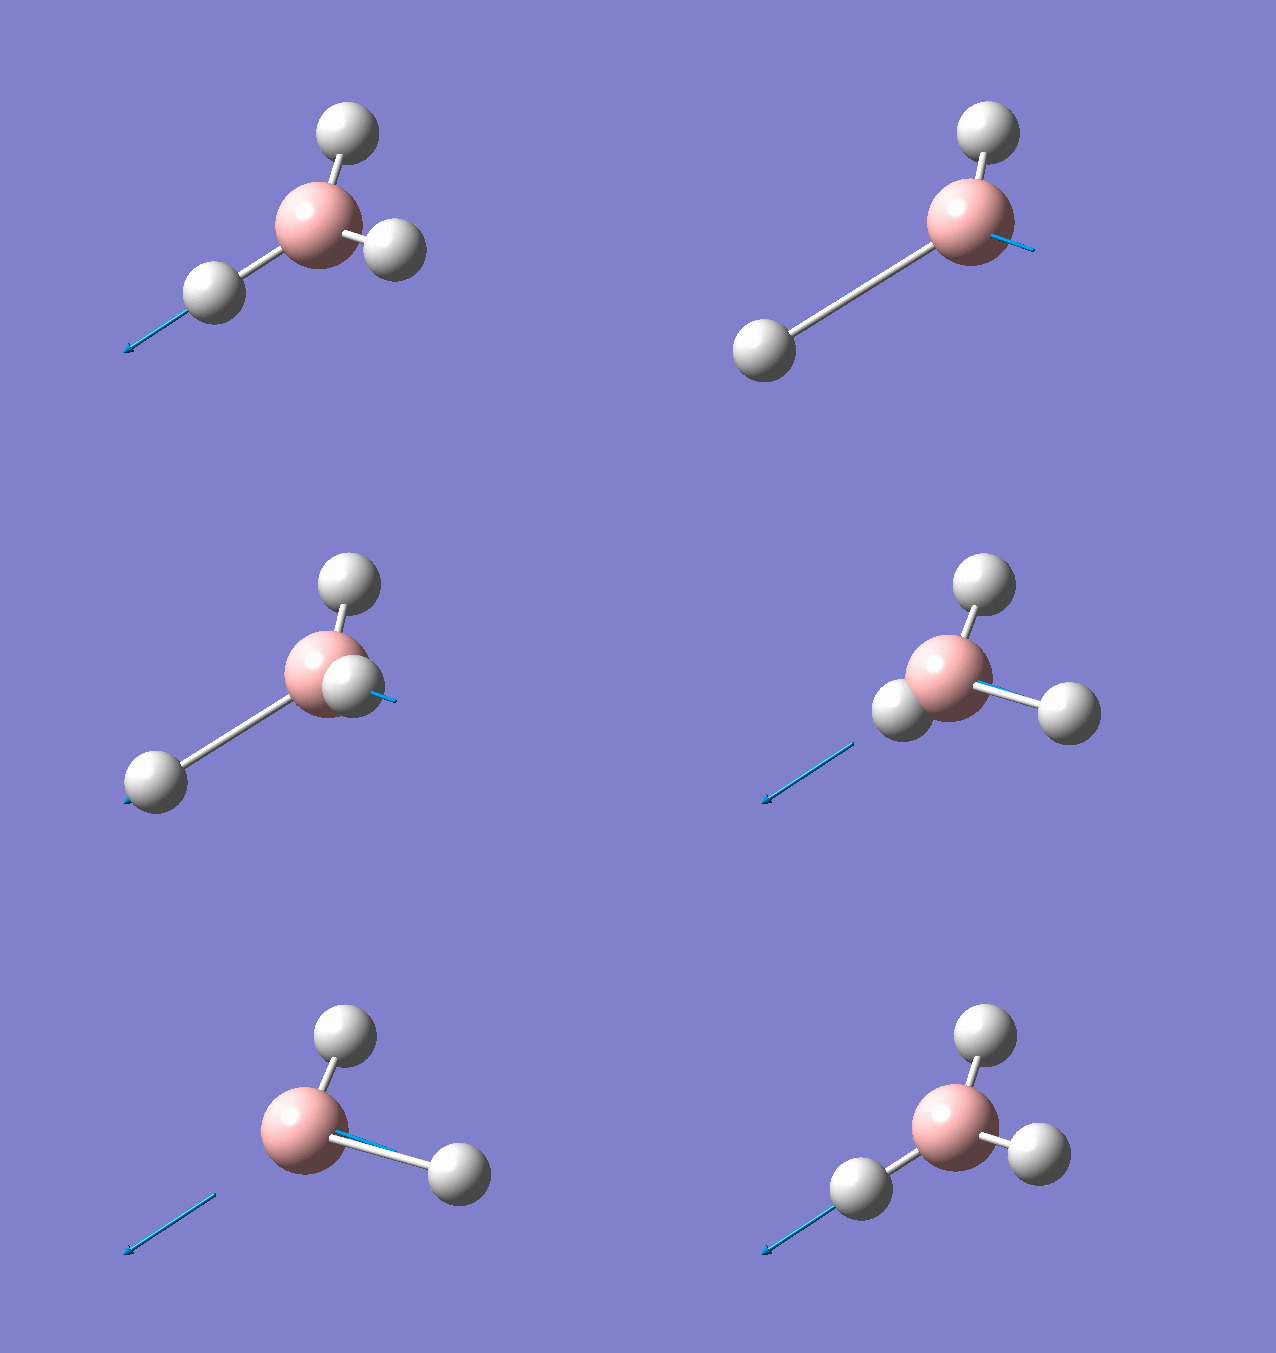
|
| 2716 | 126 | Yes | stretch | 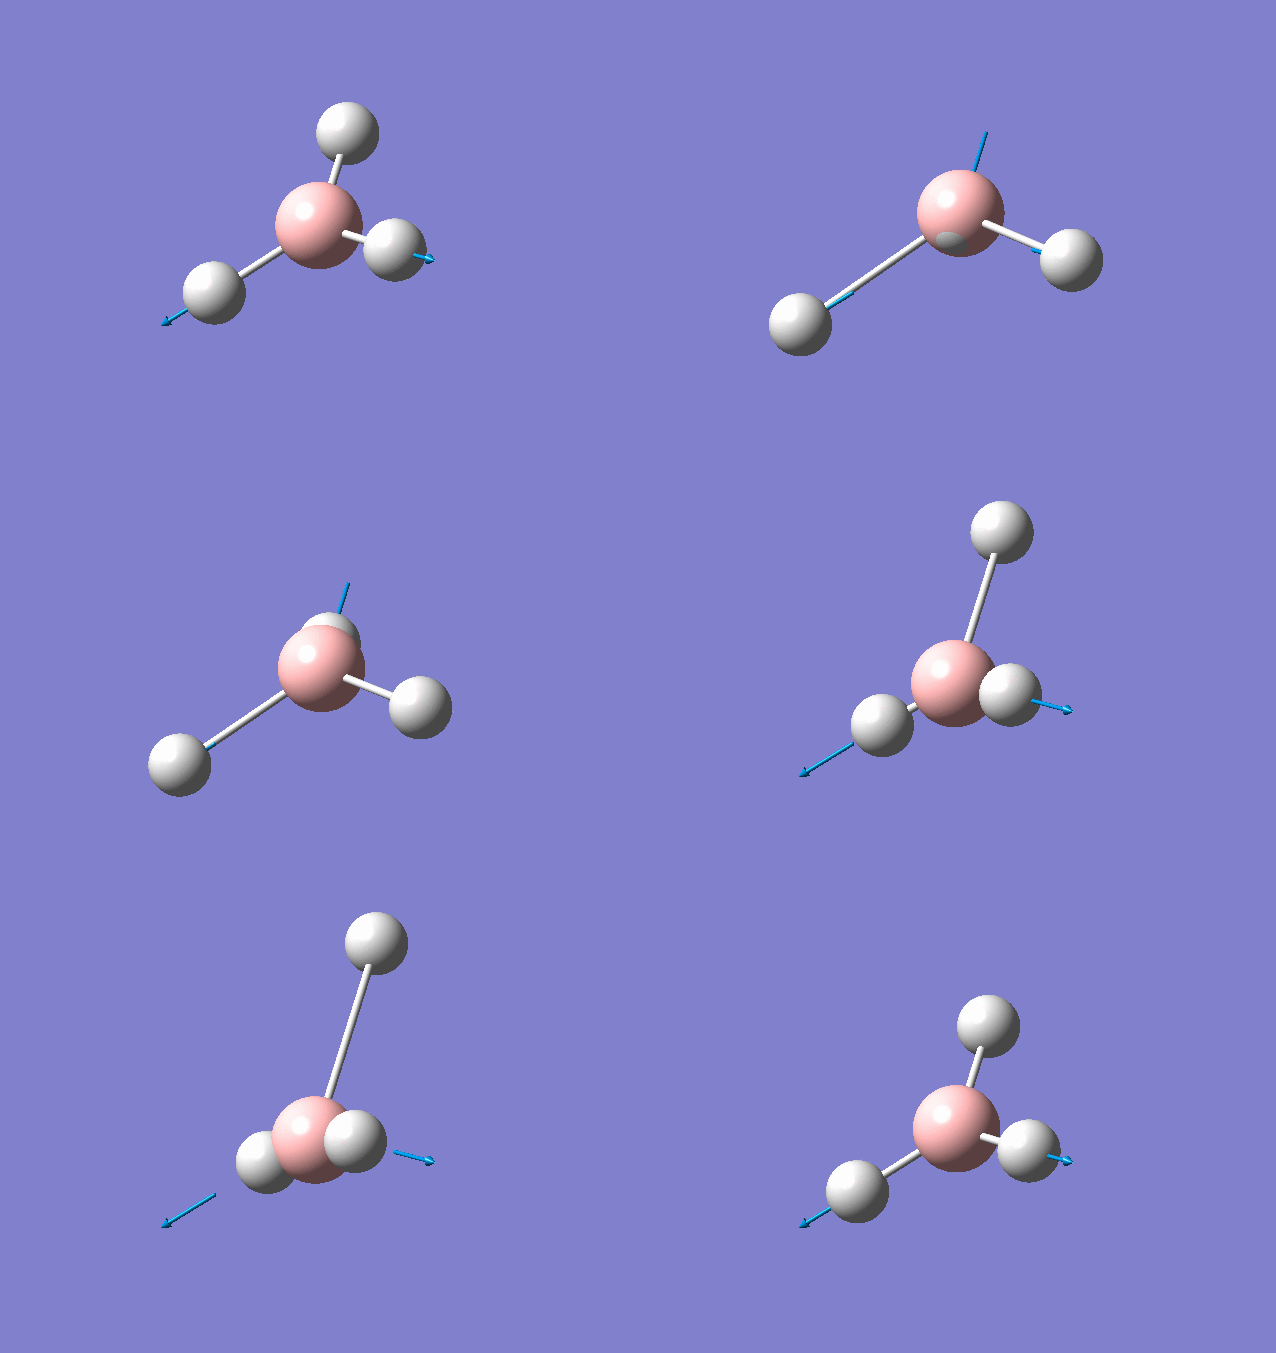
|
Calculated IR Spectrum of BH3
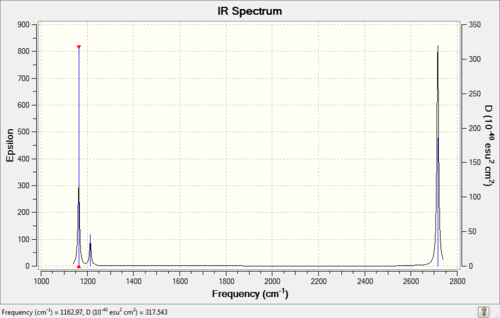
From the table shown above, it is predicted that there are 6 vibrations present; however, from the calculated IR spectrum, only 3 peaks are shown. This indicates that the vibration at 2583 cm-1 is inactive. This is because in order for the vibrational mode to be IR active, a net change in dipole moment is needed. However, for some vibrations, the change in dipole moment cancels out, e.g. the 2583 cm-1. These vibrations have low intensities or even zero intensity and does not appear on the IR spectrum. For those vibrations with high intensities, e.g. the degenerate 2716 cm-1 with intensity 126 each, a sharp peak appears on the spectrum: the two vibrations peaks overlap with a total intensity at 2716 cm-1 to be 252. By close inspection of the vibration animation, the 2716 cm-1 vibration modes presents the biggest change in dipole moment, thus leading to the strongest peak in the IR spectrum.
Analysis of GaBr3:B3LYP/LANL2DZ
Frequency Analysis of GaBr3: B3LYP/LanL2DZ
The frequency analysis log file: here
(The molecule was run on the HPC first, but a wrong symmetry label was obtained (C3H instead of D3H). Therefore, under demonstrator's help, a new frequency analysis was carried out using Gaussview -- in the calculation, a Opt+Frq was carried out)
| Summary data | Low modes |
|---|---|
 |
Low frequencies --- -1.4877 -0.0015 -0.0002 0.0096 0.06540 0.6540 Low frequencies --- 76.3920 76.3924 99.6767 |
Vibrational Analysis of GaBr3: B3LYP/LANL2DZ
| Wavenumber | Intensity | IR active? | Type |
| 76 | 3 | Yes(slight) | bend |
| 76 | 3 | Yes(slight) | bend |
| 100 | 9 | Yes(slight) | bend |
| 197 | 0 | No | stretch |
| 316 | 57 | Yes | stretch |
| 316 | 57 | Yes | stretch |
Calculated IR Spectrum of GaBr3
Same as the frequency analysis of BH3, there are in total six vibrations, but only the vibrations at 197 cm-1 is not shown on the IR spectrum (has overall no change in dipole moment). The two degenerate sets of vibrations (76 cm-1 and 316 cm-1) overlap and result in larger intensity peaks.
Comparison of BH3 and GaBr3
Similarity: Both molecules are non-linear and have the same symmetry, D3H. According to the 3N-6 vibrational mode calculations, both molecules have 6 vibrational modes, which is corresponds to the vibrational analysis tables shown above. In addition, for both molecules, only 3 peaks are shown on the IR spectrum and they both have two degenerate sets of values with the same intensity.
Difference: The biggest difference between these two molecules are the frequency range (wavenumber). The frequencies for BH3 are much larger than that of GaBr3. The energy is not compared because two different basis sets are used for optimisation and frequency analysis and doing such a comparison is meaningless. Furthermore, the intensities of peaks for BH3 molecules are higher than that of GaBr3. The intensity is related to the net change in dipole moment of the vibration, the larger the change in dipole moment, the higher the intensity. Therefore, BH3 has larger change in dipole moment than GaBr3 does and the reason is explained below in details.
Difference in frequency
The vibrations of both molecules can be treated as the classical vibrating spring mode, thus the frequency can be calculated explicitly from the Hooke’s Law[5]:

where ν is the frequency, k is the force constant and μ is the reduced mass of the molecule.
It is clearly from the equation that, the smaller the reduced mass, the larger the frequency; also, the larger the force constant, the larger the frequency. For BH3 and GaBr3, BH3 is much lighter than GaBr3 and thus having a smaller reduced mass and higher frequency. This is one of the reason of why frequency of BH3 is higher.
In addition, the force constant corresponds to the bond strength of the molecule. If the bond is strong, more energy would be required to vibrate the molecule and thus a higher frequency is needed. For BH3 and GaBr3, according to previous value, the bond length is 1.19 Å and 2.35 Å respectively. BH3 has a much stronger bond than GaBr3 does. The explanation of the stronger bond is discussed above and is mainly due to a better orbital overlap. Since both Ga and Br atoms have more diffused atomic orbitals than B and H does, the Ga-Br bond is no doubt weaker than B-H bond. Therefore, the stronger B-H bond will have a large force constant value and leading to a larger frequency present.
Comparison of umbrella motion
The vibrational modes for both molecules include in-plane stretching and out-of-plane bending (including umbrella motion and twisting scissoring). The umbrella bending vibrations for BH3 and GaBr3 occur at 1163 cm-1 and 100 cm-1. The difference in frequency is discussed above. In addition, intensity for BH3 is higher than that for GaBr3 and can be caused by a relative larger change in dipole moment for BH3 vibrational mode.
From Gaussview of BH3 vibration, 3 H atoms contribute the most for the displacement change, whereas B almost stay still at the position. This is because H atom is much lighter and smaller than B and mainly the change in dipole moment is caused by H atom. This vibrational mode has a greater displacement and a larger change in dipole moment, thus leading to a higher intensity.
From Gaussview of GaBr3 vibration, the three Br atoms almost fix in position, whereas the central atom Ga contributes the most to the displacement change and change in dipole moment. This is also because Ga is smaller and lighter than Br. The intensity of the vibrational mode is lower than that of BH3 because Ga atom is much heavier than H atom and gives a smaller change in dipole moment overall.
Discussion of basis set for optimisation and frequency analysis
The different basis sets used in Gaussview refers to the different levels of accuracy. The 3-21G level is relatively less accurate than 6-31G(d,p) level and by doing optimisation and frequency analysis based on this accuracy level would lead to some loss of symmetry and therefore an inaccurate calculated energy. As a result, energy of optimised molecules can only be compared based on the same basis set, with the same level of accuracy; otherwise, the comparison is meaningless.
The first derivative of the potential energy is the force and when carrying out optimisation for a certain molecule, the force is set to be zero. The point where the gradient of the energy is zero is called the stationary point. However, from first derivative, it does not tell whether this point is a maximum (transition state) or a minimum (optimised / ground molecule). As a result, a second derivative is required, which is the frequency analysis. After frequency analysis, if the value is positive, which means a minimum energy is obtained (the ground state / optimised molecule); however, if the values are negative, which means a maximum energy is obtained (the transition state), this indicates some error in the analysis and further inspection is needed.
When carrying out frequency analysis, there are two lines of frequency shown, the upper 6 correspond to the 6 in the 3N-6 vibrational modes, which needs to be eliminated from final vibrational modes. These 6 frequencies are close to 0 and it is suggested to be originated from rotational and translational modes -- these modes move around the x,y,z axes and generate almost no change in the nuclear position. Therefore, these 6 values need to be kept as close to 0 as possible (in this case, a better quantum mechanics has been calculated); if the value exceed ±15, a tight convergence might required.
Molecular Orbital Analysis of BH3: B3LYP/6-31G(d,p)
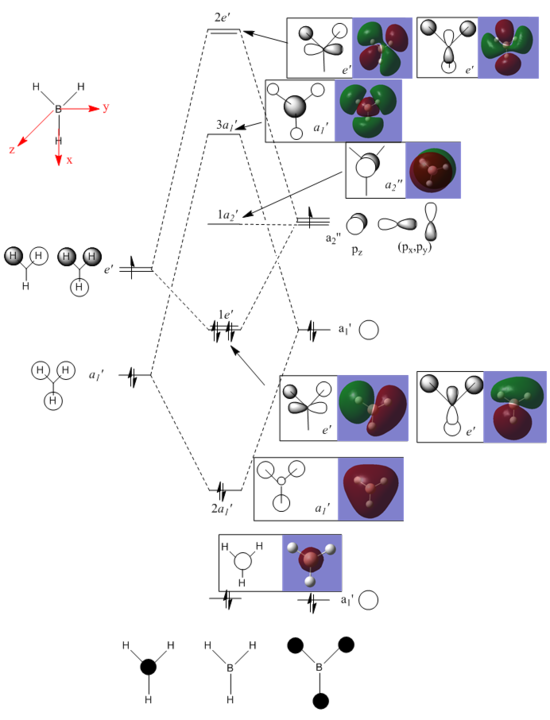
The MO analysis file is DOI:10042/195220
Molecular Orbital Diagram
Comments
The Linear Combination of Atomic Orbital theory (LCAO) is used when drawing the molecular orbital diagram. The molecular orbital is built by superimposing the individual atomic orbitals which are similar in energy and have the same symmetry. From the MO diagram shown above, the LCAO theory works quite well for small molecules, e.g. BH3. This theory is accurate when the number of atoms contained in the molecule is small and atomic orbital interactions are not complicated. For example, the assumed MOs of those bonding orbitals shown match quite well with the real MOs. However, if the molecular orbital becomes more diffused and / or more higher in energy, the assumption starts to break up, e.g. the lobe shape / size of the assumed non-bonding / anti-bonding orbitals differ slightly from the real MOs. In addition, if the molecular has an unevenly distributed electron density, the LCAO assumption is not accurate enough to predict the MO geometry.
NH3 Analysis
NH3: B3LYP/6-31G(d,p) Level
The optimisation log file is here
| Summary data | Convergence | Jmol | |||
|---|---|---|---|---|---|
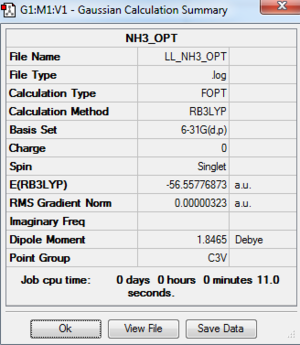 |
Item Value Threshold Converged? Maximum Force 0.000006 0.000450 YES RMS Force 0.000004 0.000300 YES Maximum Displacement 0.000012 0.001800 YES RMS Displacement 0.000008 0.001200 YES |
|
Frequency Analysis of NH3: B3LYP/6-31G(d,p)
The frequency analysis log file: here
| Summary data | Low modes |
|---|---|
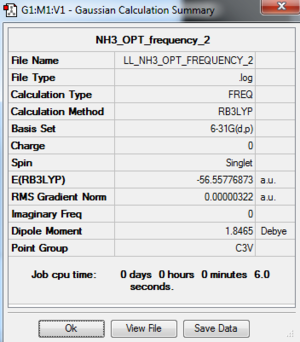 |
Low frequencies --- -0.0131 -0.0029 -0.0012 7.0768 8.0933 8.0936 Low frequencies --- 1089.3840 1693.9368 1693.9368 |
Vibrational Analysis of NH3: B3LYP/6-31G(d,p)
| Wavenumber | Intensity | IR active? | Type |
| 1089 | 145 | Yes | bend |
| 1694 | 14 | Yes(slight) | bend |
| 1694 | 14 | Yes(slight) | bend |
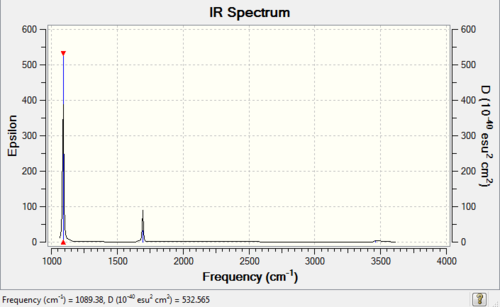
| 3461 | 1 | No | stretch |
| 3590 | 0 | No | stretch |
| 3590 | 0 | No | stretch |
Calculated IR Spectrum of NH3
Molecular Orbital Analysis of NH3: B3LYP/6-31G(d,p)
The MO analysis file is DOI:10042/195223
Natural Bond Orbital Analysis of NH3: B3LYP/6-31G(d,p)
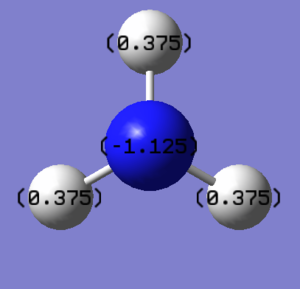
The charge limits associated with the bright green and bright red colours are -1.125 to 1.125.
The charge distribution is


Bright green indicates highly positive charge (H atom) and bright red indicates highly negative charge (N atom).
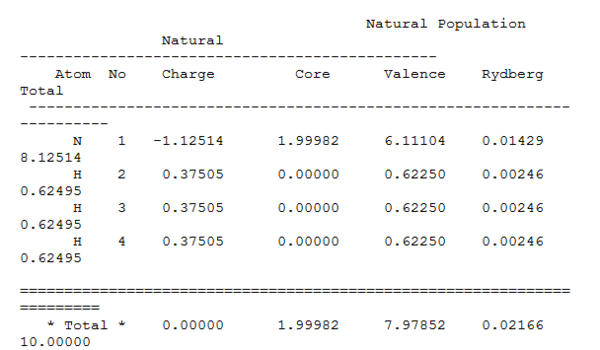
The specific NBO charges for the nitrogen and hydrogen atoms are
| Atom | N | H |
|---|---|---|
| Charge | -1.125 | +0.375 |
The N atom carries the negative charge and the hydrogen carries the positive charge. This is because the electronegativity of N is higher than that of H, which means the electron density will be pulled more to the N side and makes it slightly negative. This also indicates that there is some degree of ionic character in this covalent bond.
Summary of Natural Bond Analysis
NH3BH3 Analysis
NH3BH3: RB3LYP/6-31G(d,p) Level
The optimisation log file is here
| Summary data | Convergence | Jmol | |||
|---|---|---|---|---|---|
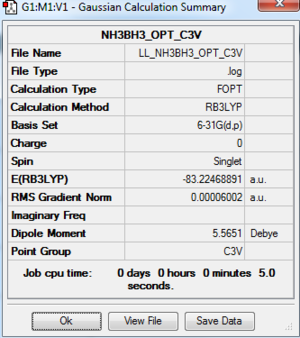 |
Item Value Threshold Converged? Maximum Force 0.000122 0.000450 YES RMS Force 0.000058 0.000300 YES Maximum Displacement 0.000540 0.001800 YES RMS Displacement 0.000297 0.001200 YES |
|
As the point group for the optimisation NH3BH3 is C1, and it is not the correct symmetry, C3v, a point group constrain was carried out.
Frequency Analysis of NH3BH3: B3LYP/6-31G(d,p)
The frequency analysis log file: here
| Summary data | Low modes |
|---|---|
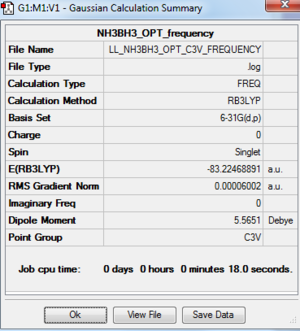 |
Low frequencies --- -0.0251 -0.0033 -0.0010 17.1308 17.1344 37.1684 Low frequencies --- 265.7947 632.2135 639.3527 |
Vibrational Analysis of NH3BH3: B3LYP/6-31G(d,p)
| Wavenumber | Intensity | IR active? | Type |
| 266 | 0 | No | bend |
| 632 | 14 | Yes(slight) | stretch |
| 639 | 4 | Yes(slight) | bend |
| 639 | 4 | Yes(slight) | bend |
| 1069 | 41 | Yes | bend |
| 1069 | 41 | Yes | bend |
| 1196 | 109 | Yes | bend |
| 1204 | 3 | Yes(slight) | bend |
| 1204 | 3 | Yes(slight) | bend |
| 1329 | 114 | Yes | bend |
| 1676 | 28 | Yes | bend |
| 1676 | 28 | Yes | bend |
| 2470 | 67 | Yes | stretch |
| 2530 | 231 | Yes | stretch |
| 2530 | 231 | Yes | stretch |
| 3463 | 3 | Yes(slight) | stretch |
| 3580 | 28 | Yes | stretch |
| 3580 | 28 | Yes | stretch |
Calculated IR Spectrum of NH3BH3
Energy Analysis of Reaction -- Formation of NH3BH3
Dissociation energy: ΔE = E(NH3BH3)-[E(NH3)+E(BH3)]
| BH3 | NH3 | NH3BH3 | |
|---|---|---|---|
| Bond energy / a.u. | -26.6153236 | -56.5577687 | -83.2246889 |
| Dissociation energy / a.u. | -0.0515966 | ||
| Dissociation energy / kJ/mol | -135.47 | ||
Comments
The calculated energy: 135.47 kJ/mol corresponds to the formation enthalpy of B-N bond, a dative bond. According to the discussion of bond strength above, it can still be classified as a medium bond. Although still a bit weaker than the N-N bond (163 kJ/mol, it is still a relative medium bond because B and N are in the same period and are relatively similar in size. In addition, because N is more electronegative than B and there would be some extent of ionic character present in this covalent bond, which strengthens the bond.
Overall, the calculated bond energy is fairly good and sensible since it is larger than the van der waals forces, but smaller than typically covalent and ionic bond.
Project: Lewis Acids and bases -- Al2Cl4Br2
Introduction
The basis set used for optimisation and frequency analysis is a mixed of 6-31G(d,p) for Al and Cl atom and pseudo potential LanL2DZ for Br atom. The mixed basic set is used because Br is a heavy atom and the standard Schrodinger equation does not apply due to the relativistic effect. By using the pseudo potential LanL2DZ basis set, the core electrons can be more accurately modified.
The "Additional key word" must be contained in the calculation: "pesudo=read gfinput integral=grid=ultrafine" and in the input file, the following word is typed to ensure a correct calculation is carried out:
 Al 0
 6-31G(d,p)
 ****
 Cl 0
 6-31G(d,p)
 ****
 Br 0
 LanL2DZ
 ****
 Br 0
 LanL2DZ
By typing the "integral=grid=ultrafine, the integration of electron density is carried out and this would give a more accurate result.
When the optimisation was carried out, the symmetry obtained was not correct in the first place and before doing the frequency analysis, the molecule was constrained to the correct symmetry.
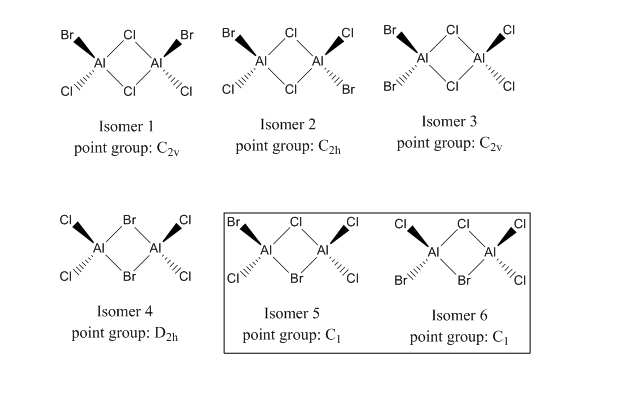
There are 6 possible isomers for AlCl4Br2. Normally, the dimer formed from the AlCl2Br monomers would only be isomer 1,2,4,5,and 6. But, as the dimer would undergo Schlenk equilibrium, which means an exchange of the bridging and terminal halide, isomer 3 can form as well. Isomer 5 and 6 are superimposible mirror images, also can be called enantiomer. Therefore, for the discussion shown below, only isomer 1 to 5 are discussed.
The nature of dimer Al2X6
Al2Cl4Br2 is unstable in its monomer form because of its 6 valence electrons deficiency. It dimerises to release the electron deficiency and the stability increases as the electronic configuration is the stable octet form.
The terminal Al-X bond is a covalent bond formed by sharing the two electrons between two atoms and is considered to be a strong bond. The Al-X-Al bridging bond in the Al2X6 is different from the B-H-B bridging bond in the B2H6. The B-H-B bridging bond is a 3c-2e bond and the definition of 3c-2e bond is "where two electrons occupy a bonding molecular orbital which is delocalised over three atomic centers"[6]. For the bridging Al-X-Al bond, one bridging halogen X donates its electron density to the Al and forms a dative bond, and the other Al-X bond is the normal 2c-2e covalent bond. The bridging dative bond is weaker than the normal 2c-2e covalent bond. It corresponds to a lower bridging stretch frequency than the terminal frequency because less energy is required to vibrate the bridging bond. Detailed discussions are shown below.
Furthermore, the molecule Al2R6 (R can be any C contained fragments) has a shorter distance between two Al atoms due to a direct interaction between two Al atoms. It can be explained by the larger size of halogen atoms which gives a larger a Al-X-Al bond angle and reduces the possible interaction between 2 Al atoms. This is an interesting part to be explored, but is not the main content of this computational lab and more information can be discussed in further experiment.
Al2Cl4Br2 Isomer 1: B3LYP/GEN 6-31G(d,p) for Al, Cl, PP LANL2DZ for Br
Point Group: C1
The optimisation file is DOI:10042/195257 and the optimisation log file is here
| Summary data | Convergence | Jmol | |||
|---|---|---|---|---|---|
 |
Item Value Threshold Converged? Maximum Force 0.000018 0.000450 YES RMS Force 0.000010 0.000300 YES Maximum Displacement 0.000476 0.001800 YES RMS Displacement 0.000236 0.001200 YES |
|
Point Group: C2v
The optimisation file is DOI:10042/195288 and the optimised log file is here
| Summary data | Convergence | Jmol | |||
|---|---|---|---|---|---|
 |
Item Value Threshold Converged? Maximum Force 0.000006 0.000450 YES RMS Force 0.000004 0.000300 YES Maximum Displacement 0.000092 0.001800 YES RMS Displacement 0.000031 0.001200 YES |
|
Frequency Analysis of Isomer 1: B3LYP/6-31G(d,p)/PP LANL2DZ
The frequency analysis was carried out based on the log file with C1 symmetry, so it has the same energy as the C1 symmetry file. The frequency analysis was done after symmetrization.
The frequency analysis file: DOI:10042/195275 and the frequency analysis log file is here
| Summary data | Low modes |
|---|---|
 |
Low frequencies --- -1.3482 -0.9291 -0.0023 -0.0014 0.0020 2.2289 Low frequencies --- 17.5183 51.0778 78.6051 |
Vibrational Analysis of Isomer 1: B3LYP/6-31G(d,p)/PP LANL2DZ
| Wavenumber | Intensity | IR active? | Type |
| 17 | 0 | No | bend |
| 21 | 0 | No | bend |
| 79 | 0 | No | bend |
| 99 | 0 | No | bend |
| 103 | 3 | No | bend |
| 121 | 13 | Yes(slight) | bend |
| 122 | 6 | Yes(slight) | bend |
| 157 | 0 | No | bend |
| 158 | 5 | Yes(slight) | bend |
| 194 | 2 | No | bend |
| 263 | 0 | No | stretch |
| 279 | 26 | Yes | stretch |
| 308 | 2 | No | stretch |
| 413 | 149 | Yes | stretch |
| 420 | 409 | Yes | stretch |
| 461 | 36 | Yes | stretch |
| 571 | 34 | Yes | stretch |
| 583 | 276 | Yes | stretch |
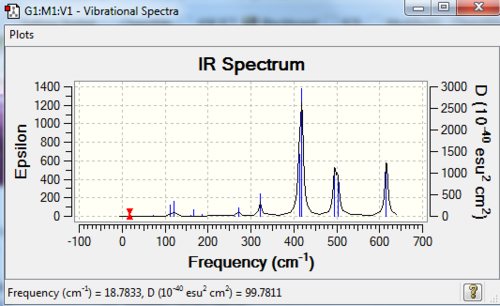
Calculated IR Spectrum of Isomer 1
Al2Cl4Br2 Isomer 2: B3LYP/GEN 6-31G(d,p) for Al, Cl, PP LANL2DZ for Br
Point group: C1
The optimisation file is DOI:10042/195258 and the optmisation log file is here
| Summary data | Convergence | Jmol | |||
|---|---|---|---|---|---|
 |
Item Value Threshold Converged? Maximum Force 0.000005 0.000450 YES RMS Force 0.000003 0.000300 YES Maximum Displacement 0.000059 0.001800 YES RMS Displacement 0.000026 0.001200 YES |
|
Point group: C2h
The optimisation file is DOI:10042/195298 and the optmisation log file is here
| Summary data | Convergence | Jmol | |||
|---|---|---|---|---|---|
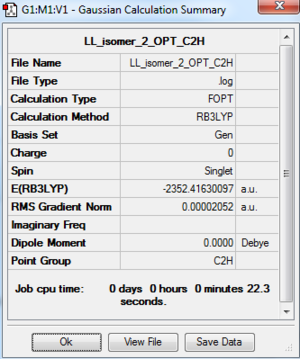 |
Item Value Threshold Converged? Maximum Force 0.000004 0.000450 YES RMS Force 0.000011 0.000300 YES Maximum Displacement 0.000112 0.001800 YES RMS Displacement 0.000036 0.001200 YES |
|
Frequency Analysis of Isomer 2: B3LYP/6-31G(d,p)/PP LANL2DZ
The frequency analysis file: DOI:10042/195276 and the frequency analysis log file is here
| Summary data | Low modes |
|---|---|
 |
Low frequencies --- -0.6520 -0.0026 -0.0022 -0.0014 0.2697 2.6284 Low frequencies --- 18.3547 49.2281 72.9077 |
Vibrational Analysis of Isomer 2: B3LYP/6-31G(d,p)/PP LANL2DZ
| Wavenumber | Intensity | IR active? | Type |
| 18 | 0 | No | bend |
| 49 | 0 | No | bend |
| 73 | 0 | No | bend |
| 105 | 0 | No | bend |
| 109 | 3 | No | bend |
| 118 | 9 | Yes(slight) | bend |
| 120 | 13 | Yes(slight) | bend |
| 157 | 0 | No | bend |
| 159 | 6 | Yes(slight) | bend |
| 192 | 0 | No | bend |
| 263 | 0 | No | stretch |
| 280 | 29 | Yes | stretch |
| 308 | 0 | No | stretch |
| 413 | 149 | Yes | stretch |
| 421 | 438 | Yes | stretch |
| 459 | 0 | No | stretch |
| 575 | 0 | No | stretch |
| 579 | 316 | Yes | stretch |
Calculated IR Spectrum of Isomer 2
Al2Cl4Br2 Isomer 3: B3LYP/GEN 6-31G(d,p) for Al, Cl, PP LANL2DZ for Br
Point group: C1
The optimisation file is DOI:10042/195268 and the optimisation log file is here
| Summary data | Convergence | Jmol | |||
|---|---|---|---|---|---|
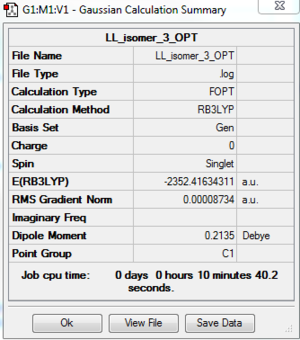 |
Item Value Threshold Converged? Maximum Force 0.000135 0.000450 YES RMS Force 0.000048 0.000300 YES Maximum Displacement 0.000129 0.001800 YES RMS Displacement 0.000059 0.001200 YES |
|
Point group: C2v
The optimisation file is DOI:10042/195293 and the optmisation log file is here
| Summary data | Convergence | Jmol | |||
|---|---|---|---|---|---|
 |
Item Value Threshold Converged? Maximum Force 0.000136 0.000450 YES RMS Force 0.000049 0.000300 YES Maximum Displacement 0.000873 0.001800 YES RMS Displacement 0.000251 0.001200 YES |
|
Frequency Analysis of Isomer 3: B3LYP/6-31G(d,p)/PP LANL2DZ
The frequency analysis file: DOI:10042/195273 and the frequency analysis log file is here
| Summary data | Low modes |
|---|---|
 |
Low frequencies --- -0.7272 -0.5004 -0.0049 -0.0040 -0.0036 2.3120 Low frequencies --- 18.7869 51.2561 72.2060 |
Vibrational Analysis of Isomer 3: B3LYP/6-31G(d,p)/PP LANL2DZ
| Wavenumber | Intensity | IR active? | Type |
| 19 | 0 | No | bend |
| 51 | 0 | No | bend |
| 72 | 1 | No | stretch |
| 98 | 0 | No | stretch |
| 111 | 0 | No | bend |
| 112 | 8 | Yes(slight) | bend |
| 120 | 11 | Yes(slight) | stretch |
| 160 | 1 | No | stretch |
| 166 | 7 | Yes(slight) | bend |
| 187 | 2 | No | stretch |
| 263 | 0 | No | stretch |
| 271 | 14 | Yes(slight) | stretch |
| 322 | 42 | Yes | stretch |
| 413 | 150 | Yes | stretch |
| 419 | 309 | Yes | stretch |
| 495 | 134 | Yes | bend |
| 503 | 104 | Yes | stretch |
| 616 | 177 | Yes | bend |
Calculated IR Spectrum of Isomer 3
Al2Cl4Br2 Isomer 4: B3LYP/GEN 6-31G(d,p) for Al, Cl, PP LANL2DZ for Br
Point group: C1
The optimisation file is DOI:10042/195261 and the optimisation log file is here
| Summary data | Convergence | Jmol | |||
|---|---|---|---|---|---|
 |
Item Value Threshold Converged? Maximum Force 0.000003 0.000450 YES RMS Force 0.000001 0.000300 YES Maximum Displacement 0.000039 0.001800 YES RMS Displacement 0.000015 0.001200 YES |
|
Point group: D2h
The optimisation file is DOI:10042/195291 and the optmisation log file is here
| Summary data | Convergence | Jmol | |||
|---|---|---|---|---|---|
 |
Item Value Threshold Converged? Maximum Force 0.000022 0.000450 YES RMS Force 0.000010 0.000300 YES Maximum Displacement 0.000197 0.001800 YES RMS Displacement 0.000096 0.001200 YES |
|
Frequency Analysis of Isomer 4: B3LYP/6-31G(d,p)/PP LANL2DZ
The frequency analysis file: DOI:10042/195272 and the frequency analysis log file is here
| Summary data | Low modes |
|---|---|
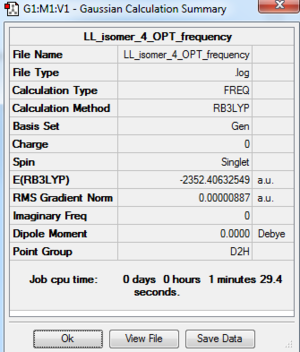 |
Low frequencies --- -0.4957 0.0010 0.0021 0.0023 0.4843 0.8103 Low frequencies --- 16.0191 63.5832 86.0889 |
Vibrational Analysis of Isomer 4: B3LYP/6-31G(d,p)/PP LANL2DZ
| Wavenumber | Intensity | IR active? | Type |
| 16 | 0 | No | bend |
| 64 | 0 | No | bend |
| 86 | 0 | No | bend |
| 87 | 0 | No | bend |
| 108 | 5 | Yes(slight) | bend |
| 111 | 0 | No | bend |
| 126 | 8 | Yes(slight) | bend |
| 135 | 0 | No | bend |
| 138 | 7 | Yes(slight) | bend |
| 163 | 0 | No | stretch |
| 197 | 0 | No | stretch |
| 241 | 100 | Yes | stretch |
| 247 | 0 | No | stretch |
| 341 | 161 | Yes | stretch |
| 468 | 346 | Yes | stretch |
| 494 | 0 | No | stretch |
| 609 | 0 | No | bend |
| 617 | 332 | Yes | bend |
Calculated IR Spectrum of Isomer 4
Al2Cl4Br2 Isomer 5: B3LYP/GEN 6-31G(d,p) for Al, Cl, PP LANL2DZ for Br
The optimisation file is DOI:10042/195259 and the optimisation log file is here
| Summary data | Convergence | Jmol | |||
|---|---|---|---|---|---|
 |
Item Value Threshold Converged? Maximum Force 0.000135 0.000450 YES RMS Force 0.000045 0.000300 YES Maximum Displacement 0.001511 0.001800 YES RMS Displacement 0.000653 0.001200 YES |
|
Frequency Analysis of Isomer 5: B3LYP/6-31G(d,p)/PP LANL2DZ
The frequency file: DOI:10042/195271 and the frequency analysis log file is here
| Summary data | Low modes |
|---|---|
 |
Low frequencies --- -1.8556 -1.6175 -0.0009 -0.0010 0.0010 1.9286 Low frequencies --- 16.8020 55.9885 80.0424 |
Vibrational Analysis of Isomer 5: B3LYP/6-31G(d,p)/PP LANL2DZ
| Wavenumber | Intensity | IR active? | Type |
| 17 | 0 | No | bend |
| 56 | 0 | No | bend |
| 80 | 0 | No | bend |
| 92 | 1 | No | bend |
| 107 | 0 | No | bend |
| 110 | 5 | Yes(slight) | bend |
| 121 | 8 | Yes(slight) | bend |
| 149 | 5 | Yes(slight) | bend |
| 154 | 6 | Yes(slight) | bend |
| 186 | 1 | No | stretch |
| 211 | 21 | Yes(slight) | stretch |
| 257 | 10 | Yes(slight) | stretch |
| 289 | 48 | Yes | stretch |
| 384 | 154 | Yes | stretch |
| 424 | 274 | Yes | bend |
| 493 | 107 | Yes | stretch |
| 575 | 122 | Yes | bend |
| 615 | 197 | Yes | bend |
Calculated IR Spectrum of Isomer 5
Al2Cl4Br2 Isomer 6: B3LYP/GEN 6-31G(d,p) for Al, Cl, PP LANL2DZ for Br
The optimisation file is DOI:10042/195269 and the optimisation log file is here
| Summary data | Convergence | Jmol | |||
|---|---|---|---|---|---|
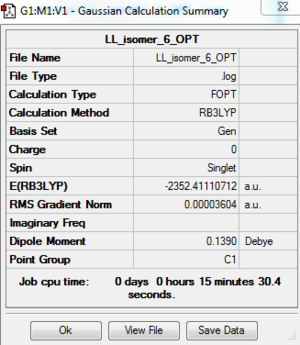 |
Item Value Threshold Converged? Maximum Force 0.000116 0.000450 YES RMS Force 0.000027 0.000300 YES Maximum Displacement 0.001510 0.001800 YES RMS Displacement 0.000603 0.001200 YES |
|
Frequency Analysis of Isomer 6: B3LYP/6-31G(d,p)/PP LANL2DZ
The frequency file: DOI:10042/195270 and the frequency analysis log file is here
| Summary data | Low modes |
|---|---|
 |
Low frequencies --- -1.8035 -1.3245 -0.0008 0.0031 0.0033 1.7613 Low frequencies --- 16.8397 55.9447 80.0544 |
Vibrational Analysis of Isomer 6: B3LYP/6-31G(d,p)/PP LANL2DZ
| Wavenumber | Intensity | IR active? | Type |
| 17 | 0 | No | bend |
| 56 | 0 | No | bend |
| 80 | 0 | No | bend |
| 92 | 1 | No | bend |
| 107 | 0 | No | bend |
| 110 | 5 | Yes(slight) | bend |
| 121 | 8 | Yes(slight) | bend |
| 149 | 5 | Yes(slight) | bend |
| 154 | 6 | Yes(slight) | bend |
| 186 | 1 | No | stretch |
| 211 | 21 | Yes(slight) | stretch |
| 257 | 10 | Yes(slight) | stretch |
| 289 | 48 | Yes | stretch |
| 384 | 154 | Yes | stretch |
| 424 | 274 | Yes | bend |
| 493 | 107 | Yes | stretch |
| 575 | 122 | Yes | bend |
| 615 | 197 | Yes | bend |
Calculated IR Spectrum of Isomer 6
Energy Comparison of six isomers and the effects of positions of the Br atom

| Isomer 1 | Isomer 2 | Isomer 3 | Isomer 4 | Isomer 5 | Isomer 6 | |
|---|---|---|---|---|---|---|
| Bond energy / a.u. | -2352.4162778 | -2352.4162998 | -2352.4163431 | -2352.4063255 | -2532.4111069 | -2352.4111071 |
| Bond energy / kJ/mol | -6176268.94 | -6176269.00 | -6176269.11 | -6176242.81 | -6176255.36 | -6176255.36 |
| Energy difference relative to the lowest isomer 3 | 0.17 | 0.11 | The most stable / lowest energy isomer | 26.30 | 13.75 | 13.75 |
Comments
By comparing the energy of each isomer, the lowest energy conformer is isomer 3, which has 2 Cl atoms bridging and two terminal Br atoms on the same side. Isomer 1 and 2 are slightly higher in energy (0.17 and 0.11 kJ/mol) than isomer 3. However, because Gaussview has a calculation error ±10 kJ/mol, it cannot be concluded that isomer 3 is the most stable conformer. The conclusion can only be isomer 1,2, and 3 are more stable than isomer 4,5, and 6. Also, because isomer 5 and isomer 6 have exactly the same energy and the same vibrational mode, it can be concluded that they are enantiomers. In addition, the isomer 4 is the least stable conformer, which has 2 bridging Br atoms. The reason for this instability could be the weaker bond nature of Al-Br-Al bridging.
By comparing the energy of each isomer, it clearly shows that the conformers with the Br atom at bridging position have less negative energies, thus are less stable and more easily decomposed. This can be explained by the nature of weaker Al-Br bond than Al-Cl bond due to more diffused orbitals of Br atoms. Both Al-Br and Al-Cl are covalent bonds and therefore, the bond energy is related to the orbital overlap: the better the overlap, the stronger the bond. Al and Cl are on the same period (period 3), so they have similar sizes and their orbitals are well-matched. However, Br is in period 4 and have more diffused orbital which does not match so well with the Al orbital. Furthermore, from the electronegativity point of view, Cl(3.0) is more electronegative than Br(2.8), the difference in electronegativity between Al and Cl is larger than that of Al and Br. The larger the electronegativity, the more ionic character involved in the covalent bond; thus a stronger bond. Overall, Al-Cl-Al is a stronger bridging bond than Al-Br-Al and the conformers with Cl bridging are more stable.
Discussion of IR spectra
| Isomer | Point Group | IR spectrum | No. of vibrational bands | No. of remarkable peaks on IR spectrum |
|---|---|---|---|---|
| 1 | C2v | 
|
12 | 2 |
| 2 | C2h | 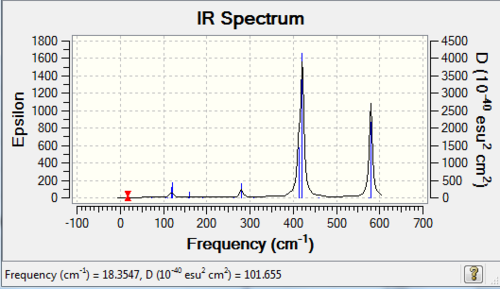
|
8 | 2 |
| 3 | C2v | 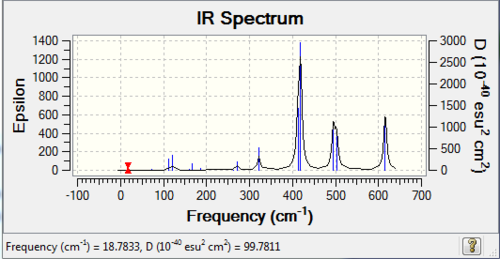
|
13 | 3 |
| 4 | D2h | 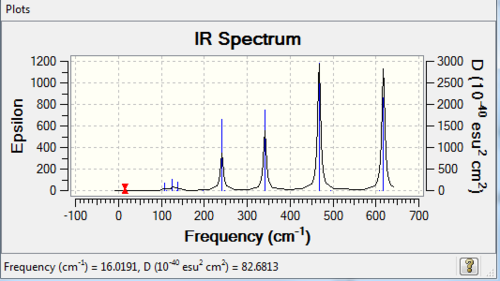
|
7 | 4 |
| 5 | C1 | 
|
14 | 6 |
Comments
The number of vibrational bands is the number of non-zero-intensity bands and the number of peaks counts for the number of remarkable peaks on the IR spectrum. From the table above, all the numbers of bands are less than 18 (3N-6, with N=8), this is because some of the bands have zero intensity, also known as IR inactive. For a vibrational mode to be IR active, it requires a net change of dipole moment and for some modes, the changes of dipole moments on two sides cancel out, resulting a zero-intensity band. In addition, it is clearly shown that the number of peaks is less than the number of bands, because some of the bands have low intensities which are not high enough to be shown on the spectrum.
The higher the symmetry of the conformer, the lower the number of peaks shown on IR spectrum, due to the cancellation of changing dipole moments of vibration or rotation movement / symmetrical stretching. For example, isomer 3 has D2h point group and it has 3 visible peaks; whereas isomer 5 has C1 point group and has 6 visible peaks.
AlCl2Br Monomer: B3LYP/GEN 6-31G(d,p) for Al, Cl, PP LANL2DZ for Br
The optimisation file is DOI:10042/195302 and the optimisation log file is here
| Summary data | Convergence | Jmol | |||
|---|---|---|---|---|---|
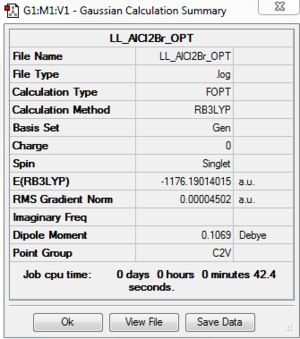 |
Item Value Threshold Converged? Maximum Force 0.000149 0.000450 YES RMS Force 0.000078 0.000300 YES Maximum Displacement 0.000797 0.001800 YES RMS Displacement 0.000541 0.001200 YES |
|
Frequency Analysis of AlCl2Br monomer: B3LYP/6-31G(d,p)/PP LANL2DZ
The frequency file: DOI:10042/195303 and the frequency analysis log file is here
| Summary data | Low modes |
|---|---|
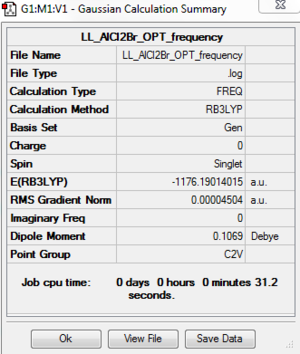 |
Low frequencies --- 0.0023 0.0024 0.0037 3.3756 3.6552 4.1209 Low frequencies --- 120.7185 133.9343 185.8750 |
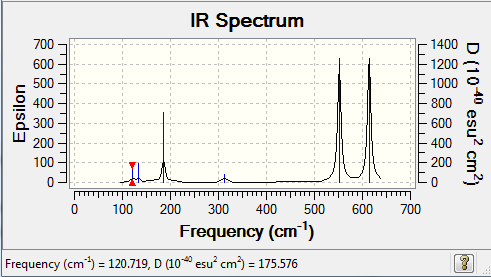
Vibrational Analysis of AlCl2Br monomer: B3LYP/6-31G(d,p)/PP LANL2DZ
| Wavenumber | Intensity | IR active? | Type |
| 121 | 5 | Yes(slight) | bend |
| 134 | 6 | Yes(slight) | bend |
| 186 | 33 | Yes | bend |
| 314 | 7 | Yes(slight) | stretch |
| 552 | 174 | Yes | stretch |
| 614 | 186 | Yes | stretch |
Calculated IR Spectrum of AlCl2Br monomer
Dissociation Energy of isomer 3 into 2 AlCl2Br
Dissociation energy: ΔE = E(Al2Cl4Br2)-2×E(AlCl2Br)
| Al2Cl4Br2(isomer 3) | AlCl2Br | ||
|---|---|---|---|
| Bond energy / a.u. | -2352.4163431 | -1176.1901402 | |
| Dissociation energy / a.u. | -0.0360627 | ||
| Dissociation energy / kJ/mol | -94.68 | ||
Comments
Because the dissociation energy is negative, which means energy is needed to to break the dimer, thus the dimer is a more stable form than 2 individual monomers. The bridging Cl atom donates its electron to the Al atom to form a dative bond in the Al-Cl-Al bridging bond. Therefore Al reaches its perfect octet electronic configuration, gives an overall tetrahedral geometry and becomes more stable. However, for the monomer, the Al atom has 6 valence electrons, which is electron deficient and the Π interaction between Br and Al is not strong enough to compensate the electron deficiency. Overall, the monomer is not as stable as the dimer.
For comparison, if B atom is the central atom, e.g. BCl3, it prefers to give a trigonal planar geometry as in its monomer form. The difference in preferred structure is due to the steric reason of B and Al atoms. Although they are in the same group (group 3), B is much smaller than Al. There is no enough space for B to have 4 Cl atoms around it; instead it would prefer the planar geometry. But for BH3, because H atom is much much smaller than Cl, the steric effect is much reduced. Thus, the BH3 would be more stable at its dimer structure and the bridging B-H-B bond is a 3c-2e bond.
Frequency analysis of Al-Br stretching vibrations
For determine how the terminal / bridging Br atoms will affect the frequency of vibrational modes, two sets of stretching are chosen. One has the Br atom at the bridging position, whereas the other has the Br at the terminal position. For each set, the Al-Br bond stretching mode is chosen for each isomer and by comparing the frequency of each vibrational mode, the effect of Br atom is discussed. Herein, mainly the frequency is discussed, but not the intensity. The difference in intensity is due to the change in dipole moment. A lower intensity vibrational mode is due to the cancellation of vibrations; especially for highly symmetrical isomer, the intensities for many vibrational modes cancel out (discussed in section 2.8).
Only some displacement vectors are displaced on the stretching image, but actually all the atoms are involved in the vibrational modes. It is obvious shown that the Br atom has a shorter displacement than Al and Cl atoms due to the nature of heavier mass of Br atom. Under the same energy/frequency, Br moves less than Al and/or Cl atoms.
Bridging Br effects on Al-Br stretching vibrations
| Isomer | Point Group | Stretching Vibrational mode | No. of vibrational mode | Frequency | Intensity |
|---|---|---|---|---|---|
| 1 | C2v | 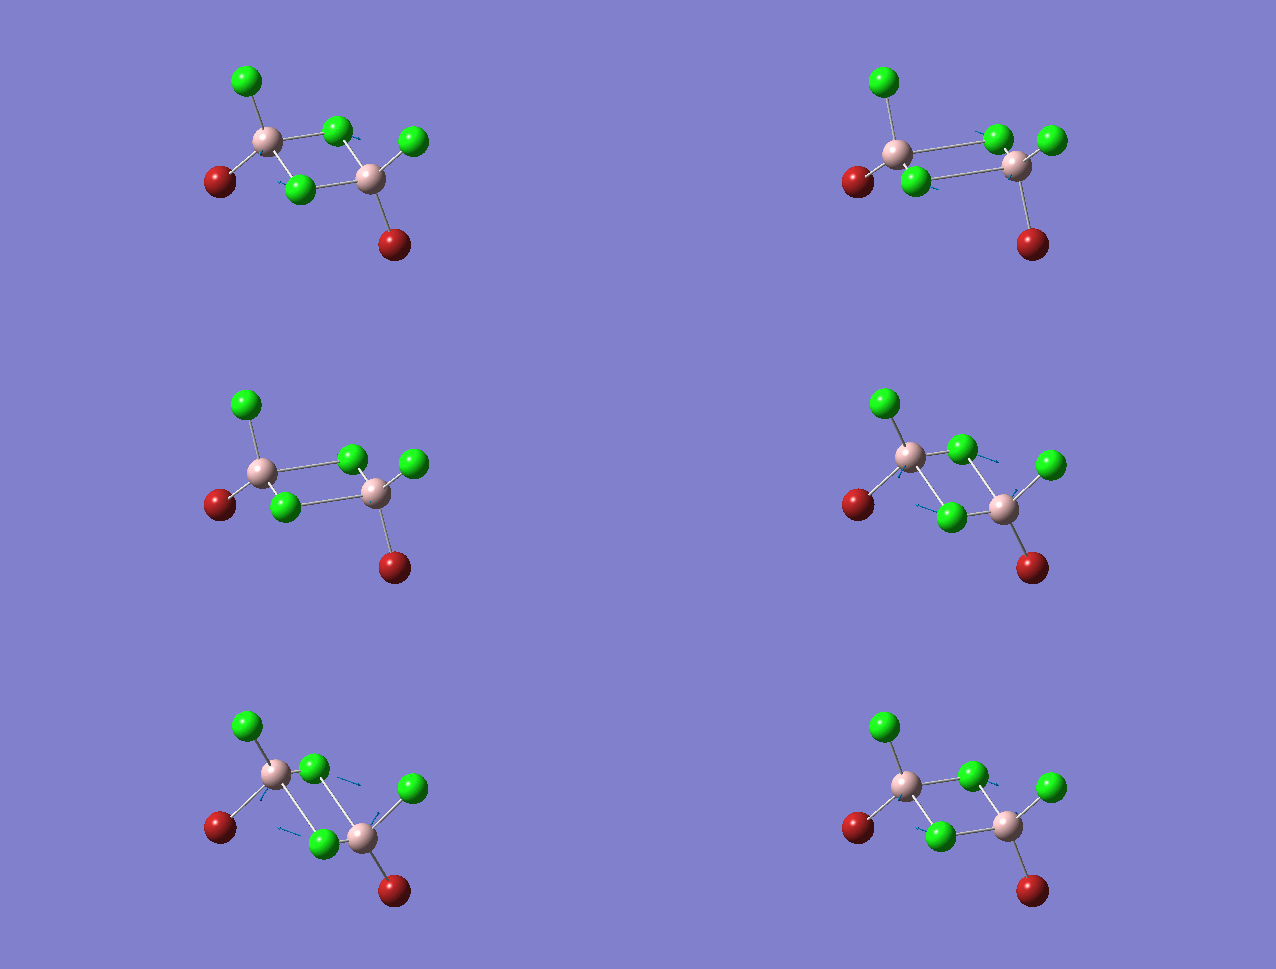
|
11 | 263 | 0 |
| 2 | C2h | 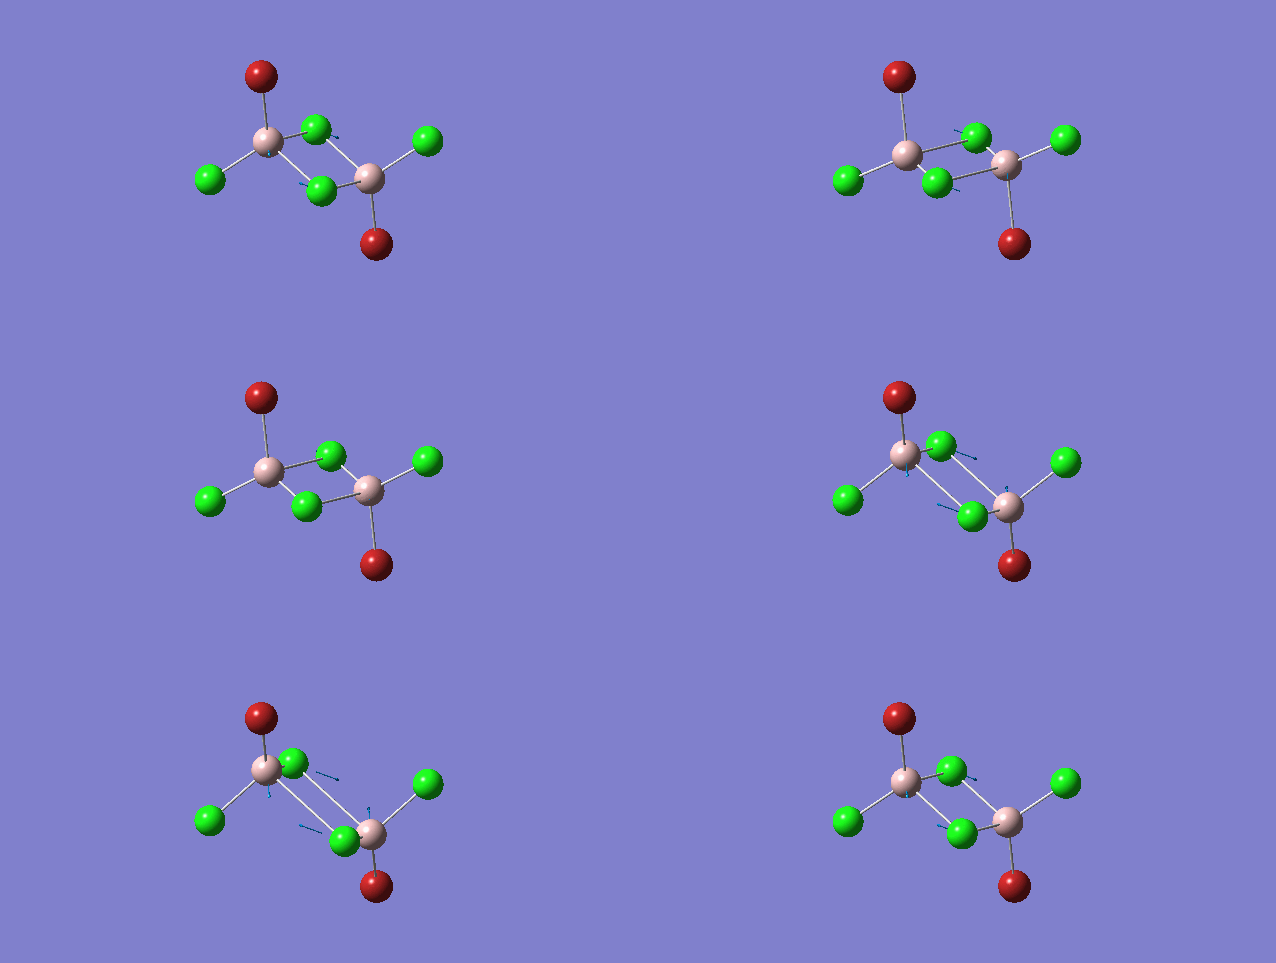
|
11 | 263 | 0 |
| 3 | C2v | 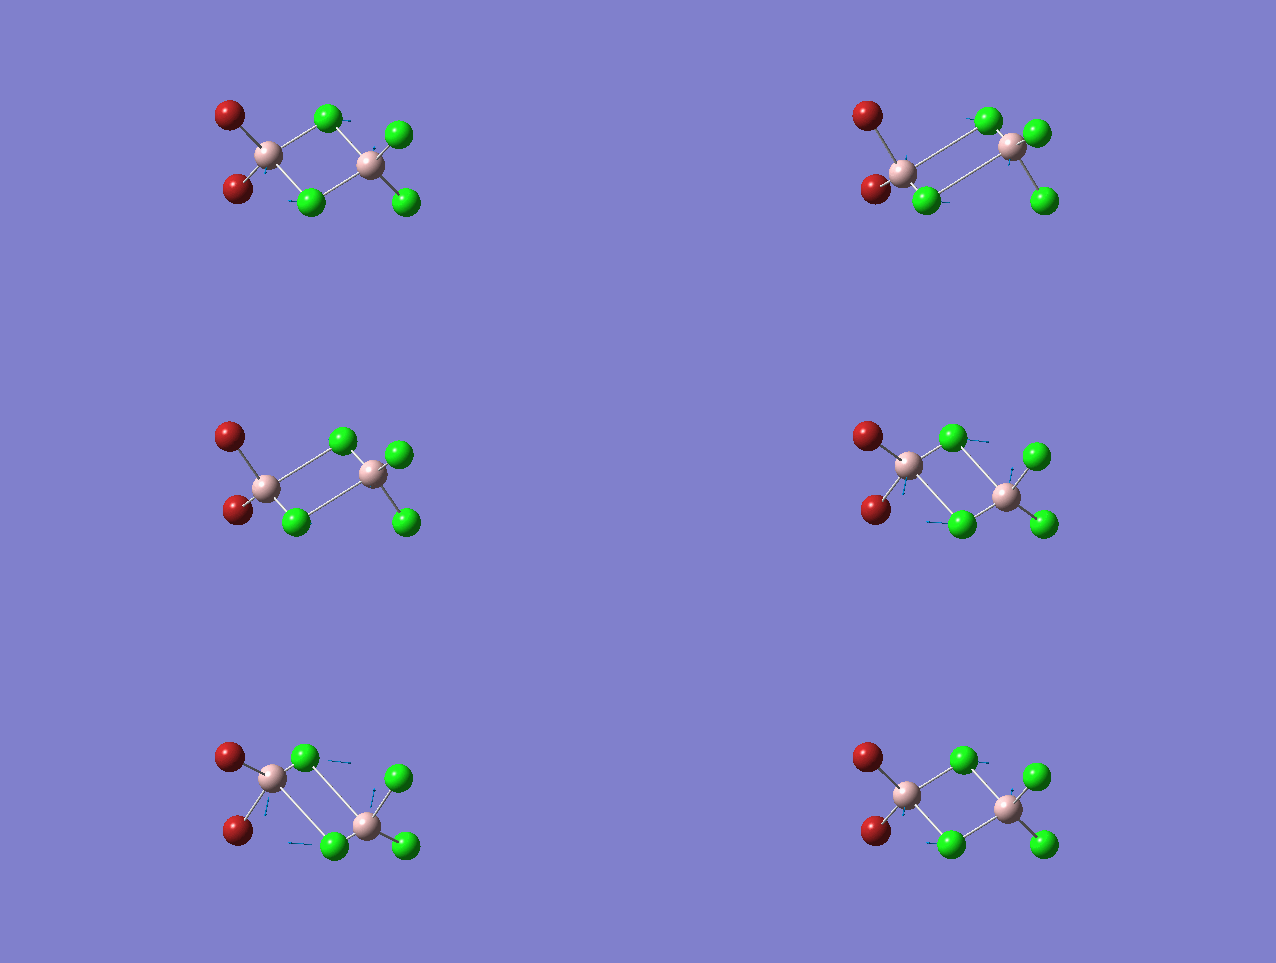
|
11 | 263 | 0 |
| 4 | D2h | 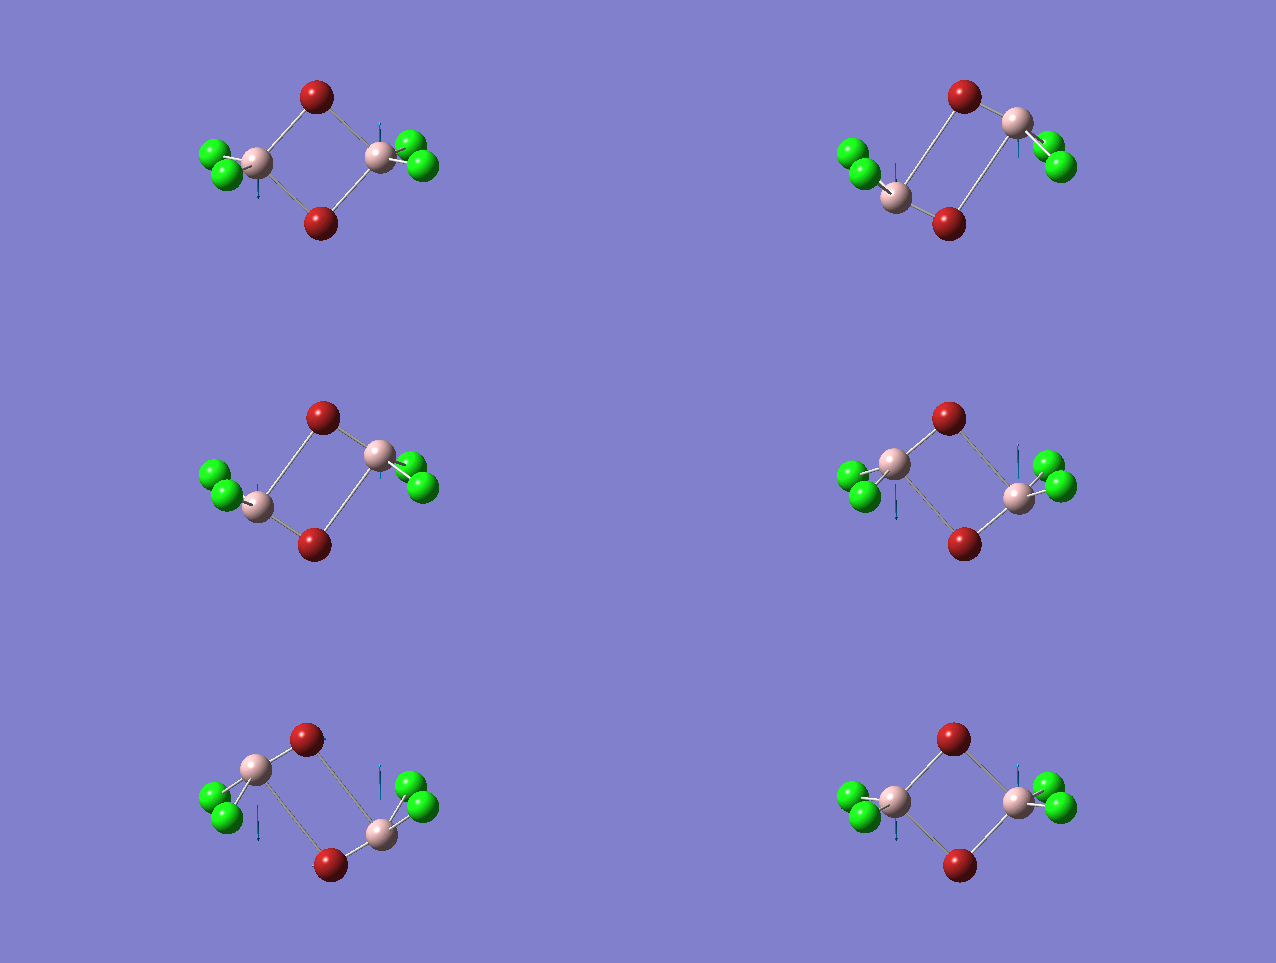
|
11 | 197 | 0 |
| 5 | C1 | 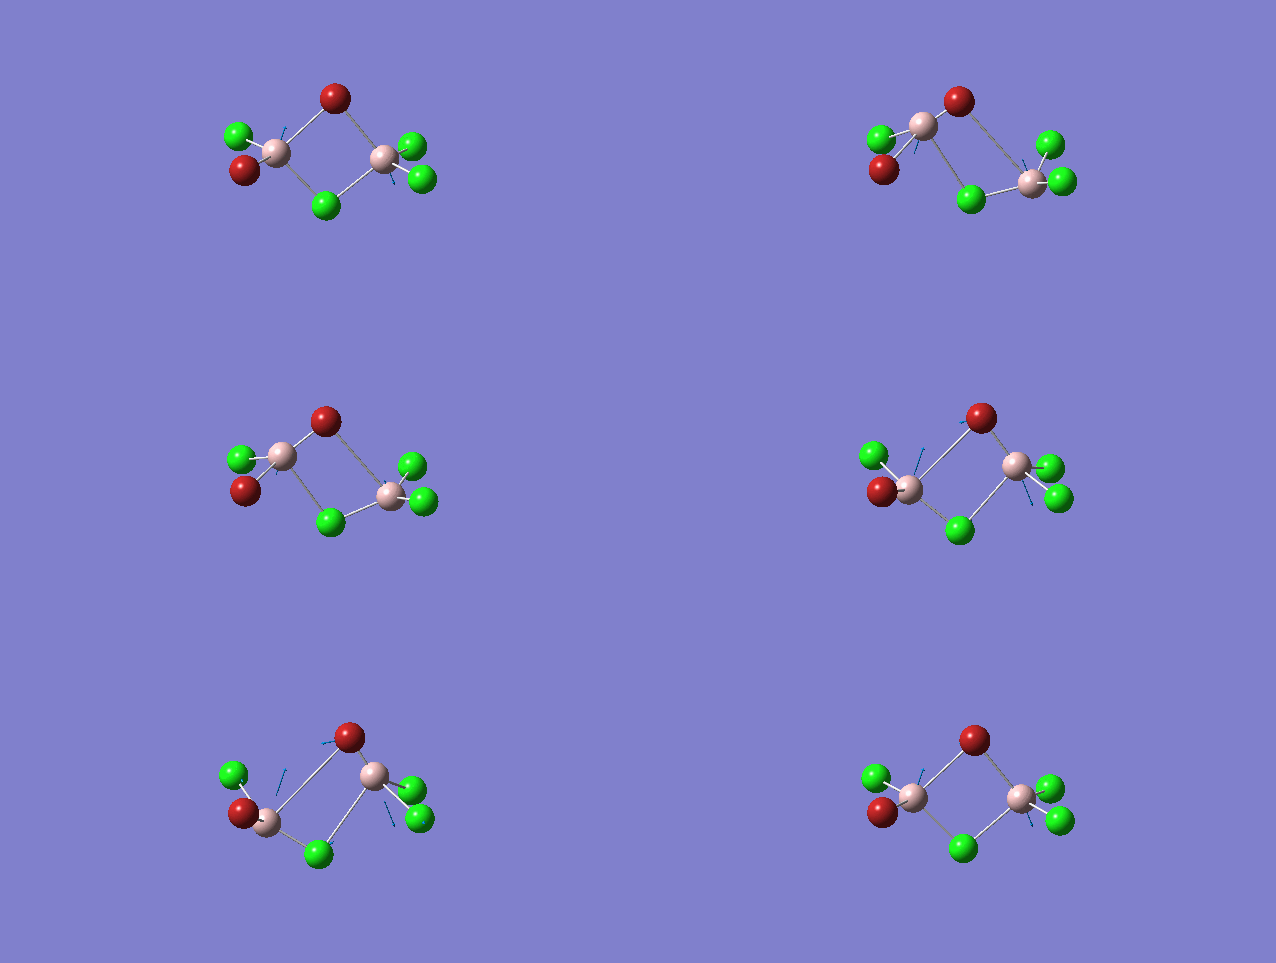
|
11 | 211 | 21 |
Order of frequency: isomer 1, 2, 3 > 5 > 4.
The stretching vibrational modes chosen above is used to illustrate how the bridging Br atom would affect the frequency. The specific stretching vibrational modes is chosen based on the same/similar Al-bridging Br / Al-bridging Cl vibrational motions. Isomer 1, 2, and 3 have two Cl atoms bridging, isomer 4 has two Br atoms bridging and isomer 5 has one Br atom bridging.
The frequencies of stretching vibrational modes of isomer 1, 2, 3 are the same, which indicates that for these vibrational modes, the terminal Br does not affect on the frequency much. It is obviously from the diagram that all the terminal atoms stay still and the amount of frequency heavily depends on the motion of the central four atoms (2 Al atoms and 2 bridging atoms). For the comparison with isomer 4 and 5, the frequency decreases with the number of bridging Br atoms. The reason would be the weak bond nature of Al-Br than Al-Cl and thus a smaller force constant, k. Al and Cl are on the same period and their atomic orbital are well-matched in size. There is a stronger orbital overlap presented and thus a stronger bond. But for Al-Br bond, Br is much larger than Al and thus a weaker orbital overlap and a weaker bond. In addition, the larger difference in electronegativity between Al-Cl than Al-Br contributes more ionic character in the covalent bond, as a result, leading to a stronger Al-Cl bond. Because Al-Br bond is weaker, less energy is required to have the same stretching vibration. As E=hν, a lower frequency is required. Therefore, because isomer 4 has 2 weaker Al-Br-Al bonds, the frequency is the lowest, whereas isomer 5 has one weaker Al-Br-Al bond and one stronger Al-Cl-Al bond, it has a bit higher frequency and isomer 1 / 2 / 3 has 2 stronger Al-Cl-Al bonds, thus it has the highest frequency.
Terminal Br effects on Al-Br stretching vibrations
| Isomer | Point Group | Stretching Vibrational mode | No. of vibrational mode | Frequency | Intensity |
|---|---|---|---|---|---|
| 1 | C2v | 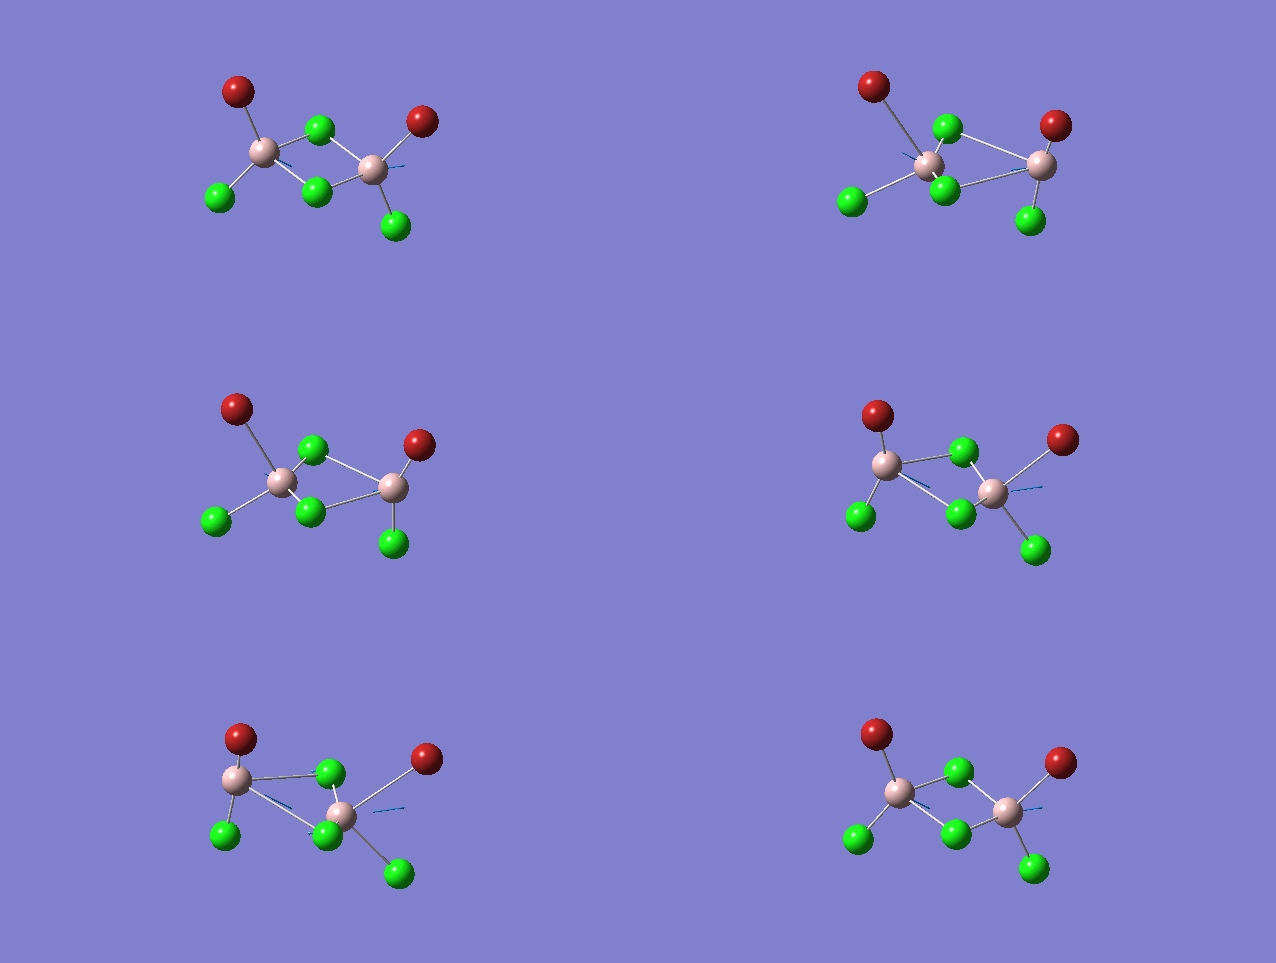
|
16 | 461 | 36 |
| 2 | C2h | 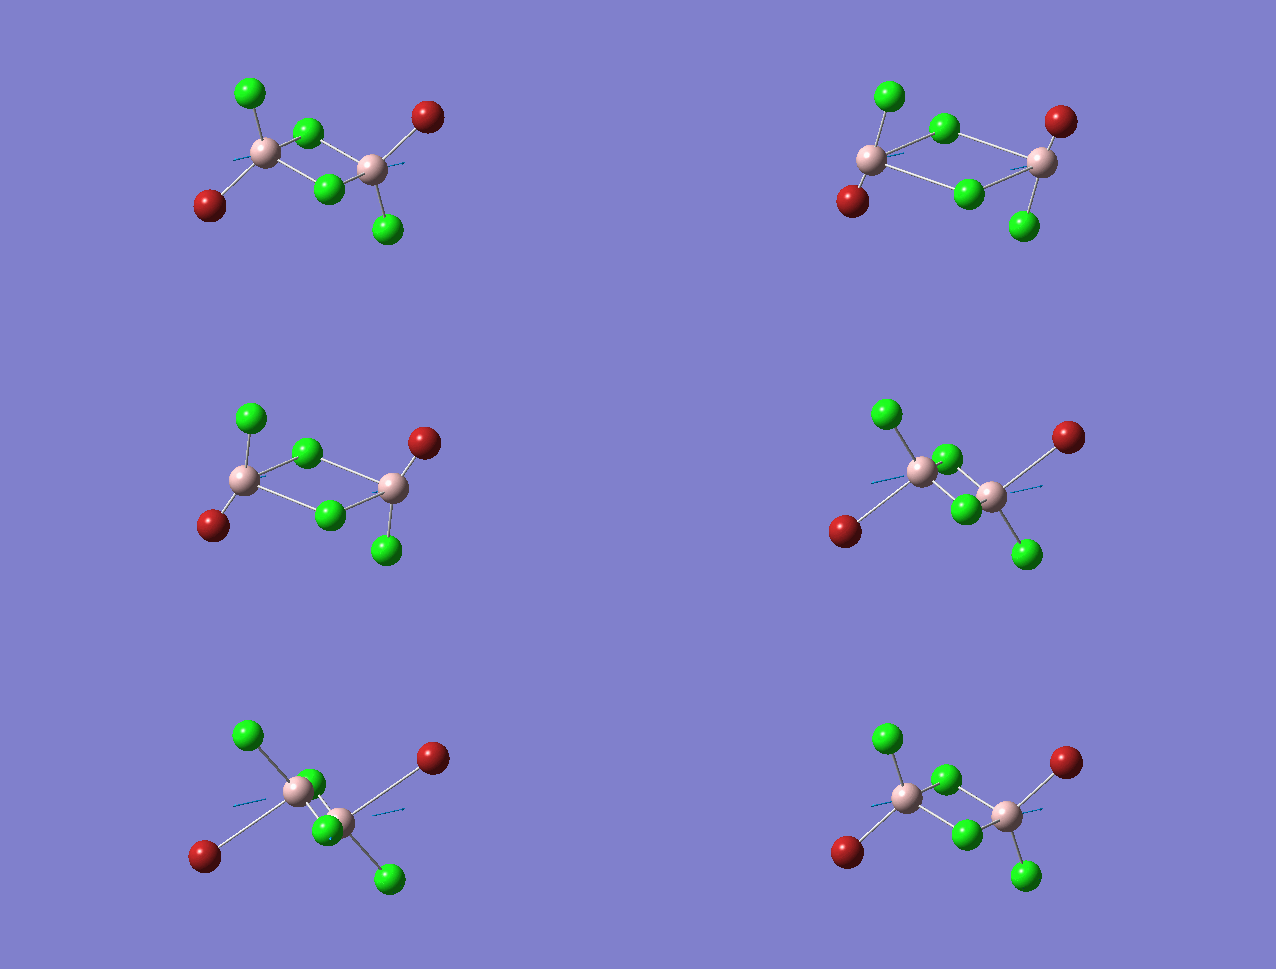
|
16 | 459 | 0 |
| 3 | C2v | 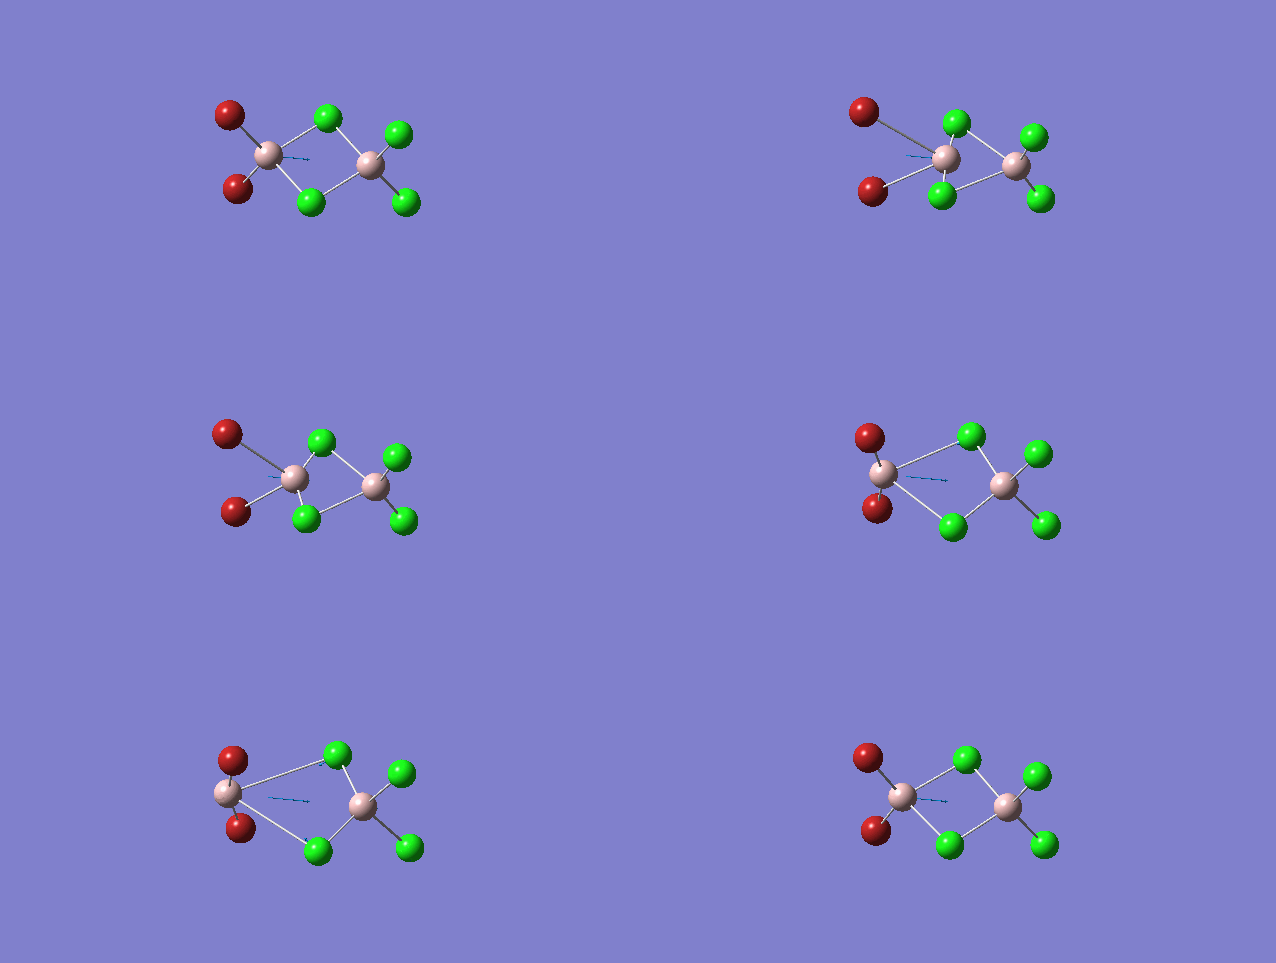
|
15 | 419 | 309 |
| 4 | D2h | 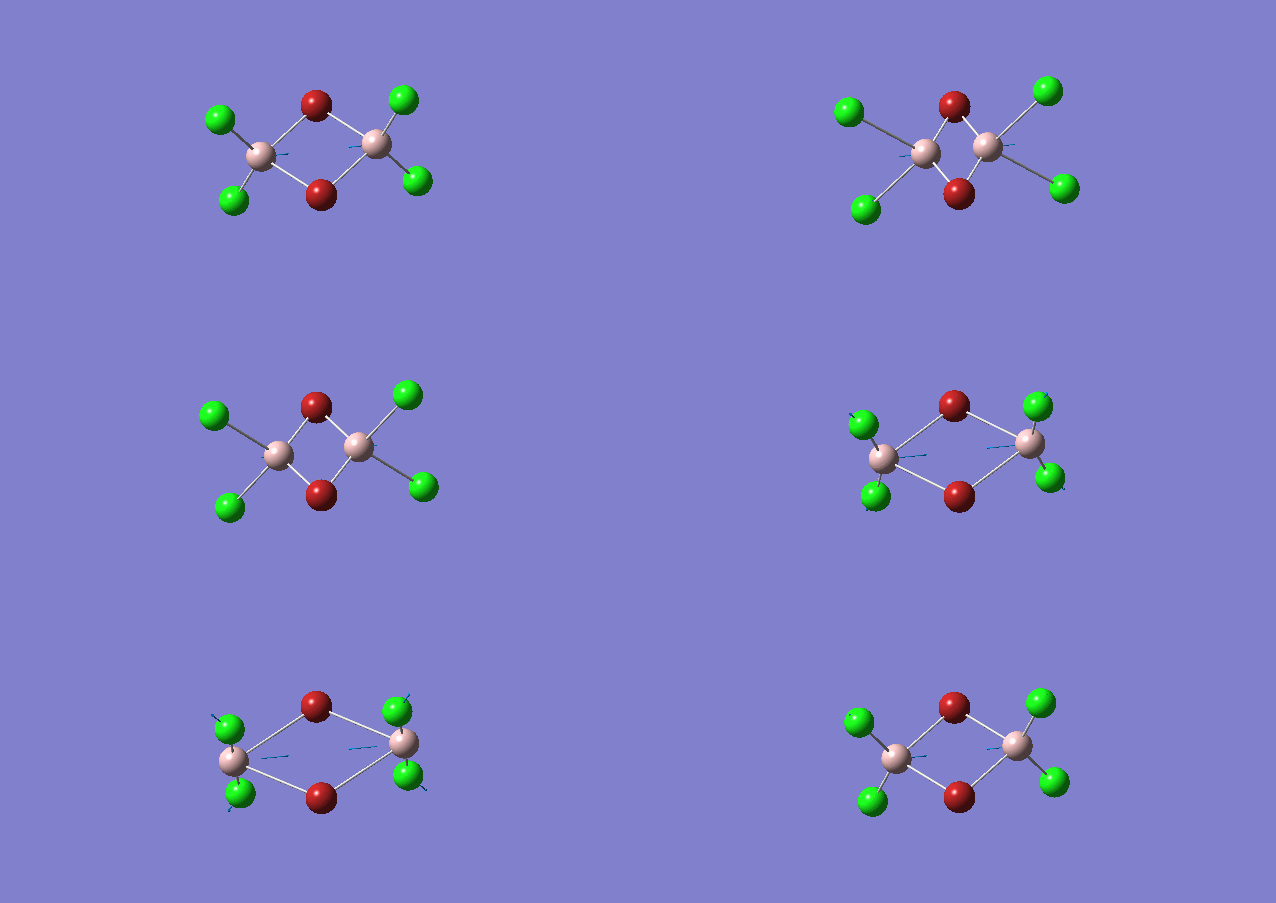
|
16 | 494 | 0 |
| 5 | C1 | 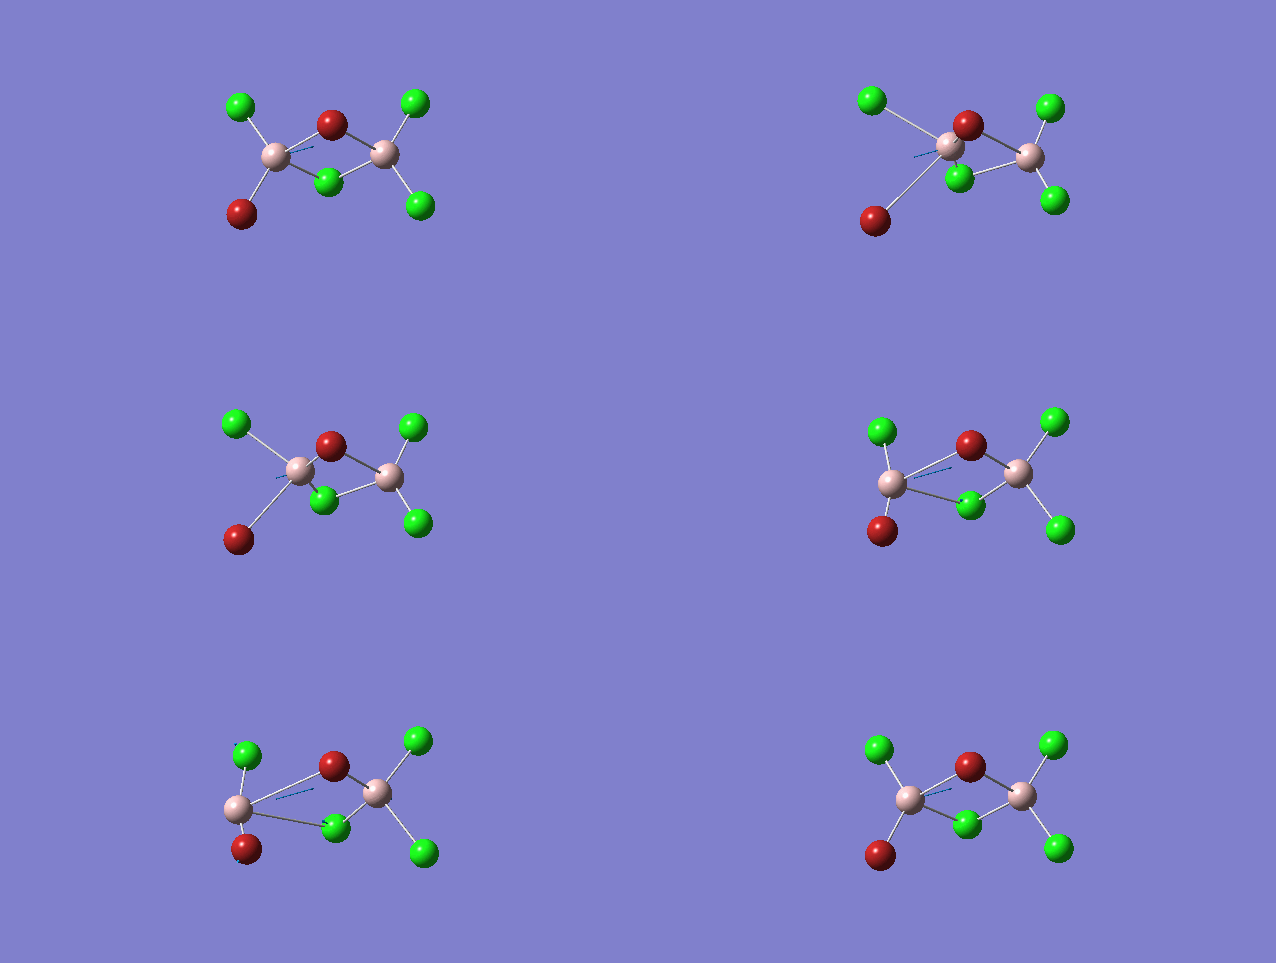
|
15 | 424 | 274 |
Order of frequency: isomer 4 > 1 > 2 > 5 > 3.
The stretching vibrational modes chosen are based on similar Al-terminal Br / Cl stretching vibrational modes and are used to illustrate how the terminal Br atom would affect the frequency. Isomer 1, 2, and 3 have two terminal Br atoms, isomer 4 has two Cl terminal atoms and isomer 5 has one Br terminal atom.
The frequencies of vibrational modes for isomer 1 and 2 are similar as the Al atoms are in the same environment: one 2c-2e Al-Cl bond, one 2c-2e Al-Br bond and one dative Al-Cl bond and exhibit the similar force constant. Isomer 4 has the largest frequency due to two terminal Cl atoms. As stated before, the Al-Cl bond is stronger than Al-Br, isomer 4 with two strong Al-Cl bonds would require the largest amount of energy for the vibration, thus the highest frequency. Isomer 3 has the lowest frequency due to the presence of two weak Al-Br bonds.
Comparison of terminal/bridging Al-Br frequency
Overall, the frequencies of Al-Br stretching vibrations for bridging Br is lower than that for terminal Br. This is due to the bond nature of the Al-Br bond. For the bridging Al-Br, it is a weaker dative bond, whereas for terminal Al-Br is a stronger 2c-2e covalent bond. The higher the frequency, the larger the energy, therefore a stronger 2c-2e covalent bond would give a higher frequency. In addition, as discussed in section 1.6.3 about the factors which can affect the frequency, the force constant, k, for terminal Al-Br bond is larger than that for bridging Al-Br, thus leading to a higher frequency too.
MO Analysis of Isomer 3
The MO analysis file is DOI:10042/195304
The computed molecular orbitals were generated for isomer 3. There are 54 occupied orbitals (numbered according to energy), but the first 30 molecular orbitals show only localised molecular orbitals for certain atoms, which is out of interest. Also, the first 30 MOs are called core-orbitals, whereas 31-54 MOs are named as valence orbitals. Any further orbitals greater than 54 is not considered as they are non-occupied orbitals and more diffused.
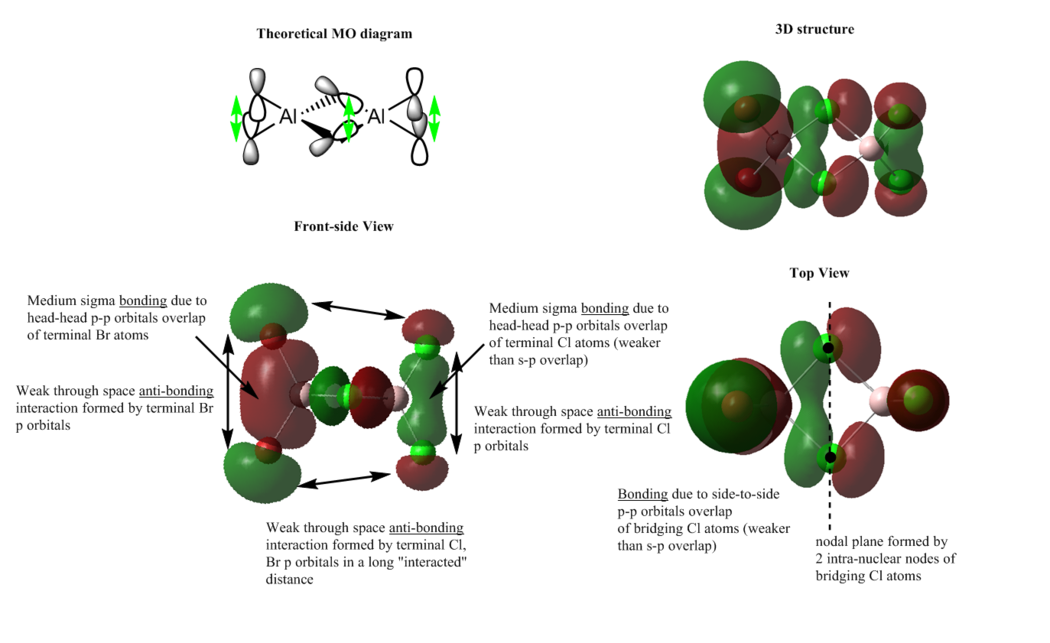
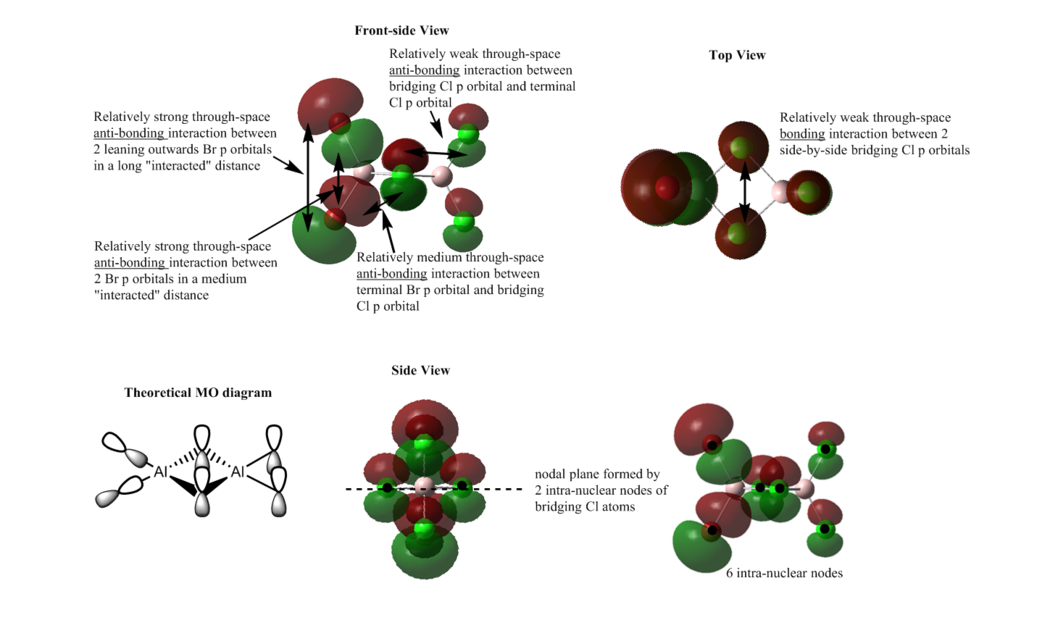
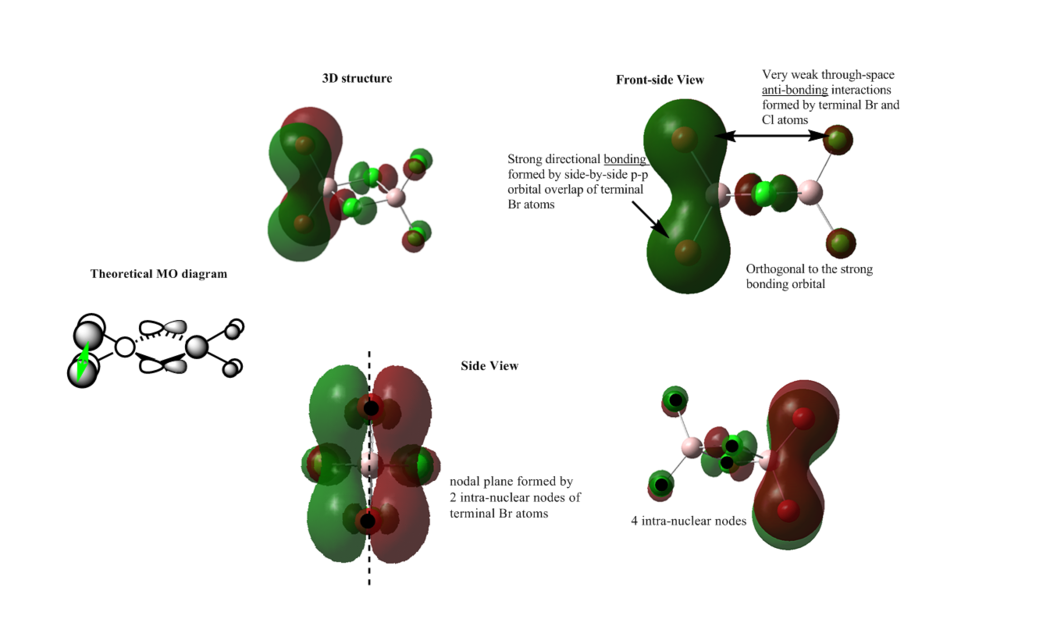
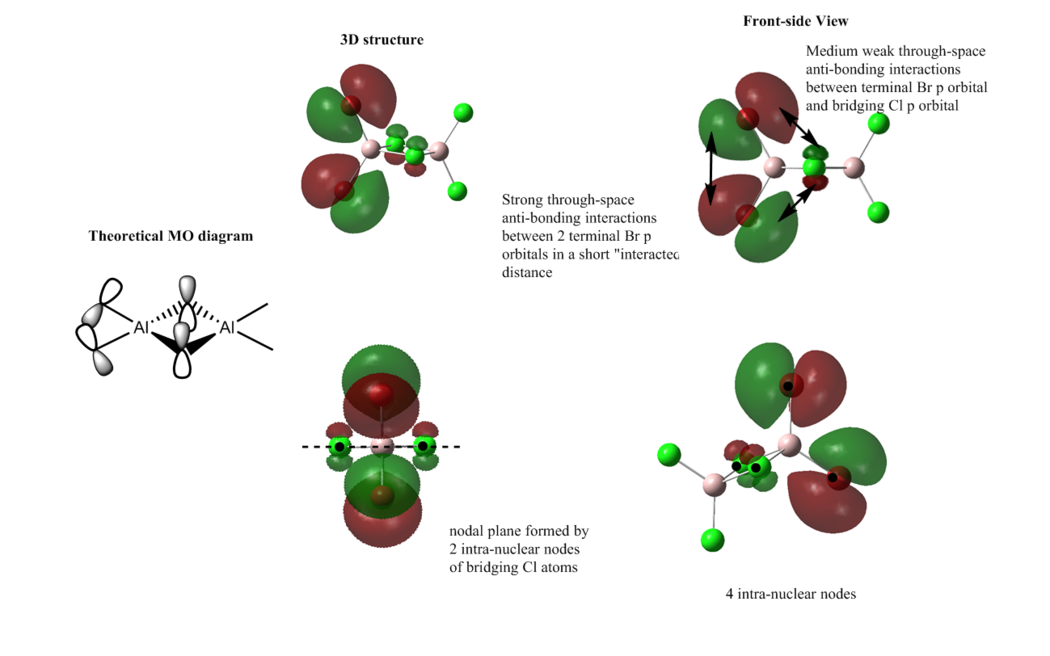
The MOs (37, 43, 46, 52, 54)are chosen for analysis due to their interesting orbital shapes and arrangements. For the interpretation shown below, the 3D structure, top view and side view are presented and the theoretical MO diagram (from LCAO) is drawn for comparison.
Each MO contains a number of bonding and anti-bonding interactions, including through-space interaction. The bonding and anti-bonding interactions can be classified as weak, medium and strong. For a more detailed classification, it can be divided into strong directional overlap, weak through space interaction, s-p overlap, head-to-head p-p orbital overlap and side-to-side p-p orbital overlap. Some weak through space interaction is not discussed in detail below, because they can be neglected due to the considerable long distance between atoms. Side-to-side p-p orbital overlap gives a pi bond, which is normally stronger than the head-to-head p-p orbital overlap (a sigma bond), however both orbital overlap are weaker than s-p overlap.
The interpretation shown below also includes the discussion of node / nodal plane, a region where there is no electron density or zero possibility to find an electron. A nodal plane appears when the destructive interference of electron wavefunction is complete on a plane in between the nuclei. In addition, there is also an intra-nuclear node in the middle of the p orbital, but it is much less important than the inter-nuclear node.
The green double-headed arrow shown on the theoretical MO diagram represents bonding interaction.
MO 37
Overall: strong bonding
The s orbital of Al atom overlaps with the p orbital of Cl atoms to give a strong bonding interactions, and the bonding interactions give the red and green lobes delocalised over 4 frame Cl-Al bonds. The green lobe seems to be a little more diffused. These two big lobe regions lie along the bridging bond indicates an entirely sigma bonding. There are weak through space bonding interactions presented in a either relatively medium or long interacted distance.
In addition, there is a nodal plane which bisecting the bridging Cl atoms and also there are 4 intra-nuclear nodes between the Cl atoms, which is not really important.
MO 43
Overall: medium bonding
The bonding is mainly contributed from two sigma bonds between head-to-head p orbitals overlap of terminal atoms. The head-to-head p orbital overlap of terminal Cl atoms is, however, weaker than s-p orbital overlap in MO 37; thus the overall bonding is medium, rather than strong. From the top-view of this MO, there is a direct bonding character, side-by-side p orbital overlap, between the two bridging Cl atoms, which is not shown on the theoretical MO. The MO generated by bridging atoms is orthogonal to that generated by terminal atoms and these two MOs do not interact with each other. The central MO (by bridging Cl atoms) is delocalised through two bridging Cl atoms.
In addition, there are some weak through space bonding and anti-bonding interactions. For the terminal Cl atoms, the red lobe seems to be more diffused than the green one, probably due to the larger Br atom. It can be suggested that the larger bonding red lobe contributes more to the overall bonding MO than the green lobe does.
There is only one nodal plane, which is generated by the 2 intra-nuclear nodes at the bridging Cl atoms.
MO 46
Overall: weakly anti-bonding
In this MO, there are mainly 5 weak through-space bonding and anti-bonding interactions. The anti-bonding interaction between 2 terminal Br atoms is relatively strong. The head-to-head anti-bonding interaction between 2 terminal Cl is relatively strong as well. The interaction between the terminal Cl and the terminal Br is weakly bonding and the anti-bonding interaction between the terminal Br and bridging Cl is relatively weak. In addition, there is weak through space bonding interaction between the side-by-side p-p orbital overlap of 2 bridging Cl atom. Therefore, overall, as mainly through-space anti-bonding interactions are presented, this MO is weakly anti-bonding. The electron density is delocalised in the Al-Br bond, with the Br atoms bearing the most electron density. However, mostly, the electron density is mainly localised on the atoms themselves.
Furthermore, there is one nodal plane which bisecting the bridging Cl atoms. There are also 6 intra-nuclear nodes on all halogen atoms.
MO 52
Overall: strong bonding
There is a strong side-by-side p-p orbital overlap between the terminal Br atoms, it forms a pi framework over the two atoms. The orbitals of bridging Cl atoms are orthogonal to the pi framework, which does not have a strong interaction with the bonding orbitals. The electron density is delocalised through the pi bonding orbital of the two terminal Br atoms according to the two large green and red lobes.
There is a nodal plane generated by 2 intra-nuclear nodes of the terminal Br atoms, which bisecting the two terminal Br atoms. There are also 4 intra-nuclear nodes of Cl atoms, which is out of interested.
MO 54
Overall: anti-bonding
There are mainly two types of weak through-space anti-bonding interactions. One is realtively strong between the two terminal Br p orbitals and the other one is between the terminal Br and the bridging Cl atoms. The later interaction is realtively weaker because the orbital sizes of bridging Cl atoms are much smaller than that of terminal Br atoms, therefore there is a weaker interaction compared to the 2 terminal Br atoms. The electron density is mainly delocalised on the atomic orbitals and there is no main delocalisation occur.
There is one nodal plane formed by 2 intra-nuclear nodes of bridging Cl atoms and also there are 4 nodes of the individual halogen atoms (2 Cl and 2 Br)
Summary
From the 5 MO analysis discussed above, the real MOs reveal the situation of the orbital shape, size and geometry. By comparing with the theoretical MOs, some information is missed in the theoretical ones and it indicates that the LCAO is not suitable for large and complex molecules as discussed above (section 1.7). The computational methods simulate the real MO based on high-level accurate basis to minimise the possible error and it is an extremely useful tool for obtaining real MOs.
An additional point that is interesting is that there is some pi framework involved in the dimer, which is generated by the bridging Cl and terminal Cl atoms.
Conclusion
In this computational lab, quantitative analysis are presented in detail, including information for a molecular orbital, such as orbital symmetry, orbital interaction characters. Different basis sets are used based on the size and number of electrons of the atom. For example, 3-21G is a relatively low-accuracy level and can be used for simple molecules. 6-31G(d,p) is a more accurate level and is used for larger molecules. If very large atom is presented, e.g. Br atom, the pseudo potential is carried out by involving the core electrons.
The majority of the project is the analysis of Lewis acid, Al2Cl4Br2. There are 6 possible conformers and optimisation, frequency analysis and molecular orbital analysis were carried out. Energies of all 6 isomers are compared. Frequency analysis of the most stable conformer (isomer 3) was carried out to rationalise the effect of different stretching modes and how the position of Br atom affect the frequency of different vibrations. The overall trend is that due to the weak Al-Br bond and larger orbital difference between Al and Br atom, the frequency of the vibrational modes containing Al-Br bond is lower. Detailed molecular orbital analysis was carried out and 5 specific chosen MOs are discussed in detail about its bonding character. In addition, the stability of the dimer form is confirmed by the negative dissociation energy value for the most stable isomer into 2 monomer, AlCl2Br.
Reference
- ↑ Lewis, Gilbert N. . The Atom and the Molecule. Journal of the American Chemical Society, 1916 38 (4): 772.
- ↑ A.Holden, Bonds Between Atoms, Oxford University Express, 2nd edition, 1971.
- ↑ N.W. Alcock, Bonding and structure, Oxford University Express, 2nd edition, 1990.
- ↑ 4.0 4.1 4.2 S. Atkins, Inorganic Chemistry, Oxford University Express, 5nd edition, 2009.
- ↑ A.C. Ugural, S.K. Fenster, Advanced Strength and Applied Elasticity, 4th ed
- ↑ C. Housecroft, A. Sharpe, Inorganic Chemistry,Pearson, Prentice Hall, Harlow, 2nd edition, 2005,124-127.

