Rep:Mod:ll4310
Computational Labs: Module Two[1]
Introduction
GaussView 5.0 can be used to model molecules by optimising bond lengths and angles, hence working out the relative positions of atoms and electrons in space and effectively solving the Schrödinger equation. As most molecules are too complex to use the standard Schrödinger equation due to them being multi-electron systems, basis sets and pseudo-potentials need to be used to improve calculations, giving more accurate outputs. The software can be used to make spectroscopic predictions, for example by identifying the infrared active modes based on molecular orbital symmetry, and comparisons can be made between molecular orbital predictions by computational calculations and those made by Linear Combination of Atomic Orbitals.
Optimisation
Optimisation is the process by which the lowest energy configuration of a molecule is found. This is done using GuassView by first fixing all atoms of a molecule, which in the next example will be the BH3 molecule, in a chosen position (below all B-H bond lengths will be set to 1.5Å and H-B-H angles to 120°). The software then solves the Schrödinger equation for the electron density and the energy of the system using these coordinates. The position of the nuclei then needs to be solved; this is done by moving the nuclei and repeating the calculations for the energy and electron density, which is repeated at many different nuclei positions. The software then finds the configuration which gives the lowest energy, hence the optimised geometry of the molecule. The software can be manipulated by choosing a. the approximations made to solve the Schrodinger equation (the method), b. the accuracy with which the calculations will be carried out (the basis set) and c. the type of calculation which will be performed, for example an optimisation.
BH3 Optimisation
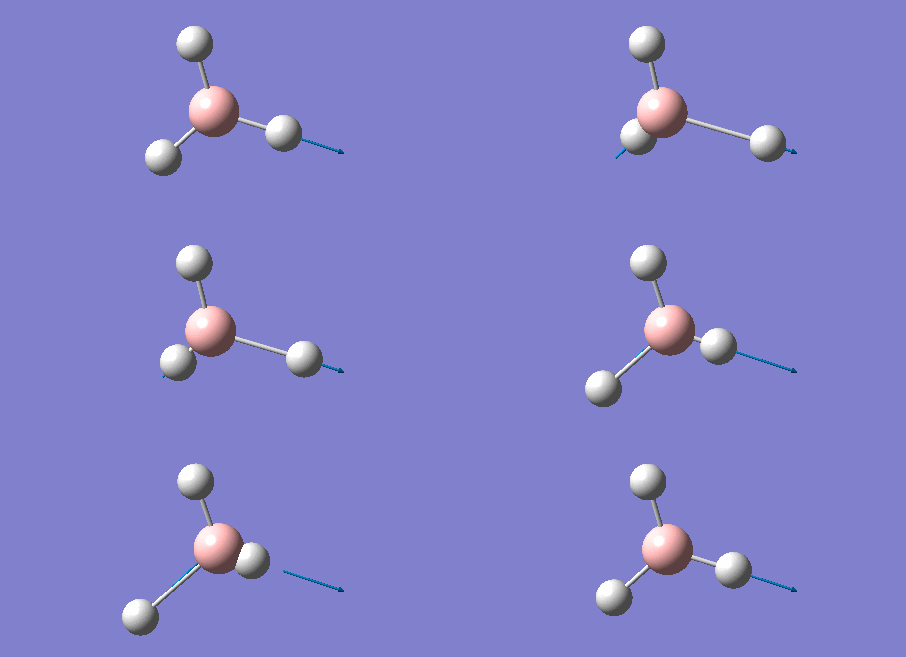
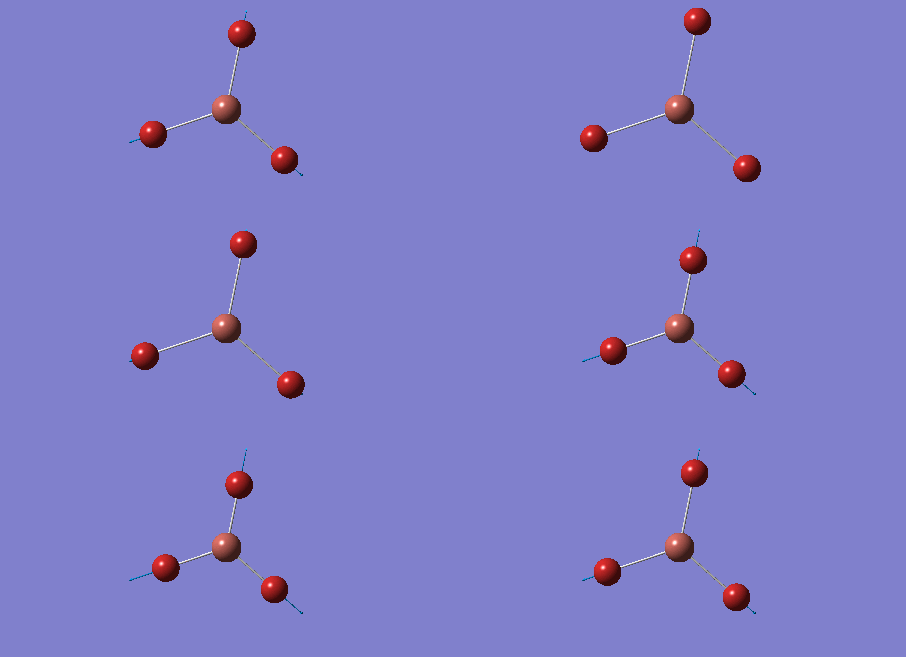
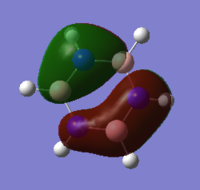
The Gaussview software was used to optimise a BH3 molecule. The bond lengths were initially all set to 1.5 Å. A calculation was then run under the job type 'FOPT', using the B3LYP method and the basis set 3-21G. The calculation gave the following .log output generating the following molecule.
Below is a summary of the properties of the optimised molecule:
| Calculation | Result |
|---|---|
| B-H Bond Length /Å | 1.19 |
| H-B-H Bond Angle /° | 120.0 |
| Final Energy /au | -26.4622633 |
| Gradient | 0.00 |
| Dipole Moment /Debye | 0.00 |
| Point Group | D3h |
| Calculation Time/ s | 22.00 |
Using the 3-21G basis set, a relatively simple basis set, meant that the accuracy of the calculation was compromised to speed up the calculation, hence the summary above gives fairly inaccurate results for energy and bond lengths.
Item               Value     Threshold  Converged?
 Maximum Force            0.000413     0.000450     YES
 RMS     Force            0.000271     0.000300     YES
 Maximum Displacement     0.001610     0.001800     YES
 RMS     Displacement     0.001054     0.001200     YES
 Predicted change in Energy=-1.071764D-06
 Optimization completed.
    -- Stationary point found.
The table above was obtained from the .log output file. It shows that both the forces and the displacements converged. As the force gives the gradient of the energy vs distance graph this means the energy of the molecule went to a minimum at this bond distance hence BH3 was fully optimised. Convergence of the displacement also shows that the molecule was fully optimised, meaning a very small change in atom position would not change the molecule energy hence it was fully optimised and at an energy minimum (ie. the energy vs. distance graph of the molecule had a gradient of zero at this point).
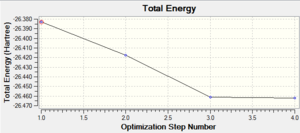
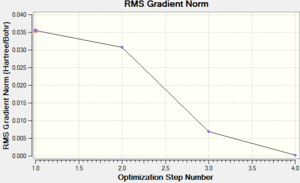
The graphs on the right show how the energy and the energy gradient (the change in energy over the change in distance) of the molecule changed throughout the optimisation steps, which, from the x axes, can be seen to have occurred over four steps. From the bottom graph (gradient vs. optimisation step) the gradient is seen to reach zero at the fourth optimisation step. This shows that the molecule is at its lowest equilibrium energy; it corresponds to the energy vs. distance graph reaching a minimum as at this point the gradient is equal to zero. This can be understood by considering movement along a potential energy surface; as the molecules become closer together the overall energy decreases until a certain distance where a minimum is reached (the gradient is equal to zero at this equilibrium distance). The energy then begins to increase rapidly due to repulsion between the atoms (which has a much greater distance dependence hence a much greater gradient). Optimisation calculations are therefore used to find this minimum equilibrium displacement as here the energy is at a minimum, seen by the fact that on the energy vs optimisation graph the energy is most negative at the final optimisation stage, and the gradient reached zero, as can be seen on the top graph.
Further optimisation
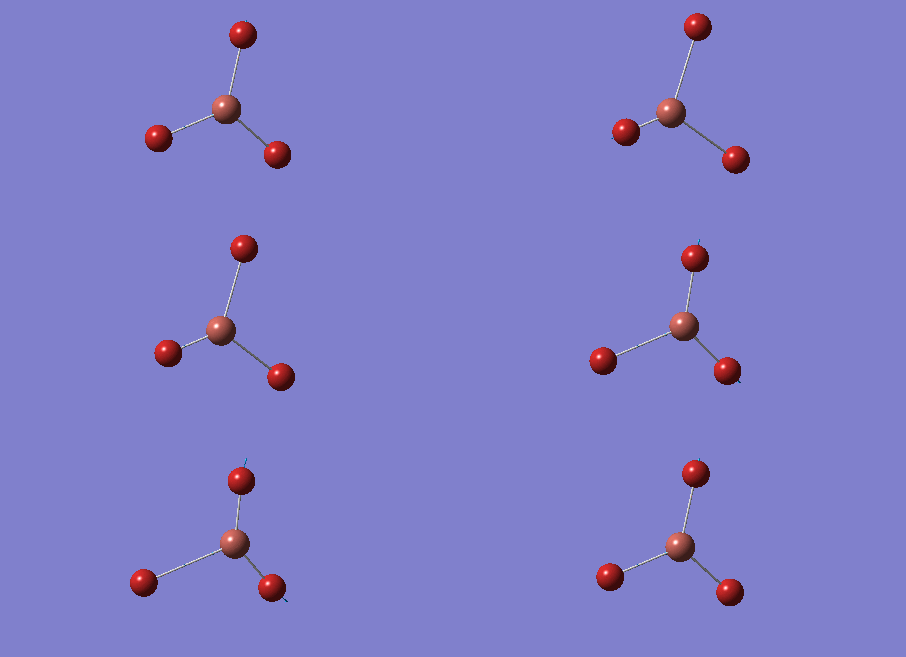
As the previous calculation was very simplified in order to get an approximate geometry of the molecule it was necessary to further optimise the structure by building on the previous results. This was done by improving the basis set for the calculations, meaning that the electron structure of the molecules was described using more functions to give a better model. Changing to the 6-31G basis set gives a better model of the energy of the core electrons (those not involved in bonding), hence giving a better overall model of and calculation on the molecule. The calculation was again run under the job type 'FOPT' and the calculation method RB3LYP, but this time using the basis set 6-31G(d.p), giving the following molecule with the .log output file and properties:
| Calculation | Result |
|---|---|
| B-H Bond Length /Å | 1.19 |
| H-B-H Bond Angle /° | 120.0 |
| Final Energy /au | -26.6153225 |
| Gradient | 0.00 |
| Dipole Moment /Debye | 0.00 |
| Point Group | D3h |
| Calculation Time /s | 26.0 |
It is not possible to compare the results between the two calculations; for the second approximation a basis set which allowed a more accurate calculation was used, so more functions were used to generate the second optimisation results hence the results cannot be compared. The following output data show that the forces and the displacement converged meaning that the molecule was at an energy minimum and the optimisation process went to completion.
Item               Value     Threshold  Converged?
 Maximum Force            0.000433     0.000450     YES
 RMS     Force            0.000284     0.000300     YES
 Maximum Displacement     0.001702     0.001800     YES
 RMS     Displacement     0.001114     0.001200     YES
 Predicted change in Energy=-1.189019D-06
 Optimization completed.
    -- Stationary point found.
TlBr3
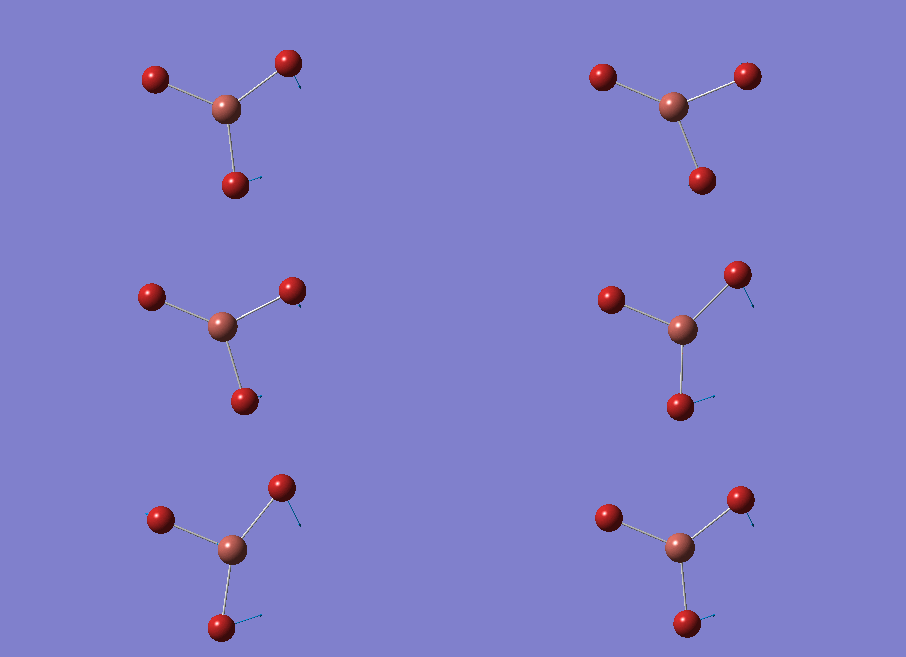
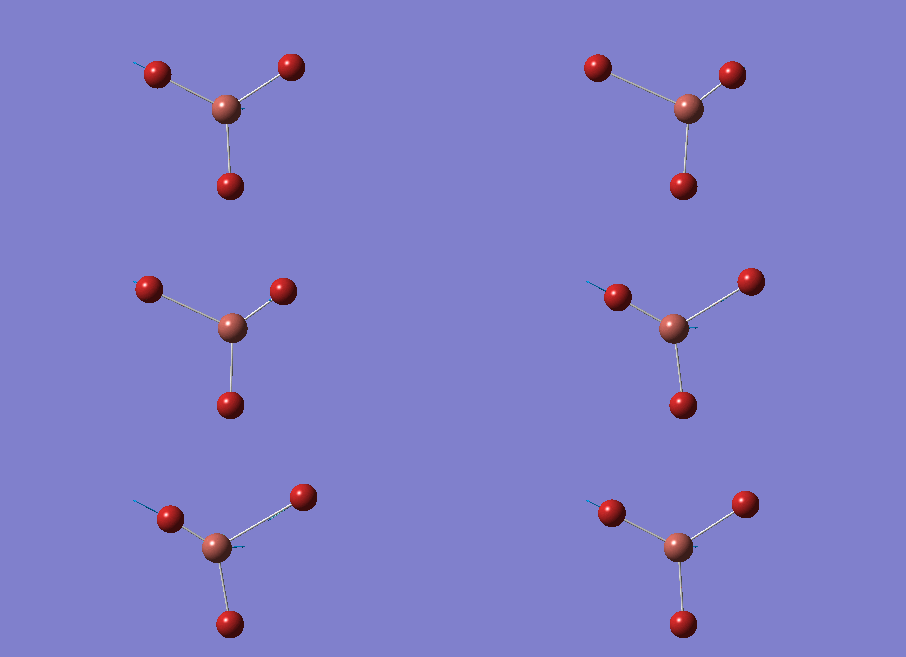
Due to the fact that both Tl and Br have high electron counts it is necessary to use pseudo-potentials; the high electron count means that the atoms and hence the molecule cannot be modelled by the Schrodinger equation. The assumption that only the valence electrons are involved in the interaction is made, and a pseudo-potential is used to model the core electrons of the constituent atoms. For this calculation GaussView was used to create a new molecule; the trigonal planar TlBr3. For this example the symmetry had to be restricted; the point group was set to D3h and the tolerance set to very tight. This was done by opening the 'point group' palette, selecting 'enable point group symmetry', choosing the D3h point group and increasing the tolerance to 'very tight (0.0001), so the symmetry would not be lost during the calculations. Again the calculation type was set to 'optimisation' and the method set to B3LYP. The basis set chosen was the LanL2DZ set, a medium level basis set using pseudo-potentials for heavy atoms. This set uses a balance between simulation time and accuracy of output. The simulation was first run through GaussView and then through the HPC service due to more complex and hence time consuming calculations, giving the final visual output on GaussView shown here, with the following .log ouput data in order to prove that the forces converged and the calculation went to completion. The HPC output was updated to D space and can be accessed by the following link: DOI:10042/21598 .
Item               Value     Threshold  Converged?
 Maximum Force            0.000002     0.000450     YES
 RMS     Force            0.000001     0.000300     YES
 Maximum Displacement     0.000022     0.001800     YES
 RMS     Displacement     0.000014     0.001200     YES
 Predicted change in Energy=-6.084005D-11
 Optimization completed.
    -- Stationary point found.
The table below summarises the properties of the optimised TlBr3 molecule:
| Calculation | Result |
|---|---|
| Tl-Br Bond Length /Å | 2.65 |
| Br-Tl-Br Bond Angle /° | 120.0 |
| Energy /au | -91.2181285 |
| Gradient | 0.00 |
| Dipole Moment /Debye | 0.00 |
| Point Group | D3h |
| Calculation Time /s | 19.1 |
Experimental measurements of the Tl-Br bond have been made in literature, giving values of 2.51Å[2], 2.520 Å[3] and 2.529 Å[3]. These are shorter than the calculated value using the 6-31G basis set of 2.651 Å. This may be due to the theoretical model underestimating the energies of the Tl and Br electrons, hence predicting a weaker bond between the two atoms. This is also evident in both of the literature articles, as both use computational techniques to predict the Tl-Br bond lengths, and both of which calculate values larger than the experimental values.
BBr3
The BBr3 molecule is different to TlBr3 in that it contains a light atom, the first row element boron, and three heavier bromine atoms, making it necessary to use a mixture of pseudo-potentials (for the Br atoms) and basis sets for the boron and also the bromine atoms. The calculation was run by building on the optimised BH3 molecule (which used the 6-31G(d,p) basis set), swapping the hydrogen atoms for Br. The basis set on the methods tab was set to GEN, so that different basis sets could be used for the light and heavy atoms, and pseudo=read gfinput was written in the keywords section to allow this. The file was saved, the resultant input file opened, to give the following input text.
%chk=\\ic.ac.uk\homes\ll4310\Desktop\3rdyearlabs\BH3 optimisation.chk
# opt b3lyp/gen geom=connectivity pseudo=read gfinput

BBr3 optimisation gen

0 1
 B                  0.00000000    0.00000000    0.00000000
 Br                -1.74937097   -1.01000059    0.00000000
 Br                 1.74937097   -1.01000059    0.00000000
 Br                 0.00000000    2.02000000    0.00000000

 1 2 1.0 3 1.0 4 1.0
 2
 3
 4
This table was then edited so that the appropriate basis sets and pseudo-potentials could be chosen for the appropriate molecules as follows:
%chk=\\ic.ac.uk\homes\ll4310\Desktop\3rdyearlabs\BH3 optimisation.chk
# opt b3lyp/gen geom=connectivity pseudo=read gfinput

BBr3 optimisation gen

0 1
 B                  0.00000000    0.00000000    0.00000000
 Br                -1.74937097   -1.01000059    0.00000000
 Br                 1.74937097   -1.01000059    0.00000000
 Br                 0.00000000    2.02000000    0.00000000

 1 2 1.0 3 1.0 4 1.0
 2
 3
 4

B 0
6-31G(d,p)
****
Br 0
LanL2DZ
****

Br 0
LanL2DZ
The first additional line of the input shows that the 6-31G(d,p) basis set was used for the B atom, the second line shows that the LanL2DZ pseudo-potential basis set was used for the bromine atoms and the third line shows that the LanL2DZ basis pseudo-potential was also used for the three Br atoms. Hence it was possible to use a mixture of basis sets and pseudo potentials. The file was submitted to the HPC server, giving the following data which again show that the optimisation completed as all variables converged, as discussed earlier. The data was again uploaded to 'D-space', and the output data are available using the following link: DOI:10042/21605 .
         Item               Value     Threshold  Converged?
 Maximum Force            0.000008     0.000450     YES
 RMS     Force            0.000005     0.000300     YES
 Maximum Displacement     0.000036     0.001800     YES
 RMS     Displacement     0.000023     0.001200     YES
 Predicted change in Energy=-4.027590D-10
 Optimization completed.
    -- Stationary point found.
The optimised molecule had the following properties:
| Calculation | Result |
|---|---|
| Calculation Method | RB3LYP |
| B-Br Bond Lengths /Å | 1.934 |
| Br-B-Br Bond Angles /° | 120.00 |
| Energy /au | -64.4364529 |
| Gradient | 0.00 |
| Dipole Moment /Debye | 0.00 |
| Point Group | D3h |
| Calculation Time /s | 18.1 |
Analysis of results
| Molecule | B-E Bond Length /Å |
|---|---|
| BH3 | 1.19 |
| BBr3 | 1.93 |
| TlBr3 | 2.65 |
From the table it can be seen that going from BH3 to BBr3 the B-E bond length increases from 1.191 Å to 1.934 Å, which is due to a change in ligand. Both H and Br are X type ligands, donating one electron each to the boron atom. Hydrogen is in period one of the periodic table, and boron in period two. This means that the 1s orbital on H is of similar size and energy to the sp2 orbital on boron, giving good size and energy overlap between the two atoms, resulting in a molecular orbital with low potential energy and hence a stronger, shorter bond. Bromine, however, is in period four. This means that its sp3 orbital which is used for bonding is much larger and more diffuse than the hydrogen atom's s orbital. Also, bromine is an electronegative atom meaning hence it's sp3 orbital is much lower in energy than the bonding atomic orbital of boron. The large size and energy mismatch of the atomic orbitals results in poor overlap of the atomic orbitals, giving a weaker, longer bond. On changing the central atom from B to Tl it can also be seen that the bond length increases from 1.934 Å to 2.651 Å respectively for the MBr3 complexes. This again can be seen to be due to energy and size mismatches of atomic orbitals. Both Tl and B are in group 3 of the periodic table, however boron is in period two and thallium in period seven. Going down a group the atomic radius of M becomes larger, hence its orbitals become larger and more diffuse. This leads to poorer overlap of the atomic orbitals of Tl with the atomic orbitals of bromine compared to the overlap with boron, due to greater size and energy mismatch. This leads to longer, weaker bonds in TlBr3 than in BBr3.
From the optimisation of BH3 it could be seen that two of the structures of the optimisation steps did not contain bonds, whereas the second two did. This may be due to Gaussview being programmed to only set to draw in a bond at a certain bond distance, or when a certain bond energy has been reached. Guassview is software programmed by humans and so can only model to the accuracy and detail of the information with which it is programmed, which is limited by our understanding of how electrons interact and, essentially, bonds. It is therefore probable that there is actually some interaction between the atomic orbitals of each atom in the molecular configurations with no 'visual' bond, however the software is not programmed to include this due to the bond exceeding a certain length.
It is difficult to define what a bond actually is, but it could be said that a bond is an interaction between two electrons from two atoms to form a molecule with an overall lower energy, and is therefore favoured over individual atoms in space. Bonding can be described in this valence bond way, where two electrons are shared between two atoms to give a two centre - two electron bond, and this approach is useful in organic chemistry, where arrow pushing, which shows movement of electron pairs, is used to propose reaction mechanisms and rationalise reactivity. However, this approach suggests that the electron density sits between only these two atoms, and that bonds show areas of highly localised electron density. Downfalls in this approach can be seen when describing, for example, the bonding in benzene, where 6 π electrons are spread over the plane of the ring and hence the electrons are delocalised, and also diborane (B2H6), the dimer of the highly unstable BH3 molecule which forms due to the high electron deficiency of the boron atom. Here two electrons are spread over three atoms in the bridging B-H-B bonds as there are insufficient electrons to form two centre - two electron bonds, also showing delocalisation of electrons over molecules and the need for a more sophisticated method. Here molecular orbital theory proves useful, where bonding orbitals generated from the linear combination of atomic orbitals which describe areas where electron pairs are most likely to exist are shown. These can be more delocalised and the contribution of each atom to the bonding and antibonding orbitals can be predicted based on electronegativity trends. The surface represents the area where the electrons exist 95% of the time, which is a much more accurate description than having to define where a bond would end; as bonds have different lengths depending on how strong they are it this would be very difficult to define. Hence bonds are a concept invented by humans to rationalise and simplify structure of molecules, represent successful interactions of electrons between atoms and rationalise reactivity in reaction mechanisms, but more sophisticated ways to represent 'bonding' do exist which can be used for more complex explanations of bonding and delocalisation.
Vibrational Analysis
Vibrational analysis can also be used to ensure that an energy minimum has been found in the potential energy surface of the molecule; frequency analysis is done by finding the second derivative of the potential energy surface. If this value is positive an energy minimum has been found. Hence all of the values in the following vibrational analysis must be positive otherwise the optimisation has not been successful. The frequency analysis also allows the different vibrational modes of a molecule to be analysed and the infrared spectrum of the molecule to be predicted.
BH3
The frequency analysis of BH3 was ran using the 6-31G(d,p) optimised molecule's .log output file. First a calculation was ran under the 'frequency' job type and the calculation submitted to Gaussian. However, the output file did not have 'low frequencies' in the range of ±15 cm-1 about 0 cm-1, hence the calculation parameters had to be modified. Now the job type 'opt + freq' was chosen and the 'use tight convergence criteria' text box was ticked. In the additional keywords box the words integral=grid=ultrafine were written; this kept tight constraints on the molecule's symmetry during the calculation. The calculation gave the following .log file. The molecule had the same properties as the earlier optimised BH3 molecule, as this was the file used to perform the calculation, hence giving the following output:
| Calculation Operation | Result |
|---|---|
| Calculation Type | FREQ |
| Calculation Method | RB3LYP |
| Basis Set | 6-31G(d,p) |
| B-H Bond Length /Å | 1.192 |
| H-B-H Bond Angle /° | 120 |
| Energy /au | -26.6153236 |
| Dipole Moment | 0.00 |
| Point Group | D3h |
| Calculation Time /s | 12.0 |
The following data shows that the output was fully optimised, as would be expected as a frequency operation was ran on a previously optimised molecule.
         Item               Value     Threshold  Converged?
 Maximum Force            0.000003     0.000015     YES
 RMS     Force            0.000002     0.000010     YES
 Maximum Displacement     0.000013     0.000060     YES
 RMS     Displacement     0.000008     0.000040     YES
 Predicted change in Energy=-6.170060D-11
 Optimization completed.
    -- Stationary point found.
The following data shows the 'low frequency' vibrations, which are seen to be within ±15 cm-1 of zero as required, and show the vibrations of the molecules centre of mass. The second line of low frequencies are all positive, showing that these are at the minimum of a potential energy surface as discussed in the introduction of the section, further confirming that the optimisation process was succesful.
Low frequencies ---   -7.0794   -7.0439   -0.0279    0.0007    0.7084    6.6303
 Low frequencies --- 1163.0023 1213.1577 1213.1579
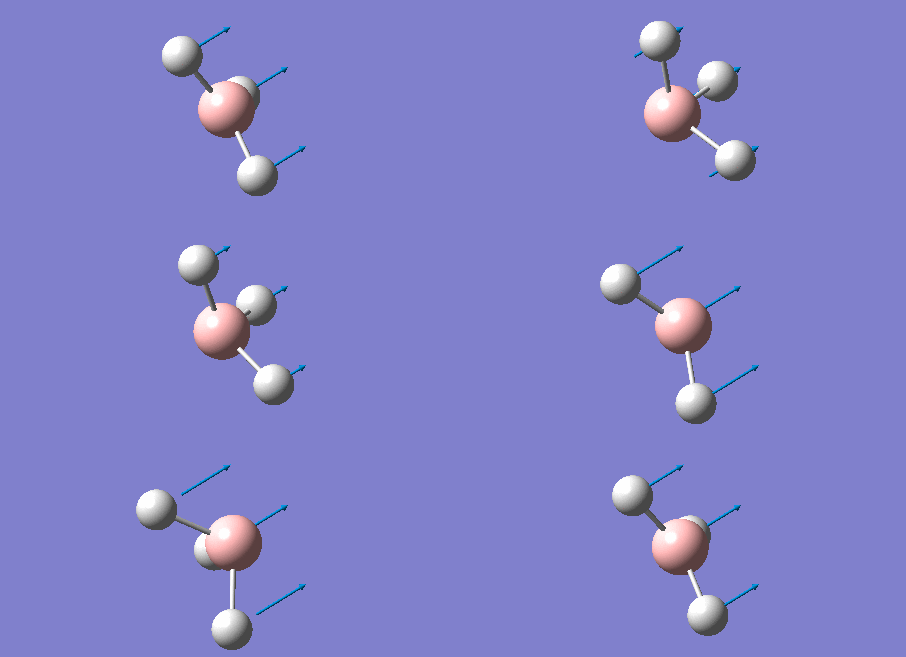
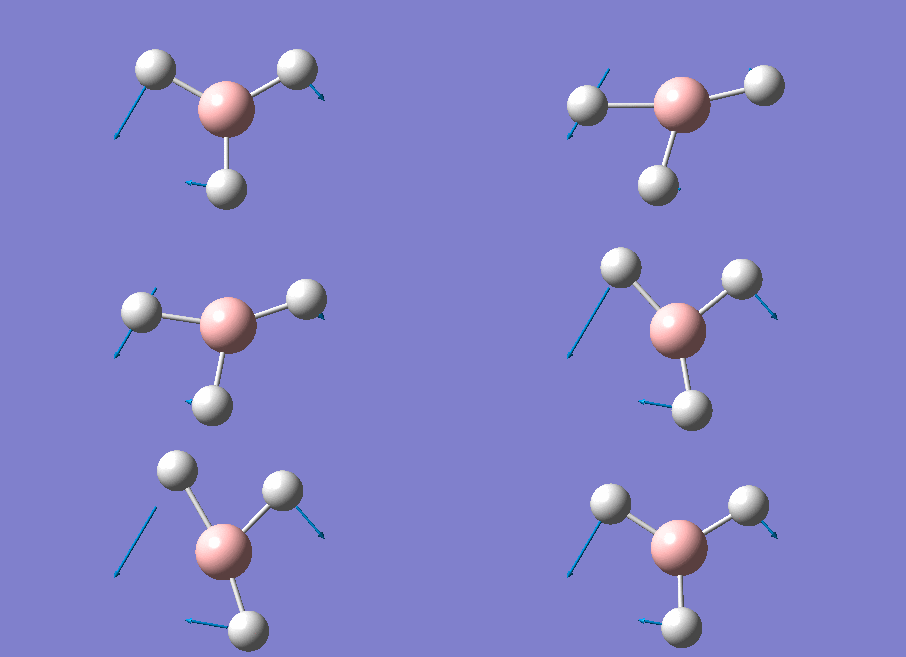
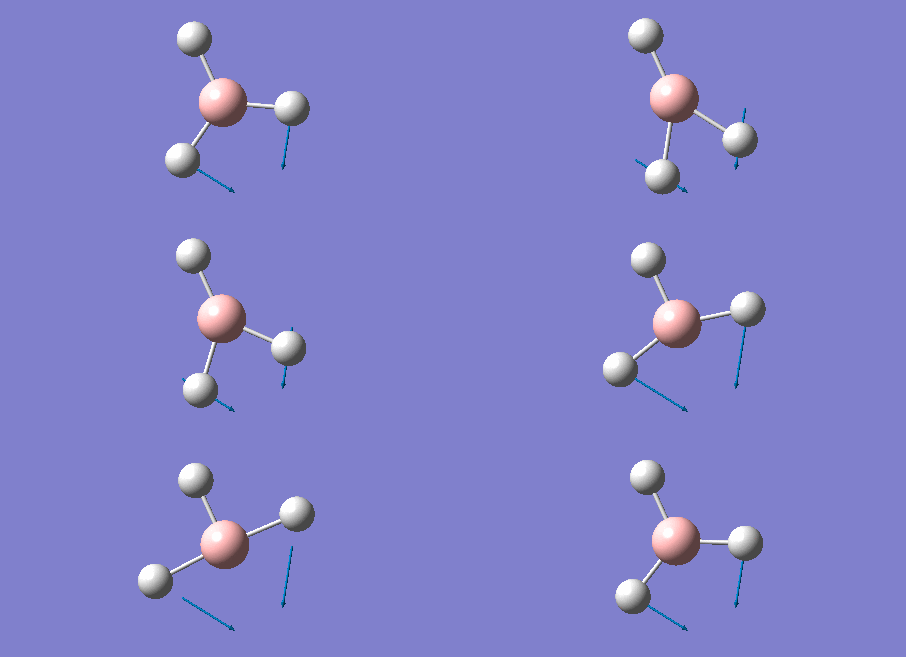
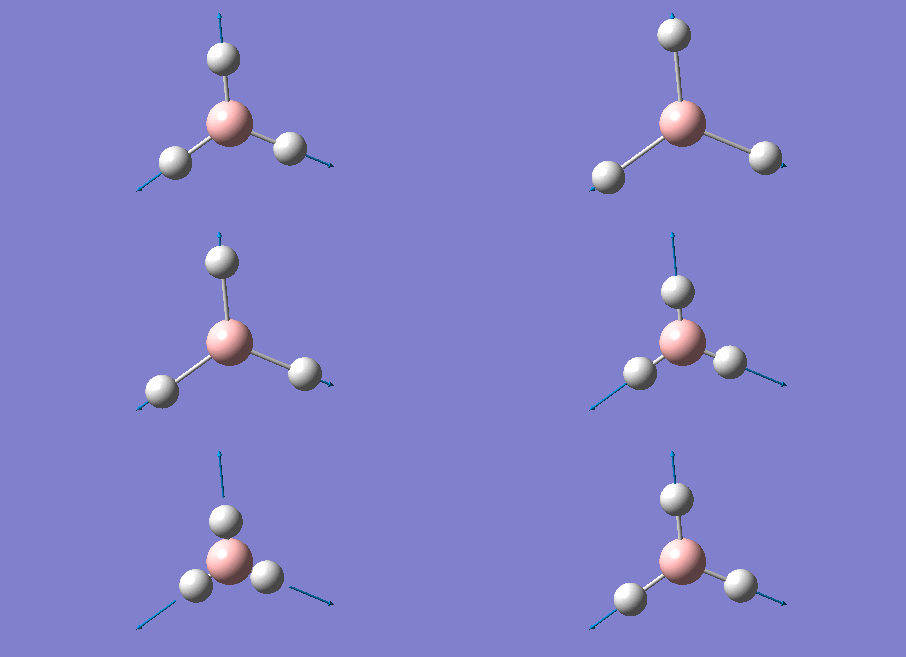
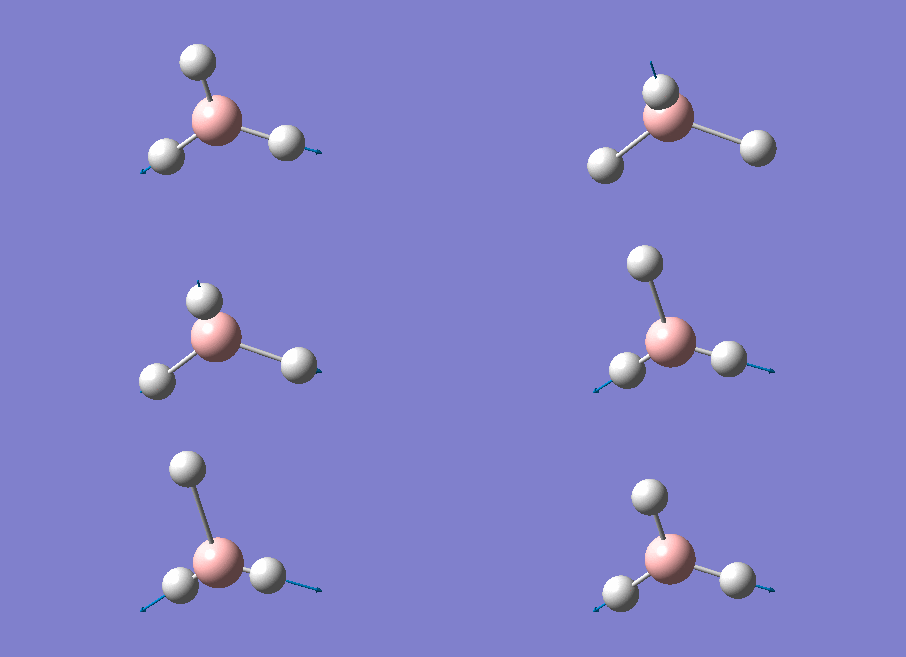
The frequency calculation gave out the infrared spectrum prediction shown on the right. It can be seen that despite there being six individual vibrational frequencies there are only three peaks visible on the spectrum. This is because vibration number 4 in the table is IR inactive. The stretch has A1 symmetry and is totally symmetrical, hence experiences no change in dipole moment when it vibrates and therefore is inactive. The other two 'absent' stretches are due to vibrations 1 and 3 and vibrations 5 and 6 occurring at the same vibrational frequencies; 1213 cm-1 and 2716 cm-1 respectively. This due to the degeneracy of the two stretches due to the E' symmetry label. Hence the vibrational frequencies are the same resulting in just one stretch, meaning overall there are only three stretches present.

From the infrared spectrum on the right it can be seen that one of the peaks occurs at a much higher vibrational frequency than the other two; 2716 cm-1 is much higher than 1213 cm-1 and 1163 cm-1. The peak at the higher frequency is because the molecule undergoes a stretch at this frequency, resulting in a large change in dipole moment giving a higher energy stretch. The other two peaks are due to bending motions, which result in smaller changes in dipole moment of the molecule and are therefore of lower energy.
TlBr3 frequency calculation
Frequency analysis of TlBr3 was carried out in the same way as for BH3; the job type was set to 'opt + freq', the 'use tight convergence criteria' box was ticked and in the additional keywords box 'integral=grid=ultrafine' was written. The job was submitted to D space and the output can be accessed from the following link DOI:10042/21657 .
The calculation gave the following frequency output which shows that the optimisation was successful; the first row of low frequencies are in a small range about zero and the second row of frequencies are all positive, showing that the molecule is at an energy minimum on the potential energy surface.
Low frequencies ---   -0.0012   -0.0006   -0.0001    1.8732    2.6583    2.6583
 Low frequencies ---   46.6999   46.7000   51.9500
The following output list also shows that the molecule was fully optimised.
Item               Value     Threshold  Converged?
 Maximum Force            0.000000     0.000015     YES
 RMS     Force            0.000000     0.000010     YES
 Maximum Displacement     0.000000     0.000060     YES
 RMS     Displacement     0.000000     0.000040     YES
 Predicted change in Energy=-4.041682D-16
 Optimization completed.
    -- Stationary point found.
The following table lists the predicted vibrational frequencies of the molecule
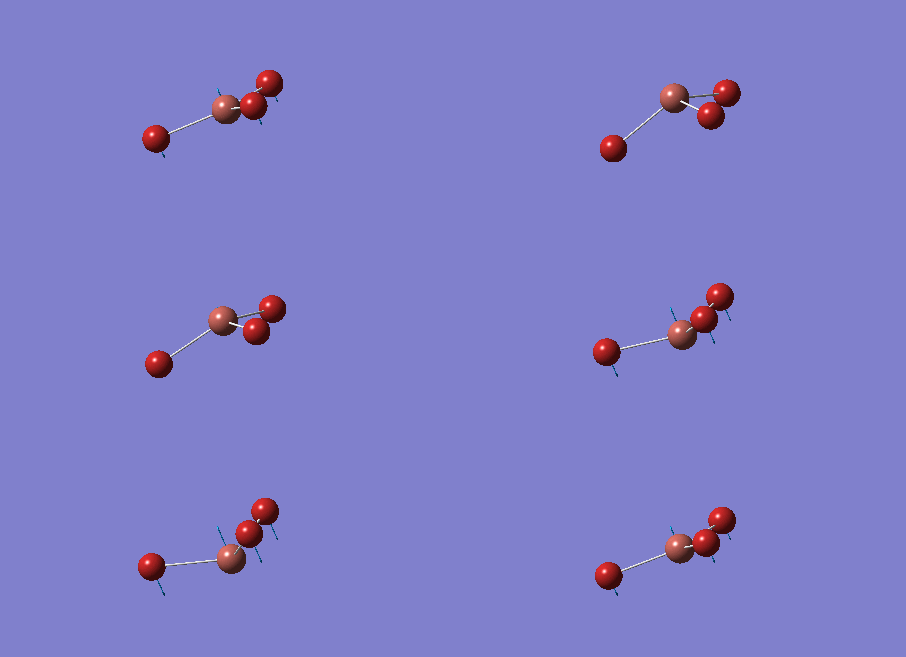
The data gave the infrared spectrum on the right. Again less peaks were present in the IR spectrum than were predicted in the calculated data; the stretch at 165 cm-1 is totally symmetrical experiencing no change in dipole moment and hence is infrared inactive and again there are two degenerate vibrational modes at 47 cm-1 and 211 cm-1. However, as the peaks at 47 and 52 cm-1 are very close together there is some overlap in the spectrum, hence there appears to be only two peaks in the infrared spectrum rather than three.

| BH3 Frequency /cm-1 | Intensity | Symmetry label | TlBr3 Frequency | Intensity | Symmetry Label |
|---|---|---|---|---|---|
| 1163 | 93 | A"2 | 47 | 4 | E' |
| 1213 | 14 | E' | 47 | 4 | E' |
| 1213 | 14 | E' | 52 | 6 | A"2 |
| 2582 | 0 | A'1 | 165 | 0 | A"2 |
| 2716 | 126 | E' | 221 | 25 | E' |
| 2716 | 126 | E' | 221 | 25 | E' |
It can be seen that there is a large difference in frequency values for the two molcules, the BH3 having much larger values than TlBr3. This is due to two different factors, as vibrational frequencies depend on bond strengths and the reduced mass of the atoms constituting the bond. Modelling the vibrations as harmonic, as is done by Gaussian in these calculations, the vibrational frequency can be calculated from the equation ν = (1/2π).(k/μ)1/2, where k is the force constant of the bond and μ the reduced mass of the two atoms, for example of B and H.
Firstly, the B-H bonds are stronger than the Tl-Br bonds as discussed earlier, due to better size and energy match of the constituent atomic orbitals for B and H than for Tl and Br. The force constant, k, is proportional to bond strength, hence the stronger bonds have a greater k, and as this is proportional frequency the vibrational frequencies for BH3 are greater than for TlBr3. Also the Tl-Br bond has a greater reduced mass than the B-H bond as both of the atoms are heavier. As vibrational frequency is proportional to 1/μ this means that the heavier molecular has lower vibrational frequencies, rationalising the data above.
The two spectra are similar in that both have only three individual peaks, although two of those for TlBr3 overlap one another. This is because the molecules essentially have stretches with the same symmetry labels; both contain two doubly denegerate E' stretches, giving only two peaks in the spectra, a totally symmetrical A'1 stretch which is IR inactive and an A"2 bend which is infrared active, giving three peaks in each spectrum overall. Only one of the vibrational modes has been re-ordered, being the A"2 wagging of the H/Br atoms on there respective molecules which is the third lowest energy mode for BH3 and the lowest energy mode of TlBr3, hence the wagging motion requires more energy to occur for the latter, potentially due to the mass of the Br atoms.
Again it can be seen that all of the stretching modes (A'1 and E') are at a much higher frequency than the bending modes (A"2 and E'); this is due to the fact that it takes much more energy for a bond to stretch than it does to bend, hence the vibration energy is greater. For both spectra it can also be seen that the most intense peak is due to a doubly degenerate asymmetric stretch. This can be rationalised by the fact that a stretch causes a greater change in dipole moment of the molecule than a bend does, hence the dipole moment is distorted to a greater extent which is more prominent in the vibrational spectrum.
As discussed earlier it was essential that the same method and basis sets were used for comparison of optimisation and frequency analysis of any molecule. This is because the basis sets describe the different functions used to carry out the calculations, with a more complex basis set including a greater number of functions. Hence if two different basis sets are used, two different functions have been used to describe the electronic structure of the molecules, and comparisons cannot be made as they are essentially working on different models.
Molecular orbital analysis of BH3
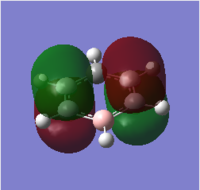
It is possible to generate the MOs of a molecule using the Gaussian software, and the calculated data can then be compared with that derived from LCAO (linear combination of atomic orbitals). In order to generate the MOs of BH3 the .chk file of the optimised molecule was opened. A calculation was then set up, running the job type as 'energy', selecting 'Full NBO' in the NBO tab and writing the words 'pop=full' in the additional keywords section. The reaction was then submitted to the HPC, and the output files can be found on the following DOI:10042/21677 . The .fchk file was downloaded from the HPC and the MOs visualised to give the molecular orbitals. As eight atomic orbitals were combined, the 1s, 2s and the three 2p orbitals from boron and the three molecular orbitals from the 'H3' fragment with symmetry labels a'1 and e', eight molecular orbitals from the combination of these were expected and could be visualised; four bonding and four antibonding with the eight electrons filling the four lowest energy orbitals. The energies of these eight orbitals are as follows:
| Orbital Symmetry | Bonding or antibonding | Energy /au |
|---|---|---|
| 1a'1 | Bonding | -6.77140 |
| 2a'1 | Bonding | -0.51254 |
| 1e' | Bonding | -0.35079 |
| 1e' | Bonding | -0.35079 |
| 1a"2 | Non-bonding | -0.06605 |
| 3a'1 | Antibonding | 0.16839 |
| 2e' | Antibonding | 0.17929 |
| 2e' | Antibonding | 0.17929 |
The expected and calculated MOs can be compared, as in the image on the right
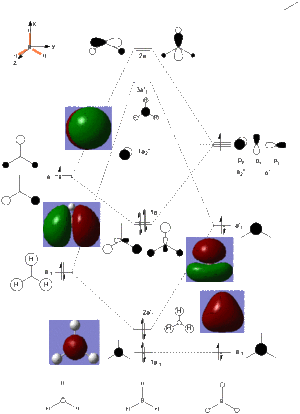
. Only the occupied orbitals and the LUMO from the calculation have been included on the diagram; this is because Hartree-Fock theory, and hence the calculation used, only concentrates on calculating the energy of occupied orbitals accurately, giving unoccupied antibonding orbitals with slight deviations from the expected shape in that they are more diffuse. From the data in the table it can be seen that the 1a'1 orbital is much lower in energy than all of the other orbitals by over 6 au and takes the form of a 1s orbital. This explains why boron's 1s orbital is not involved in forming molecular orbitals in the LCAO (as seen in the diagram on the right), and why core orbitals are generally excluded from MO diagrams, as they are too low in energy to interact with other orbitals.
The similarities between the expected and calculated data are evident in that the calculated MOs take very similar shape to the expected MOs. This shows that qualitative MO theory is a very good model and is useful to give an idea of the shape which the molecular orbitals take, showing that this method is a much more useful than methods such as VSEPR at predicting where the electron density truly lies on a molecule, and is much more advanced than simply drawing bonds between atoms. The consideration of electronegativity of the constituent atomic orbitals in order to predict the contribution of each orbital to the molecular orbital also proves effective in modelling the distortion away from simply combining the shapes of the atomic orbitals evenly, as is evident in the shapes of the calculated orbitals.
NH3 optimisation
The next calculation made was the optimisation of the NH3 molecule, so that analysis of the NBOs could be performed. Due to the small size of the molecule it was possible to perform the calculation using the more complex 6-31G(d,p) basis set immediately. The calcuation type chosen was 'optimisation' and the method chosen was B3LYP. The 'nosymm' keyword was added to the additional keywords bar. This gave a molecule with the properties in the table and the following .log file. The 'item' table shows that the forces and displacements fully converged, hence the optimisation went to completion.
| Calculation Type | Result |
|---|---|
| Bond Length /Å | 1.02 |
| H-N-H Bond Angle /° | 105.7 |
| Calculation Type | FOPT |
| Calculation Method | RB3LYP |
| Basis Set | 6-31G(d,p) |
| Energy /au | -56.5577686 |
| Gradient | 0.00 |
| Dipole Moment /Debye | 1.8464 |
| Point Group | C1 |
| Calculation Time /s | 20.0 |
        Item               Value     Threshold  Converged?
 Maximum Force            0.000024     0.000450     YES
 RMS     Force            0.000012     0.000300     YES
 Maximum Displacement     0.000079     0.001800     YES
 RMS     Displacement     0.000053     0.001200     YES
 Predicted change in Energy=-1.629727D-09
 Optimization completed.
    -- Stationary point found.
A frequency calculation was then ran on the optimised molecule by setting the job type as 'frequency' and submitting the calculation to Guassian. From the summary of results it could be seen that the energy of the optimised molecule in the table above and the energy of NH3 after the frequency calculation were the same, hence the calculation was run on the same molecule. From the following output data it can be seen that the low frequencies did not have a range of 15 cm-1 hence more restrictions had to be made on the calculation.
Low frequencies ---  -30.7400   -0.0004   -0.0003    0.0009   20.3155   28.2746
 Low frequencies --- 1089.5571 1694.1242 1694.1868
As with the BH3 frequency calculation the calculation type was changed to 'opt + freq' and the 'use tight convergence criteria' box was ticked. In the additional keywords section the words 'integral=grid=ultrafine' were typed and the calculation performed. The output gave the following .log file, and now it can be seen that the low frequencies had a range of less than 30 cm-1 around 0 cm-1 as required. The positive vibrational frequencies in the second line show that the energy of the molecule was at a minimum and hence fully optimised as this is a positive second derivative.
Low frequencies ---   -9.3057   -8.1791   -6.2408   -0.0011   -0.0010    0.0005
 Low frequencies --- 1089.3363 1693.9210 1693.9247
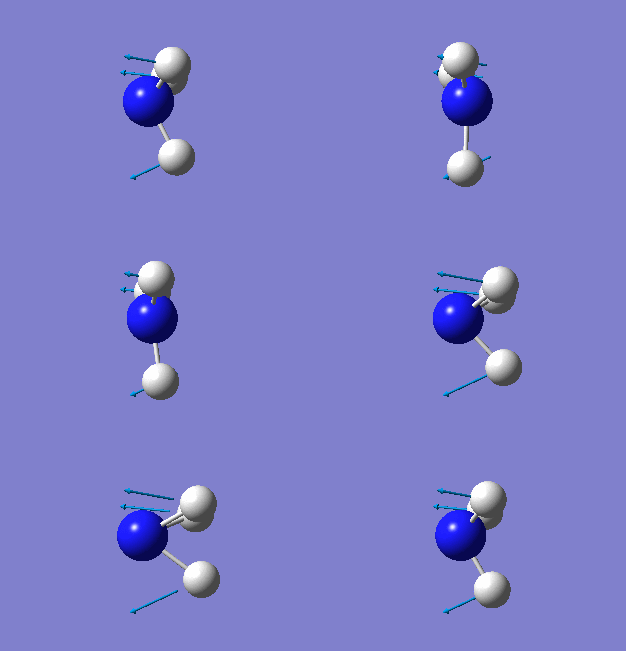
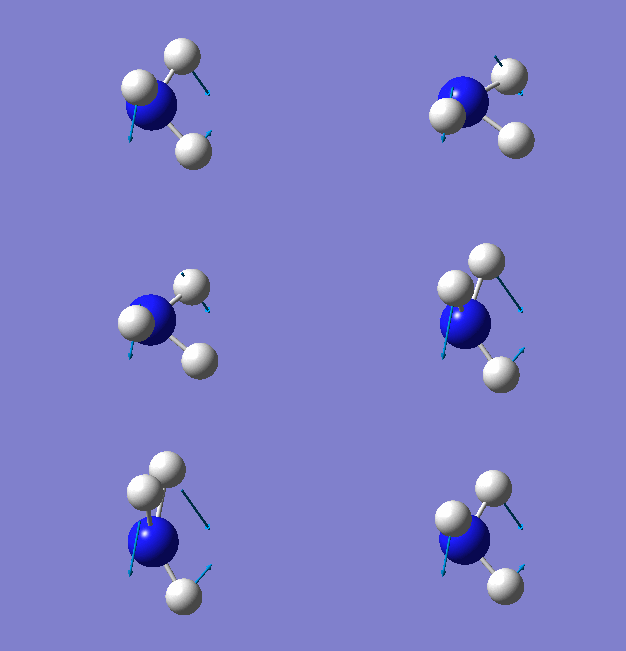
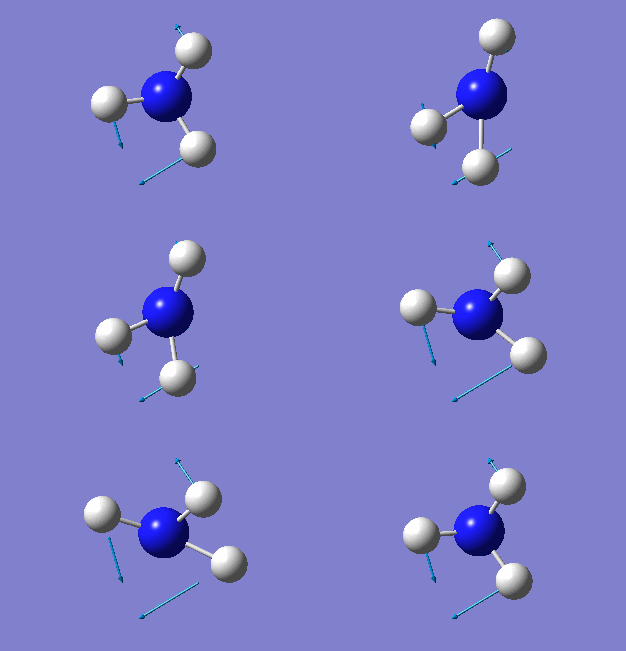
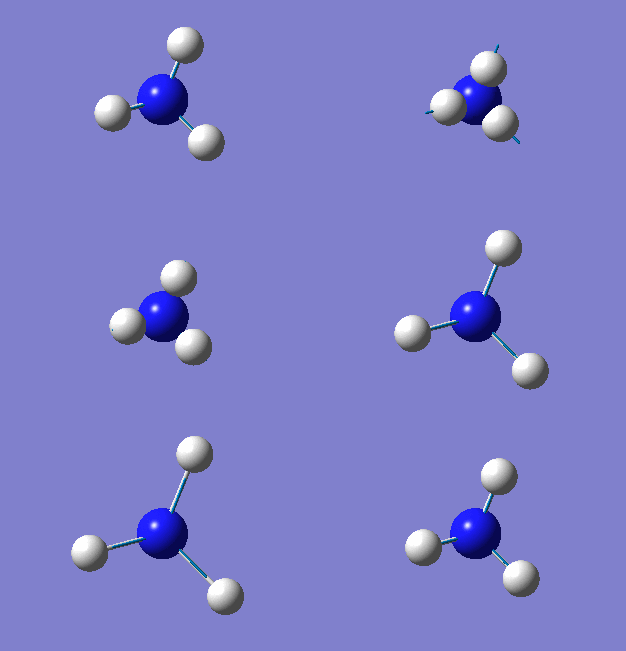
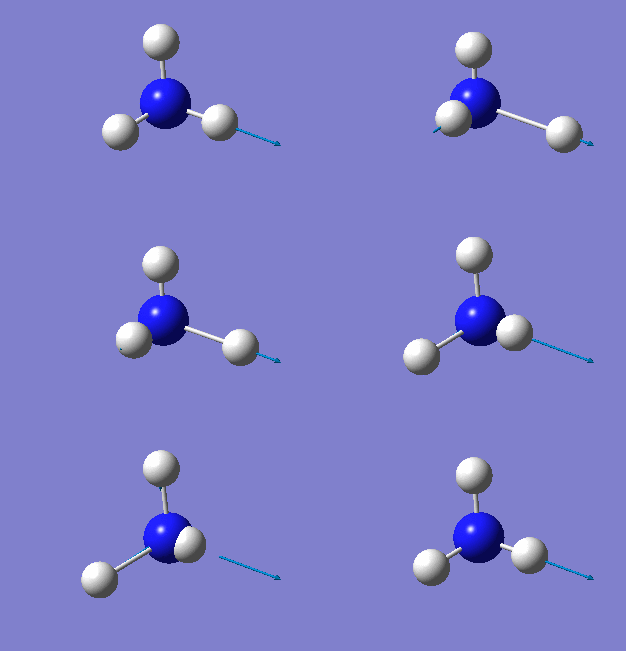
The molecule again had six vibrational frequencies:
The vibrations gave the following infrared spectrum
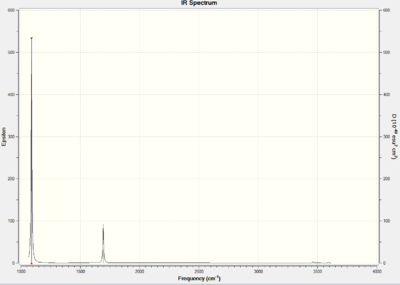
It can be seen that the three stretches which are predicted at higher frequencies are not present as peaks on the infrared spectrum. This is because the dipole moment created on stretching of each N-H bond is counteracted by the other two N-H bonds, leading to overall no change in dipole moment for all three stretches hence intensities of zero or very close to zero. The two bending motions at 1694 cm-1 are degenerate, hence resulting in just one peak and the most prominant peak at 1089ncm-1 is due to the wagging of all three H atoms in and out of the plane, giving the greatest overall change in dipole moment of the molecule, leading to its large intensity.
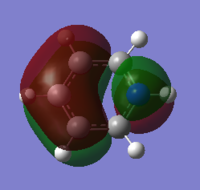
The MOs for the NH3 molecule were then generated as with BH3. This was done by performing an energy calculation on the optimised NH3 molecule .chk file, selecting the option 'Full NBO' under the 'NBO' tag and using the keywords 'pop=full' in the additional keywords section of the calculation palette. This gave the following log file. However the .chk file had to be opened to visualise the MOs.
NBO analysis of NH3
It was then possible to carry out a Natural Bond Order (NBO) analysis of the optimised NH3 molecule, using the log file from the molecular orbital calculation. This can be analysed in two ways; first the distribution of charge across the molecule will be visualised an quantitatively recorded and secondly the actual .log file will be analysed to find out the contribution of electrons from each atom to the N-H bonds and the hybridisation of each atom.
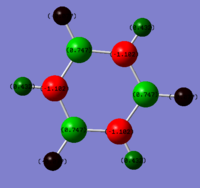
For the analysis of charge distribution the 'results' tab was selected and 'charge distribution' was selected from the drop down menu. The NBO analysis was selected, and the 'colour atoms by charge' tick box ticked. This gave the image on the right, with the charges in the range of -1.125 to 1.125. The bright green areas show areas of high positive charge and the bright red areas those of high negative charge. The fact that the nitrogen atom is red makes sense as nitrogen is highly electronegative, and the hydrogen atoms are therefore partially positively charged.
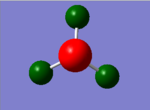
The 'show numbers' tick box was then selected in the 'show charge distribution' palette. This numbered the nitrogen atom -1.125 and the three H atoms 0.375. This sums to one, hence the charge distribution is balanced and the molecule is neutral overall. The very negative charge coefficient for nitrogen highlights its high electronegativity, and the positive numbers for hydrogen confirm that they have partial positive charges. A summary of this information follows under the 'natural charge' column which is taken from the .log output file.
Summary of Natural Population Analysis:

                                       Natural Population
                Natural  -----------------------------------------------
    Atom  No    Charge         Core      Valence    Rydberg      Total
 -----------------------------------------------------------------------
      N    1   -1.12514      1.99982     6.11103    0.01429     8.12514
      H    2    0.37505      0.00000     0.62250    0.00246     0.62495
      H    3    0.37505      0.00000     0.62250    0.00246     0.62495
      H    4    0.37505      0.00000     0.62250    0.00246     0.62495
 =======================================================================
   * Total *    0.00000      1.99982     7.97852    0.02166    10.00000
From the .log file information about the contribution of each atom to the N-H bond and its hybridisation can be obtained. The information is summarised in the following table:
| Bond Orbital | Coefficient | Coefficient (as percentage) | Hybridisation |
|---|---|---|---|
| N-H(2) | 0.83 : 0.56 | N(69%) : H(31%) | s(25%)p(75%) : s(100%) |
| N-H(3) | 0.83 : 0.56 | N(69%) : H(31%) | s(25%)p(75%) : s(100%) |
| N-H(4) | 0.83 : 0.56 | N(69%) : H(31%) | s(25%)p(75%) : s(100%) |
| N core electrons | - | - | s(100%) |
| N lone pair | - | - | s(25%)p(75%) |
The data above shows nitrogen's 1s orbital is not involved in bonding, as it does not have a bond coefficient value, confirming that it is too low in energy to interact with the hydrogen orbitals. It also shows that nitrogen has a greater contribution to the bonding orbital; this can be rationalised by the fact that nitrogen is more electronegative than the H3 fragment molecule hence its p atomic orbitals are lower in energy and therefore have a greater contribution to the bonding molecular orbitals. The data shows that the nitrogen is sp3 hybridised, with three of it's orbitals bonding to the s H orbitals and the fourth occupied by a lone pair of electrons. The following data shows that each of the N-H bonding orbitals contained two electrons, as did nitrogen's 1s orbital and lone pair. Also, the core orbital can be seen to have a much lower energy (-14.2 au) than the N-H bonds (-0.6 au) and the lone pair (-0.3 au), showing that this orbital is too low in energy to overlap successfully with the H 1s orbitals and hence is not involved in bonding. The lone pair has the highest energy of all of the molecular orbitals, showing why why nitrogen has basic character; it is able to donate these high energy electrons to an empty orbital, for example BH3's empty p orbital, in order to lower the overall energy of the system and stabilise both molecules.
 Natural Bond Orbitals (Summary):

  <pre>                                                          Principal Delocalizations
           NBO                        Occupancy    Energy   (geminal,vicinal,remote)
 ====================================================================================
 Molecular unit  1  (H3N)
     1. BD (   1) N   1 - H   2          1.99909    -0.60417
     2. BD (   1) N   1 - H   3          1.99909    -0.60417
     3. BD (   1) N   1 - H   4          1.99909    -0.60417
     4. CR (   1) N   1                  1.99982   -14.16767
     5. LP (   1) N   1                  1.99721    -0.31757
NH3BH3
Ammonia-borane is an important molecule as it is being studied as a way to store H2 which a very important potential fuel. In the next section the association energy of the B-N bond will be estimated by looking at the energy difference of the ammonia-borane product compared to the two reactants, ammonia and borane. As the energy of the reactants has already been calculated in the above section, both using the 6-31G(d,p) basis set, only the energy of the product had to be calculated using the optimisation job type. It was important that the same basis set, the 6-31G(d,p) set, was used so that the results could all be compared.
The calculation was ran using the job type 'optimisation'. The method was set to B3LYP and the basis set to 6-31G(d,p). The optimisation was then ran using Gaussian, giving the following output file. The table below summarises the properties of the optimised molecule.
| Calculation Type | Result |
|---|---|
| N-H Bond Length /Å | 1.02 |
| B-H Bond Length /Å | 1.21 |
| B-N Bond Length /Å | 1.67 |
| H-N-H Bond Angle /° | 107.9 |
| H-B-H Bond Angle /° | 113.9 |
| Energy /au | -83.2246891 |
| Dipole Moment /Debye | 5.5654 |
| Point Group | C1 |
| Calculation Time /s | 84.0 |
The following table shows that the optimisation went to completion as the forces and displacements all converged.
Item               Value     Threshold  Converged?
 Maximum Force            0.000137     0.000450     YES
 RMS     Force            0.000063     0.000300     YES
 Maximum Displacement     0.000606     0.001800     YES
 RMS     Displacement     0.000336     0.001200     YES
 Predicted change in Energy=-1.994009D-07
 Optimization completed.
    -- Stationary point found.
A frequency calculation was then carried out, however again the frequencies were not in the required range so the 'opt+freq' job type had to be chosen again. This was done by ticking the 'use tight convergence criteria' tick box and entering the keywords 'integral=grid=ultrafine' in the additional keywords section. The job was submitted to Guassian and took 159 seconds to complete, giving the following output data.
The following data shows that the low frequencies were within ± 15 cm-1 of 0 cm-1 hence within the required range for the vibrations of the reduced mass of the nuclei. The positive values of the final three frequencies show that an energy minimum was found for the potential energy of the molecule, as these are the second derivative of the energy surface, and the positive values show that they describe an energy minimum.
Low frequencies ---   -4.8605   -1.7034   -0.0007   -0.0005    0.0014    2.3409
 Low frequencies ---  263.3964  632.8924  638.4023
Using the energy obtained from this calculation and those obtained from the BH3 and NH3 it was possible to calculate the association energy of the B-N bond, using the equation ΔE=E(NH3BH3)-[E(NH3)+E(BH3)]. The energies of the reactants and product are in the following table.
| Molecule | Energy |
|---|---|
| BH3 /au | -26.6153225 |
| NH3 /au | -56.5577686 |
| BH3NH3 /au | -83.2246891 |
ΔE = -83.2246891-(-56.5577686 - 26.6153225) = -0.0515955 a.u. = -135.78 kJmol-1
The energy difference between the reactants and products corresponds to the dissociation energy of the B-N bond in the molecule, giving a value of ΔH = -135.8 kJmol-1. As this is a sigma bond energy it would be expected to be between around 100-300 kJmol-1, hence the bond enthalpy is on the order of magnitude expected.
A literature experimental value for the bond dissociation energy was found to be 119.2 kJmol-1[4], which is smaller than the calculated value. This is due to the approximations made in modelling the molecule; the basis set may not have had enough functions included to model the molecule accurately. There are also errors in the mathematical results given by Gaussian, and by combining the errors of different molecules even greater errors are obtained in the results. Guassian has a very large error of around 10 kJmol-1 on energy calculations, hence taking this into consideration the lower limit of the calculated value would be 130.8 kJmol-1 which is closer to the experimental value.
Aromaticity
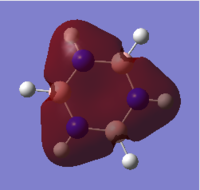
This section will explore aromaticity over a range of molecules, using benzene as a template molecule. A C-H unit from benzene will be replaced with first a [B-H]- unit and then a [N-H]+ unit to create the isoelectronic boratabenzene and pyridinium molecules respectively. The MOs of each molecule will be generated, and NBO analysis carried out, and the results for all three molecules compared. All calculations will be run using the 6-31G(d,p) basis set in order that the comparisons can be made. The borazine molecule, which is also isoelectronic to benzene, will then be modelled, and again an MO and NBO analysis will be carried out. All calculations will be carried out on the HPC due to the complexity of the calculations.
Benzene
A benzene molecule was generated using the GaussView interface. The optimisation and frequency calculations were ran at the same by using the 'opt + freq' job type. The calculation method was set to B3LYP and the 6-31G(d,p) basis set was used to give a good model of the core electrons. For the frequency part of the calculation extra parameters were defined; under the 'job type' tab the 'use tight convergence criteria' box was ticked and the additional keywords 'integral=grid=ultrafine' were added. The calculation was ran through the HPC system and published to D space to give the following output files DOI:10042/21713 . The following table summarises some of the properties of the optimised molecule:
| Calculation Operation | Result |
|---|---|
| Calculation Type | FOPT |
| Calculation Method | RB3LYP |
| Basis Set | 6-31G(d,p) |
| C-H Bond Length /Å | 1.100 |
| C-C Bond Length /Å | 1.395 |
| C-C-C Bond Angle /° | 120.00 |
| Energy /au | -232.2575219 |
| Dipole Moment | 0.00 |
| Point Group | C1 |
| Calculation Time /s | 526.9 |
The results show that benzene's electrons are fully delocalised about the structure, as all C-C bonds are the same length, rather than having alternating C-C and C=C bonds. It can be seen that the calculation time for this time is much greater than for smaller molecules such as borane and ammonia. The following item data was retrieved from the .log output file. The fact that the forces and displacements all converged show that the molecule is at an energy minimum, hence the optimisation was successful and the lowest energy configuration of benzene was found using this basis set.
         Item               Value     Threshold  Converged?
 Maximum Force            0.000212     0.000450     YES
 RMS     Force            0.000085     0.000300     YES
 Maximum Displacement     0.000991     0.001800     YES
 RMS     Displacement     0.000315     0.001200     YES
 Predicted change in Energy=-5.157454D-07
 Optimization completed.
    -- Stationary point found.
The .log file also included the following information about the frequencies. The first six results were all within ±15 cm-1 of 0 cm-1 and the following three frequencies were all positive, reaffirming that the optimisation was successful; the positive second derivative shows that a potential energy minimum was reached.
Low frequencies ---   -5.5818   -5.0713   -0.0006    0.0004    0.0005    2.6715
 Low frequencies ---  414.5396  414.5430  621.0611
The following vibrational frequencies were predicted, which are also expressed in the infrared spectrum.

There are many more vibrational modes for benzene than there were for BH3 and TiBr3; there are many more bonds and hence more ways in which the molecule can stretch or bend. The majority of the vibrations were infrared inactive due to them not causing a change in dipole moment of the molecule, and of the seven modes which were active three of these were doubly degenerate, giving just four peaks in the infrared spectrum.
| Frequency /cm-1 | Intensity | Frequency /cm-1 | Intensity | Frequency /cm-1 | Intensity |
|---|---|---|---|---|---|
| 415 | 0 | 1013 | 0 | 1524 | 7 |
| 415 | 0 | 1018 | 0 | 1524 | 7 |
| 621 | 0 | 1020 | 0 | 1652 | 0 |
| 621 | 0 | 1066 | 3 | 1652 | 0 |
| 695 | 74 | 1066 | 3 | 3172 | 0 |
| 718 | 0 | 1180 | 0 | 3181 | 0 |
| 865 | 0 | 1203 | 0 | 3181 | 0 |
| 865 | 0 | 1203 | 0 | 3197 | 47 |
| 975 | 0 | 1355 | 0 | 3197 | 47 |
| 975 | 0 | 1381 | 0 | 3208 | 0 |
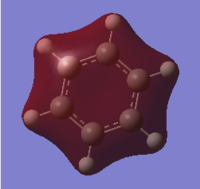
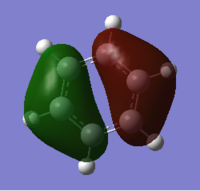
Molecular orbital analysis was then carried out using the .fchk file from the optimisation as a template. The calculation type was set to energy, the additional keywords 'pop=full' were added and the full NBO selected. The file was submitted to D space giving the following output files DOI:10042/21715 . From this twenty one filled bonding molecular orbitals were generated. The diagram on the right shows the predicted MO diagram of benzene and the corresponding orbitals generated by the Gaussian software
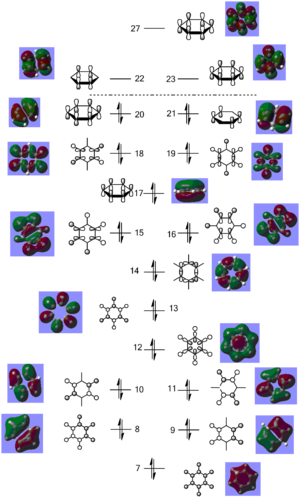
. The first six orbitals contained the core (1s) orbitals of the carbon atoms and were not involved in bonding due to their low energy; they were therefore not included on the MO diagram. Of the remaining filled orbitals three had π-type symmetry; the two degenerate HOMO orbitals and the HOMO-3 orbital. The rest had σ-type symmetry, experiencing no change of phase on 180° rotation. Orbitals 7 - 11 were due to bonding between the carbon 2s orbitals and the H 1s orbitals. Orbital 7 had a fully bonding combination, the degenerate orbitals 8 and 9 had two nodes (one nodal plane) and the degenerate 10 and 11 had four nodes (two nodal planes), hence moving up the orbital diagram there is an increase in antibonding character giving an increase in orbital energy and decrease in orbital stability moving up the diagram. Orbitals 12 to 21 now involved carbon's 2p orbitals. Of these, orbitals 17, 20 and 21 had π-type interactions solely between the carbon atoms. As these were through space rather than head on p-p orbital interactions the orbitals came relatively high in energy in the bonding region of the molecule, hence forming the two HOMO and the HOMO-3 orbitals. Orbital 17 had fully in phase interactions, and the degenerate HOMOs each had two nodes (one nodal plane), further increasing it's energy. The rest of the bonding orbitals were due to overlap between the H 1s orbitals and and the C 2p orbitals, ranging from a full set of head on interactions in orbital 12, to a full set of through space interactions in orbital 18, with a mixture of the two in the rest of the orbitals. Again an increase in the number of nodes was experienced moving up the energy diagram, and the increase in antibonding character in the orbitals explains why their energy increases.
The three lowest energy π antibonding orbitals were the LUMO and the LUMO + 4. The combination of through space p-p interactions and many nodes (four for the LUMO and six for the LUMO + 4) explains why these orbitals were so high in energy and therefore not used in bonding. The simulated benzene orbitals show that the molecule is delocalised; in the three π-bonding orbitals the electron density is spread over the carbon atoms due to p-p interactions. However, the delocalisation is limited to only three of the twenty one bonding orbitals as the 6 π electrons can only sit in these three orbitals, with two electrons in each, limiting the delocalisation and potentially the aromaticity of the molecule. These orbitals contain 6 п electrons, corresponding to Huckel's rule of aromaticity (4n + 2 π electrons where n = 1), also confirming the aromaticity of the molecule.
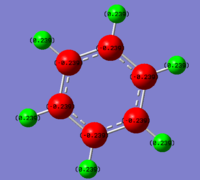
The .log file output from the MO analysis was then used for the NBO analysis. The results could be visualised on a pictorial interface by selecting 'results' and 'charge distribution'. Using the 'NBO' type of representation rather than 'Mulliken' to show charge by colour gave an image of benzene with all carbon atoms red, showing an area with slightly negative charge, and all hydrogen atoms green, showing atoms with slightly positive charge. The range of charges was from -0.239 to 0.239; all C atoms possessing the -0.239 charge and all H atoms 0.239. This relates to the relative electronegativites of the atoms, carbon being slightly more electronegative than hydrogen, therefore benzene favours a greater amount of electron density sitting on the carbon atoms rather than the hydrogen atoms. As all of the carbon atoms possessed the same charge density the electron density was spread evenly over the ring, as would be expected for this molecule.
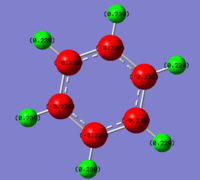
The following output comes directly from the .log file from the population analysis, with the 'Natural Charge' column summarising the pictorially expressed natural charges above. The 'core' column shows that each carbon atom has two electrons which are not involved in bonding (the 1s electrons) and the 'valence' column approximately shows that each carbon has four valence electrons and the hydrogen atoms one valence electron each, all of which are involved in bonding.
                                    Natural Population
                Natural  -----------------------------------------------
    Atom  No    Charge         Core      Valence    Rydberg      Total
 -----------------------------------------------------------------------
      C    1   -0.23852      1.99910     4.22611    0.01331     6.23852
      C    2   -0.23855      1.99910     4.22613    0.01331     6.23855
      C    3   -0.23854      1.99910     4.22613    0.01331     6.23854
      C    4   -0.23852      1.99910     4.22611    0.01331     6.23852
      C    5   -0.23855      1.99910     4.22613    0.01331     6.23855
      C    6   -0.23854      1.99910     4.22613    0.01331     6.23854
      H    7    0.23854      0.00000     0.76003    0.00144     0.76146
      H    8    0.23853      0.00000     0.76003    0.00144     0.76147
      H    9    0.23854      0.00000     0.76002    0.00144     0.76146
      H   10    0.23854      0.00000     0.76003    0.00144     0.76146
      H   11    0.23853      0.00000     0.76003    0.00144     0.76147
      H   12    0.23854      0.00000     0.76002    0.00144     0.76146
 =======================================================================
   * Total *    0.00000     11.99462    29.91690    0.08847    42.00000
Natural bond order analysis can also be used to determine the contribution of each atom to a two-centre-two-electron bond and the hybridisation of each atom. By summarising the .log outfile file the following data could be obtained:
| Bond Orbital | Coefficient | Coefficient (as percentage) | Hybridisation |
|---|---|---|---|
| C-C | 0.71 : 0.71 | C(50%) : C(50%) | s(35%)p(65%) : s(35%)p(65%) |
| C-C | 0.71 : 0.71 | C(50%) : C(50%) | p(100%) : p(100%) |
| C-H | 0.79 : 0.62 | C(62%) : H(38%) | s(30%)p(70%) : s(100%) |
Due to the high symmetry of the molecule and the even delocalisation of electrons only three different types of bonds are reported in the molecule. The first of which is the C-C bonds which form the ring (the first reported in the table). The data show that the carbon atoms are sp2 hybridised and each contribute 50% of the electron density to the C-C bond. Each carbon atom forms two of these bonds. The second is the C-C bond perpendicular to the ring where the remaining p orbitals on each carbon lie, and again each atom contributes 50% of the electron density to the bond. The third bond type is the C-H bond, where the remaining sp2 orbital on each carbon atom bonds with a 1s H orbital. Here carbon contributes 62% of the electron density to the bond and hydrogen 38%.
Boratabenzene
The isoelectronic boratabenzene molecule was then made by replacing one of benzene's C-H units with a [B-H]- unit. The charge was added while setting up the calculation, setting the charge to -1 and ensuring that the molecule was in the singlet state. The 'opt+freq' job was then carried out on the 6-31G(d,p) basis set, with the 'use tight convergence criteria' box ticked and adding the words 'integral=grid=ultrafine" to the additional keywords section. The job was submitted to the HPC system, giving the following results which were published to D space DOI:10042/21723 . The item list from the .log output below shows that the molecule was fully optimised, as the forces and displacements converged.
Item               Value     Threshold  Converged?
 Maximum Force            0.000010     0.000015     YES
 RMS     Force            0.000002     0.000010     YES
 Maximum Displacement     0.000039     0.000060     YES
 RMS     Displacement     0.000011     0.000040     YES
 Predicted change in Energy=-6.055705D-10
 Optimization completed.
    -- Stationary point found.
A summary of the properties of the optimised molecule is shown below:
| Calculation Operation | Result |
|---|---|
| Calculation Type | FREQ |
| Calculation Method | RB3LYP |
| Basis Set | 6-31G(d,p) |
| Charge | -1 |
| Spin | Singlet |
| C-H Bond Length /Å | 1.099 |
| C1-C2 Bond Length /Å | 1.399 |
| C2-C3 Bond Length /Å | 1.405 |
| B-H Bond Length /Å | 1.218 |
| B-C Bond Length /Å | 1.514 |
| C-B-C Bond Angle /° | 115.1 |
| Energy /au | -219.02052299 |
| Dipole Moment /Debye | 2.8456 |
| Point Group | C1 |
| Calculation Time /s | 521.5 |
The replacement of C-H with the B-H- unit had several effects on the molecule. The B-C bond length, 1.514 Å, was longer than the C-C bond length in benzene, 1.395 Å. This is due to the energy and orbital size mismatch of the bonding orbitals. In the C-C bond the sp2 hybridised atomic orbital forming the molecular orbitals are the same size and energy, giving very good overlap and forming a low energy molecular orbital, hence giving a shorter bond. When one of the C atoms is replaced by B the carbon atomic orbital is lower in energy than that of boron due to its slightly greater electronegativity, and as the boron atom is smaller it's sp2 orbital is smaller. The size and energy match is therefore poorer, forming a molecular orbital slightly higher in energy to give a longer, weaker bond. There is also a change in bond angles in the ring; the 120° C-C-C angle becomes a 115° C-B-C angle. This may be due to the boron atom having a smaller radius than the carbon atom and the B-H bond being longer than benzene's C-H bond length, reducing bond pair - bond pair repulsion in the molecule to give a more acute angle. There is a change in dipole moment from 0.00 Debye to 2.85 Debye, due to the differences in electronegativity of the C and B atoms which increases the polarity of the molecule. The boron atom may also have effected the aromaticity of the molecule; the electron density may not be evenly delocalised around the ring as it was in benzene, which can be seen in the NBO analysis later, due to differences of electronegativity of the atoms and the tendency for the electrons to sit on the more electronegative atoms. As aromaticity adds stability to the molecule this would have a destabilising effect, increasing the overall energy of the molecule.
The frequency analysis gave the following 'low frequencies', all of which were within the required range. The positive values of the second row of low frequencies confirm that the molecule was fully optimised.
Low frequencies ---   -7.2695   -0.0006   -0.0004    0.0005    3.1511    4.5209
 Low frequencies ---  371.2961  404.4161  565.0824
The following 30 vibrations were predicted for the optimised molecule:
| Frequency /cm-1 | Intensity | Frequency /cm-1 | Intensity | Frequency /cm-1 | Intensity |
|---|---|---|---|---|---|
| 371 | 2 | 917 | 1 | 1449 | 9 |
| 404 | 0 | 951 | 0 | 1463 | 14 |
| 565 | 0 | 951 | 0 | 1565 | 7 |
| 568 | 0 | 960 | 2 | 1592 | 40 |
| 608 | 11 | 1012 | 4 | 2447 | 368 |
| 711 | 3 | 1085 | 3 | 3027 | 108 |
| 756 | 7 | 1175 | 1 | 3030 | 0 |
| 815 | 0 | 1180 | 1 | 3060 | 380 |
| 873 | 28 | 1227 | 1 | 3061 | 10 |
| 906 | 0 | 1333 | 31 | 3116 | 112 |

Due to the dipole moment in the molecule there were more IR active stretches and bends in boratabenzene than there were for benzene; more of the addition of the electron deficient boron molecule meant that more of the stretches and bends would cause an overall change in dipole moment of the molecule, becoming infrared active. The vibrational frequencies occur at similar frequencies to those of benzene due to only a small change in the reduced mass of the molecule and the C-C/C-B bond lengths on replacement of one of the carbon atoms with boron, leads to only a small difference in vibration frequencies due to differences in force constant and reduced mass.
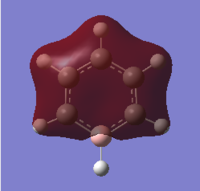
MO analysis was then carried out by selecting 'energy' as the job type and writing in the additional keywords section 'pop=full'. The job was submitted to the HPC system, which took 40.3 s, giving the following output files DOI:10042/22026 . The MO diagram was generated as with benzene and three of the molecular orbitals will be compared to benzene in the final section.
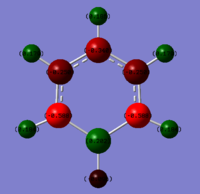
The NBO analysis was then carried out in the same way as for benzene; the .log file was downloaded from D space, the results tab was selected and using the 'NBO' model the charges were viewed by colour and number, with a range from -0.588 to 0.588, giving the data in the table below. Again the charge distribution will be discussed and compared to the other aromatic systems in detail in the final section.
| Atom | Charge Distribution |
|---|---|
| B | 0.202 |
| (B)-H | -0.096 |
| C1/C5 | -0.588 |
| C2/C4 | -0.250 |
| C3 | -0.340 |
| (C1/C5)-H | 0.184 |
| (C2/C4)-H | 0.179 |
| (C3)-H | 0.186 |
By opening the .log file and analysing it's content information about the hybridisation and the contribution to bonding of each atom could be found. The following table shows the readable output of the information in the table above, with the data under the 'natural charge' column showing the charge distribution around the molecule. It can also be seen that each C atom and the B atom had two 1s core electrons which were not involved in bonding due to their low energy, and all the other thirty valence electrons were involved in bonding.
Summary of Natural Population Analysis:

                                       Natural Population
                Natural  -----------------------------------------------
    Atom  No    Charge         Core      Valence    Rydberg      Total
 -----------------------------------------------------------------------
      C    1   -0.58803      1.99901     4.57724    0.01178     6.58803
      C    2   -0.25033      1.99910     4.23710    0.01413     6.25033
      C    3   -0.34002      1.99907     4.32711    0.01384     6.34002
      C    4   -0.25032      1.99910     4.23709    0.01413     6.25032
      C    5   -0.58804      1.99901     4.57725    0.01178     6.58804
      H    6   -0.09649      0.00000     1.09595    0.00054     1.09649
      H    7    0.18385      0.00000     0.81397    0.00218     0.81615
      H    8    0.17899      0.00000     0.81839    0.00263     0.82101
      H    9    0.18574      0.00000     0.81227    0.00199     0.81426
      H   10    0.17899      0.00000     0.81839    0.00263     0.82101
      H   11    0.18385      0.00000     0.81397    0.00218     0.81615
      B   12    0.20181      1.99906     2.78752    0.01160     4.79819
 =======================================================================
   * Total *   -1.00000     11.99436    29.91623    0.08941    42.00000
The following table summarises the contribution of each atom to the bonding in the boratabenzene molecule:
| Bond Orbital | Coefficient | Coefficient (as percentage) | Hybridisation |
|---|---|---|---|
| C(1)-C(2) | 0.70 : 0.71 | C(49%) : C(51%) | s(33%)p(67%) : s(38%)p(62%) |
| C(1)-C(2) | 0.72 : 0.70 | C(52%) : H(48%) | p(100%) : p(100%) |
| C(1)-H(7) | 0.77 : 0.64 | C(59%) : H(41%) | s(25%)p(75%) : s(100%) |
| C(1)-B(12) | 0.82 : 0.58 | C(66%) : B (33%) | s(42%)p(58%) : s(33%)p(67%) |
| C(2)-C(3) | 0.71 : 0.71 | C(50%) : C(50%) | s(35%)p(65%) : s(36%)p(64%) |
| C(3)-C(4) | 0.71 : 0.71 | C(50%) : C(50%) | s(36%)p(64%) : s(36%)p(64%) |
| C(3)-H(9) | 0.77 : 0.64 | C(60%) : H(40%) | s(28%)p(72%) : s(100%) |
| B-H | 0.67 : 0.74 | B(45%) : H(55%) | s(33%)p(67%) : s(100%) |
| B lone pair | - | - | p(100%) |
From the data above it can be seen that the boron atom caused slight distortion of the adjacent C orbitals away from sp2 symmetry, the C orbitals involved in the C-B bonds at an intermediate between sp2 and sp hybridisation. This was balanced by the C-H bonds on the same C atom being distorted between sp2 and sp3 symmetry. This may explain the movement of the C-B-C bond angle away from 120°, as 120° is the ideal angle for sp2 hybrid geometry, hence movement away from this hybrisidation will give movement away from the ideal bond angle. It can also be seen that the C atoms have a greater contribution to both the C-B and the C-H bonds as the carbon is the least electron deficient of the three atoms and hence is the most able to donate its electron density to the two electron deficient atoms. The lone pair of B is held in a p orbital, and 4 C-C bonds are formed using 100% p orbitals, corresponding to the contiguous array of p orbitals required for aromaticity.
Pyridinium
A pyridinium molecule was built using the benzene template by replacing a C-H unit with an isoelectronic N-H+ unit. An 'opt+freq' job was ran on the molecule using the 6-31G(d,p) basis set, again selecting the 'use tight convergence data' tickbox and typing 'integral=grid=ultrafine' in the additional keywords box. The method used was the B3LYP method. The charge was set to 1 in the calculation palette and the singlet spin selected. The calculation was ran through the HPC system, giving the following output files DOI:10042/22027 .
The properties of the optimised molecule are summarised in the table below:
| Calculation Operation | Result |
|---|---|
| Calculation Type | FREQ |
| Calculation Method | RB3LYP |
| Basis Set | 6-31G(d,p) |
| Charge | 1 |
| Spin | Singlet |
| C-H Bond Length /Å | 1.083 |
| C1-C2 Bond Length /Å | 1.384 |
| C2-C3 Bond Length /Å | 1.399 |
| N-H Bond Length /Å | 1.017 |
| N-C Bond Length /Å | 1.352 |
| C-N-C Bond Angle /° | 123 |
| Energy /au | -248.6680609 |
| Gradient /au | 0.00 |
| Dipole Moment /Debye | 1.8723 |
| Point Group | C1 |
| Calculation Time /s | 527.8 |
As for the addition of BH- the additional of the NH+ subunit had several effects on the structure. The C-N-C bond angle increased relative to the C-C-C angle in benzene to 123°. Using the opposite argument as for boratabenzene this can be rationalised by the fact that carbon was substituted by an atom with a larger atomic radius and a shorter N-H bond length than the C-H bond lengths. The bond pair - bond pair repulsion between the N-H and C-H and the additional of the larger atom would encourage a greater distance between the two bond pairs and hence a larger angle. There is also a decrease in the N-C bond length compared to the C-C length, from 1.40Å to 1.35Å. This can be explained again using the electron withdrawing effects of nitrogen; its lower energy atomic orbital used for the LCAO in combination with a sp2 C atomic orbital would generate a lower energy molecular orbital which would consequently have a greater bond strength hence a shorter bond. As with boratabenzene, the additional of a substituent which caused a dipole moment in the ring, here an electronegative atom, may have effected the extent of aromaticity in the molecule by reducing the ability of the electrons to be delocalised evenly around the structure; the electronegative N atom may have pulled some of the p electron density towards itself, not allowing all of the p electron density to be spread around the plane of the ring hence reducing aromaticity and therefore the stabilisation of the molecule. The tendency of the electrons to sit on the nitrogen atom can be seen in the NBO section below, and will be discussed in detail at the end of the document.
The item table below shows that the optimisation went to completion as the forces and displacements converged.
Item               Value     Threshold  Converged?
 Maximum Force            0.000004     0.000015     YES
 RMS     Force            0.000001     0.000010     YES
 Maximum Displacement     0.000012     0.000060     YES
 RMS     Displacement     0.000004     0.000040     YES
 Predicted change in Energy=-1.054360D-10
 Optimization completed.
    -- Stationary point found.
As the frequency analysis was taken out at the same time as the optimisation the frequency data was also included in the same log file. This gave the following low frequency data, which falls within ±15 cm-1 of 0 cm-1 as required, and the second row of low frequency data are all positive, which was also required to show that the molecule was at an energy minimum.
Low frequencies ---   -9.3853   -2.9535    0.0004    0.0006    0.0012    0.8706
 Low frequencies ---  391.9002  404.3427  620.1995
The frequencies of vibration, which are all positive as expected, are summarised in the table below:
| Frequency /cm-1 | Intensity | Frequency /cm-1 | Intensity | Frequency /cm-1 | Intensity |
|---|---|---|---|---|---|
| 392 | 1 | 1022 | 4 | 1524 | 21 |
| 404 | 0 | 1048 | 0 | 1580 | 48 |
| 620 | 0 | 1052 | 0 | 1657 | 32 |
| 645 | 0 | 1082 | 3 | 1677 | 34 |
| 677 | 90 | 1087 | 4 | 3223 | 0 |
| 748 | 82 | 1200 | 3 | 3240 | 1 |
| 854 | 11 | 1229 | 2 | 3242 | 11 |
| 883 | 0 | 1300 | 3 | 3252 | 20 |
| 992 | 2 | 1374 | 11 | 3254 | 0 |
| 1006 | 0 | 1416 | 3 | 3570 | 158 |
The vibrations gave the following infrared spectrum.
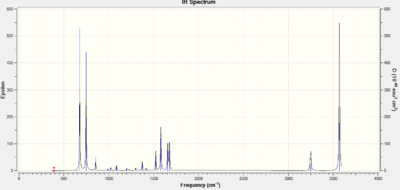
As for boratabenzene it can be seen that there were many more infrared active stretches than for benzene. This can be rationalised by the fact that the molecule had a dipole moment, meaning that more stretches would cause a change in dipole moment of the molecule, as well as the reduced symmetry of the molecule also meaning that it's dipole moment would be more easily distorted, resulting in infrared activity giving more peaks in the spectrum. The highest vibration frequencies are at larger frequencies than those of benzene; this may correspond to stretched of the very strong N-H bond, the strength of the bond being proportional to the frequency.
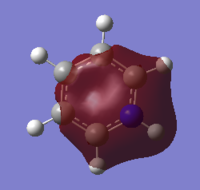
The MOs were then analysed on the optimised molecule by setting the job type to 'energy' and writing the words 'pop=full' in the additional keywords section. The file was submitted to the HPC giving the following ouput DOI:10042/22029 . The .chk file was opened in order to analyse the MOs, which again had a similar form to the benzene MO diagram, and a comparison of the MOs with the other aromatic systems will be included in the end section.
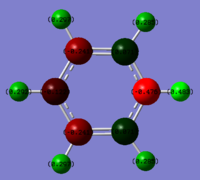
An analysis of the natural bond orbitals was then carried out using the .log file of the MO output. The charge distribution was shown using the 'NBO' model and selecting to colour atoms by charge, giving the image on the right, as well as including the charge numbers to give the table below. The number range of the charges was -0.483 to 0.483, and the results of this will be analysed and compared to the other aromatic systems in the final section.
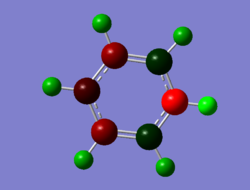
.
| Atom | Charge Distribution |
|---|---|
| N | -0.476 |
| (N)-H | 0.483 |
| C1/C5 | 0.071 |
| C2/C4 | -0.241 |
| C3 | -0.122 |
| (C1/C5)-H | 0.285 |
| (C2/C4)-H | 0.297 |
| (C3)-H | 0.292 |
By opening the .log output file more information about the natural bond orbitals could be found. The following data summarise the table above, showing the charge distribution in the molecule and the number of core and valence electrons on each atom.
Summary of Natural Population Analysis:

                                       Natural Population
                Natural  -----------------------------------------------
    Atom  No    Charge         Core      Valence    Rydberg      Total
 -----------------------------------------------------------------------
      C    1    0.07102      1.99918     3.91065    0.01916     5.92898
      C    2   -0.24106      1.99912     4.22862    0.01331     6.24106
      C    3   -0.12241      1.99913     4.10941    0.01386     6.12241
      C    4   -0.24106      1.99912     4.22862    0.01331     6.24106
      C    5    0.07102      1.99918     3.91065    0.01916     5.92898
      H    6    0.48278      0.00000     0.51476    0.00246     0.51722
      H    7    0.28493      0.00000     0.71397    0.00110     0.71507
      H    8    0.29720      0.00000     0.70177    0.00103     0.70280
      H    9    0.29169      0.00000     0.70718    0.00113     0.70831
      H   10    0.29720      0.00000     0.70177    0.00103     0.70280
      H   11    0.28493      0.00000     0.71397    0.00110     0.71507
      N   12   -0.47623      1.99937     5.46757    0.00929     7.47623
 =======================================================================
   * Total *    1.00000     11.99510    29.90895    0.09595    42.00000
The following data summarises the hybridisation of the bonding orbitals and the contribution of each atom to the bonding.
| Bond Orbital | Coefficient | Coefficient (as percentage) | Hybridisation |
|---|---|---|---|
| C(1)-C(2) | 0.71 : 0.70 | C(51%) : C(49%) | s(39%)p(61%) : s(33%)p(67%) |
| C(1)-H(7) | 0.80 : 0.60 | C(64%) : H(36%) | s(33%)p(67%) : s(100%) |
| C(1)-N | 0.61 : 0.80 | C(37%) : N(63%) | s(28%)p(72%) : s(37%)p(63%) |
| C(1)-N | 0.53 : 0.85 | C(29%) : N(71%) | p(100%) : p(100%) |
| C(2)-C(3) | 0.71 : 0.71 | C(50%) : C(50%) | s(35%)p(65%) : s(34%)p(66%) |
| C(2)-C(3) | 0.74 : 0.68 | C(54%) : (46%) | p(100%) : p(100%) |
Again, slight deviations from the sp2 hybridisation of the carbon atoms in the ring is seen, with the carbons adjacent to the nitrogen atom deviating towards the sp geometry, although to a lesser extent than for boratabenzene. This is complemented by the C deviating towards sp3 hybridisation in the C-N bond, which again can be used to explain the deviation away from idealised bond angles. C-C and C-N bonds are also present between atomic orbitals with 100% p-p character. This contiguous arrangement of p orbitals on the ring plane contributes towards the aromaticity of the molecule. It can be seen that now the least electron deficient atom is the nitrogen atom, hence when this is involved in bonding it has a greater contribution of electron density to the bond, hence larger bonding coefficients when it is involved in bonding.
Borazine
Borazine was built using the Gaussview software and again the 'opt+freq' job type was used to optimise the molecule, using the B3LYP method and the 6-31G(d,p) basis set. The job was ran under the 'opt+freq' job type, with the 'use tight convergence criteria' box checked and the additional keywords 'integral=grid=ultrafine' typed into the additional keywords box. The charge was set to zero due to the molecule being neutral. The calculation was submitted to the HPC and the results published to D space to give the following output file DOI:10042/21827 The following item table shows that the optimisation went to completion as the required parameters fully converged:
Item               Value     Threshold  Converged?
 Maximum Force            0.000004     0.000015     YES
 RMS     Force            0.000001     0.000010     YES
 Maximum Displacement     0.000026     0.000060     YES
 RMS     Displacement     0.000008     0.000040     YES
 Predicted change in Energy=-2.234919D-10
 Optimization completed.
    -- Stationary point found.
The properties of the optimised borazine molecule are summarised in the following table:
| Calculation Operation | Result |
|---|---|
| Calculation Type | FREQ |
| Calculation Method | RB3LYP |
| Basis Set | 6-31G(d,p) |
| Charge | 0 |
| Spin | Singlet |
| B-N Bond Length /Å | 1.43 |
| N-H Bond Length /Å | 1.01 |
| B-H Bond Length /Å | 1.20 |
| B-N-B Bond Angle /° | 123 |
| N-B-N Bond Angle /° | 117 |
| Energy /au | -242.6846001 |
| Gradient /au | 0.00 |
| Dipole Moment /Debye | 0.0000 |
| Point Group | C1 |
| Calculation Time /s | 710.5 |
From the table it can be seen that all B-N bonds were equal lengths, as would be expected, and were at a length similar to the C-C bonds of benzene (1.43 Å compared to 1.40 Å for benzene); this suggests an intermediate of single and double bond lengths and that there may therefore be donation of some of the electron density from the full p orbital on N to the empty p orbital on the electron deficient B atom. This explains why borazine shows aromatic behaviour, explaining the molecules stability. The N-H bonds are shorter than the B-H bonds again due to the electron withdrawing ability of the nitrogen atom compared to the more electropositive boron, which creates low energy molecular orbitals on binding to the H 1s orbital forming low energy, strong and therefore short bonds. The boron sp2 orbital however has similar size match to the H 1s orbitals as does nitrogen, however the hybridised orbital is higher in energy than nitrogen's, hence forming higher energy bonding molecular orbitals than in N-H, giving longer weaker bonds. Despite all of the B-N being polar the overall dipole moment of the molecule was 0.00 Debye, due to cancelling of all of the dipole moment vectors.
The output gave the following low frequncies, the small range around the first six and the positive values of the last three show that the optimisation went to completion.
Low frequencies ---   -4.7133   -0.0012   -0.0006   -0.0005    3.8912    8.1067
 Low frequencies ---  289.6301  289.8092  404.5035
A summary of the vibrational data is in the following table:
| Frequency /cm-1 | Intensity | Frequency /cm-1 | Intensity | Frequency /cm-1 | Intensity |
|---|---|---|---|---|---|
| 290 | 0 | 928 | 0 | 1400 | 11 |
| 290 | 0 | 937 | 236 | 1400 | 11 |
| 405 | 24 | 945 | 0 | 1493 | 494 |
| 525 | 1 | 945 | 0 | 1493 | 494 |
| 525 | 1 | 945 | 0 | 2640 | 284 |
| 710 | 0 | 1052 | 0 | 2640 | 284 |
| 710 | 0 | 1081 | 0 | 2650 | 0 |
| 732 | 60 | 1081 | 0 | 3642 | 0 |
| 865 | 0 | 1246 | 0 | 3644 | 40 |
| 928 | 0 | 1314 | 0 | 3644 | 40 |

Here it can be seen that like benzene the high symmetry and the lack of dipole moment in the molecule meant that there were many stretches which were infrared inactive, due to the lack of change in dipole moment of the molecule, and these can be seen as having an intensity of 0. However, those stretched which were active had a much greater intensity than the peaks of benzene. This is because of the very high polarity of the B-H, N-H and B-N bonds. Meaning that any asymmetrical stretches or bends would cause a very large change in dipole moment, giving a very intense signal. Benzene does not have the same 'in-built' polarity so asymmetric stretches and bends would not have such a great effect on the dipole moment of the molecule.
The molecular orbitals of borazine were generated using the optimised .chk file by setting the job type to 'energy' and typing the additional keywords 'pop=full' into the additional keywords box. The job was submitted to the HPC and the results linked to D space, which can be accessed on the following link DOI:10042/21836 . The MOs were generated and analysed, and a comparison of the MOs with those of the other aromatic molecules can be found in the end section.
An NBO analysis was then carried out, showing the charge by both colour (as shown in the image on the right) and by number. Again the results to this can be found in the final section and are compared with the other aromatic molecules. The number range for the NBO analysis was -1.102 to 1.102
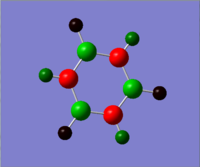
. The charge distribution results are summarised in the table below and will be discussed later.
| Atom | Charge Distribution |
|---|---|
| N | -1.102 |
| B | 0.747 |
| (N)-H | 0.432 |
| (B)-H | -0.077 |
Information about the hybridisation and the contribution of each atom to the bonding pair can be found in the following table:
| Bond Orbital | Coefficient | Coefficient (as percentage) | Hybridisation |
|---|---|---|---|
| H-N | 0.53 : 0.85 | H(28%) : N(72%) | s(100%) : s(23%)p(77%) |
| H-B | 0.74 : 0.68 | H(54%) : B(46%) | s(100%) : s(37%)p(63%) |
| N-B | 0.87 : 0.49 | N(76%) : B(24%) | s(39%)p(61%) : s(31%)p(69%) |
| N-B | 0.94 : 0.34 | N(88%) : B(12%) | p(100%) : p(100%) |
This data can be used to describe the bonding in borazine. Like benzene, the alternating B and N atoms have a p orbital perpendicular to the plane of the ring; these are the orbitals which infer aromaticity to the molecule. The N atom can be seen to have an 88% contribution to the N-B bond, and the B only a 12% contribution. This is consistent with the theory that nitrogen donates its p lone pair to the empty p orbital on boron, explaining the short B-N bond lengths which are an intermediate between single and double bonds. It can also be seen that the hybridisation of nitrogen and boron is not sp2, deviating away from the benzene template structure where the ring carbons are sp2 hybridised. This can be used to explain the alternating bond angles of 117 and 123°, as deviations away from ideal hybridisation lead to deviations of bond angles from the ideal 120°. Nitrogen also has a greater contribution of electron density to the N-B bonds in the ring as the boron is highly electron deficient and so it does not want to give up any of its electron density. Its high electron density also explains why nitrogen has a greater contribution to the N-H bonds, whereas boron has the smaller contribution to the B-H bonds due to its electron deficiency.
Despite having aromatic stability borazine is much more reactive than benzene, caused by the very polar B-N bonds compared to C-C. Due to the alternating N and B atoms in the ring there are alternating nucleophilic and electrophilic sites in the molecule. This means that it more readily undergoes additional reactions, for example the nucleophilic addition of HCl, compared to benzene which requires highly electron withdrawing or electron donation substituents on the ring to undergo these reactions. Hence the molecule is both very stable due to high levels of delocalisation of p electrons around the plane of the ring which gives it aromaticity, yet reactive due to the very polar B-N bonds within the molecule.
Comparison of Charge Distributions
From the tabulated data above it can be seen that benzene had the smallest range of charge distribution of the four molecules fro -0.239 to 0.239 and that the distribution was spread evenly between the carbon and hydrogen atoms. This is because the difference in the electronegativity of the two atoms is small, giving only small range of charge distribution and the high symmetry of the molecule meant that the charge was evenly distributed. The borazine has the largest range of charge distribution from -1.102 to 0.747. Again the high symmetry of the molecule meant that all N atoms had the same partial charge (-1.102), as did the B atoms (O.747). The larger range is due to a highly electronegative nitrogen atom being placed next to a much less electronegative boron atom, hence the electrons sit mainly on the nitrogen atoms giving these a partial negative charge and the boron atoms a partial positive charge. The effect of this can also be seen on the hydrogen atoms; those adjacent to N atoms have significant positive charge (0.432) whereas though next to boron have negative charge (-0.077). Pyridinium, despite also contain the highly electronegative nitrogen atom, has a smaller range than borazine, with partial charge of -0.476 on the nitrogen atom. This is because the nitrogen sits next to a carbon atom which is less electropositive than nitrogen and hence does not give up its electron density to nitrogen as easily. The carbon adjacent to the nitrogen atom also has a smaller partial positive charge than the boron in borazine as it only sits next to one rather than two electronwithdrawing N atoms. Having only one nitrogen in the ring means that the three individual carbon environments have different partial charges, polarising the C-C bonds, with the pattern of partial negative charge on the N, positive charge on the adjacent C, negative on the next C and more positive on the next due to inductive effects. Again the partial charges on the carbon atoms has an effect on the hydrogen atoms to which they are bound. Boratabenzene has the opposite pattern to pyridinium, which is expected as carbon has been replaced by a more electropositive rather than a more electronegative atom, causing the carbon atom adjacent to the boron to be partially negatively charged rather than positive. Again the boron atom effects the charges on all of the carbon atoms, so the electron density is not distributed evenly throughout the ring. From this viewpoint it could be said that benzene and borazine distribute their electron density more evenly around the ring than pyridinium and boratabenzene and so show a greater level of aromaticity and are more stable.
Molecular Orbital Comparison
Comparisons can be made between the MOs of the four different molecules as their MO diagrams take a similar form and all calculations were ran using the same basis set. The three MOs chosen are number 7, which is the first non-core orbital involving the 2s electrons, and MOs 20 and 21, which are the doubly degenerate HOMO orbitals in benzene. Both the form of the orbitals and their energies will be discussed.
A range of shapes can be seen for MO 7 which can be explained using electronegativity. For the fully symmetrical benzene with just C atoms in the ring the electron density is spread evenly over the molecule, giving a symmetrical MO considering the plane of the z axis. For borazine the MO takes a triangular form with significant electron density on the N atoms and electron deficiency on the B atoms. This is because nitrogen is much more electronegative and hence lower in energy than boron, hence when their orbitals combine to form molecular orbitals there is a greater contribution from the nitrogen based orbitals to the bonding orbital. The same argument can be applied to reason the distortions of the MO for pyridinium and boratabenzene. For pyridinium the N 2s orbital is lower in energy than the C 2s orbitals therefore when they combine nitrogen has a greater contribution to the bonding molecular orbital and hence is where a significant amount of the electron density sits. The opposite is true for boratabenzene; the boron 2s orbitals are higher in energy than the carbon 2s atomic orbitals, hence when molecular orbitals form the carbon atoms have a greater contrbution to the bonding orbital than the boron, hence very little elctron density can be seen on the boron atom. The MOs also differ significantly in their energy, which again is related to the electronegativity of the substituent atoms and hence the energy of the MOs formed. The two lowest energy orbitals are those of the nitrogen containing borazine and pyridinium, the high electronegativity of the N atom meaning that the bonding orbitals formed are very low in energy. The pyridinium is the lowest energy orbital at -1.21 au compared to -0.88 au for borazine. This is because the energy match between N and C is much better than between B and N giving better orbital overlap and a lower energy molecular orbital. The highest energy and hence least stable MO is that of boratabenzene. This is due to the electropositivity of the B atom compared to C giving poor energy overlap between orbitals, which makes the bonding orbital much higher in energy than that of pyridinium. Benzene has an intermediate energy of -0.85 au due to good size and energy overlap of the C 2s orbitals with one another and also with the H 1s orbitals. There are also differences between MOs 20 and 21 across the structures; these are the doubly degenerate HOMO orbitals in benzene. It can be seen than the orbitals are also degenerate in borazine, as both have an energy of -0.276 au. This is because borazine, like benzene, is highly symmetrical and has equal distribution of negative electron density on all N atoms and positive electron density on all B atoms as discussed in the previous section, giving rise to even delocalisation of electrons and degenerate orbitals. The borazine HOMO is slightly lower in energy than the benzene HOMO again due to the presence of the highly electronegative N atoms which stabilise the compound, despite poor energy overlap with the boron orbitals. The MOs however have slightly less symmetry than those of benzene; this is due to the bonding orbitals having greater contribution from the nitrogen atoms hence the MOs are slightly localised on these points. Borazine has a relatively high level of aromaticity as the molecular orbitals are, like benzene, delocalised over the whole molecule. In pyridinium and boratabenzene MOs 20 and 21 are no longer degenerate, and orbital 21 becomes the HOMO of each. The loss of degeneracy is due to the loss of symmetry when one of the C atoms in the benzene ring is substituted. For boratabenzene the shape of MO 20 is maintained, although the orbital is smaller, as the boron atom sits in the nodal plane and hence only the C 2p orbitals contribute to the bonding, all of which have the same energy giving good overlap with symmetrical contribution. However, compared to benzene, MO 21 takes a different shape with a loss of symmetry due to the involvement of boron's p orbital in bonding. Here it can be seen that, unlike in borazine, more of the electron density sits on the boron atom. This is because the HOMO is now slightly antibonding, with an energy of 0.011 au, which is above zero. Hence the atomic orbitals with the higher energy, which belong to the more electropositive boron rather than carbon, contribute more to the antibonding molcular orbitals of the molecule. Again the molecule shows aromaticity due to molecular orbitals with π symmetry being spread across the molecule in a cyclic contiguous fashion. In pyridinium the HOMO is now the orbital with the nitrogen atom in the nodal plane. This is because the inclusion of nitrogen in the formation of MO 20 lowers the energy of the molecular orbital due to the electronegativity of the nitrogen atom and hence the low energy of the contributing atomic orbital, making this the lowest energy orbital of 20 and 21. The energy and size match of the C-C p orbitals in orbital 21 is better matched overall, however the overriding effect is the low energy of the nitrogen atom, which causes orbital 20 to be the lower in energy of the two. Orbital 20 is seen to have a high level of electron density concentrated on the N atom again due to its ability to stabilise the electron density. This may mean that, like boratabenzene, the electron density is not delocalised as well in the п symmetry orbitals, reducing the aromatic character of the two molecules. Pyridinium, like benzene and borazine, has a bonding HOMO, again due to the stabilising effect of the electron withdrawing nitrogen atom.
As with the three orbitals discussed above the substitutions of the C-H subunits to form boratabenzene, pyridinium and borazine would have different effects on the MO diagram. For pyridinium the electronegative nitrogen atom would bring in lower energy atomic orbitals than carbon, and as the two atoms are adjacent in the periodic table the two would still have good size overlap. This would results in the bonding orbitals for which nitrogen is included in being lower in energy, as the nitrogen would form lower bonding orbitals on bonding with carbon than another carbon atom would. Also, the bonding molecular orbitals which nitrogen was involved in would have their electron density more localised on the N atom, and in the antibonding orbitals it would be more localised on C or H. Boratabenzene would have the opposite effect on the diagram; the molecular orbitals formed with boron involved would be higher in energy, due to the atom being more electropositive than carbon and hydrogen. The bonding molecular orbitals including the boron atom would have more electron density localised on the C or H atoms, and the antibonding orbital's their electron density localised on boron. For the borazine molecule the poorer energy overlap between boron and nitrogen would decrease the stabilisation energy of the molecular orbitals formed, decreasing the bonding-antibonding orbital gap. This would have the effect of decreasing the HOMO-LUMO gap, which explains the higher reactivity of borazine than benzene (along with its polar B-N bonds). The bonding molecular orbitals would have a greater contribution from the more electronegative N atoms, and the antibonding molecular orbitals would have a greater contribution from the electropositive boron atoms.
Conclusion
In conclusion the effect of substituting benzene with isoelectronic units could be seen to alter the aromaticity slightly, due to energy mismatches of the atomic orbitals forming the molecular orbitals and electronegativity effects allowing uneven charge distribution around the ring. However, NBO analysis showed that all three of the systems still had a contiguous, planar array of p orbitals containing delocalised π electrons and hence aromaticity was still present, although to lower extents, for all of the systems
References
- ↑ http://www.huntresearchgroup.org.uk/teaching/year3_lab_start.html, 23.11.12
- ↑ P. Schwerdtfeger, J. Ischtwan, J. Comp. Chem., 1993, 14, 913-921
- ↑ 3.0 3.1 C. Parlak, et al., Erciyes Üniversitesi Fen Bilimleri Enstitüsü Dergisi, 2011, 27(2), 208-211
- ↑ G. Leroy, M. Sana, C. Wilante, Theor. Chem. Acta. 1993 85, 155-166

