Rep:Mod:lks11oc
Larissa See
CID: 00684162
BSc Chemistry
3rd Year Organic Computational Lab (Experiment 1C)
Part 1
Conformational Analysis Using Molecular Mechanics
The Hydrogenation of Cyclopentadiene Dimer

Cyclopentadiene dimerises easily through the diels-alder reaction to form two possible products (Figure 1), the endo or exo isomer. In the hydrogenation step, as there are 2 double bonds present, it is possible for either to be hydrogenated first. In each reaction, the relative thermodynamic stability of the products will allow for prediction of the outcome of the reaction if under thermodynamic control. In this way, by investigating and understanding the relative energies of the possible products, it can be determined whether the reaction is under thermodynamic or kinetic control, which would also provide information of the stereochemistry of the products.
Comparing the Products of Dimerisation
From the MMFF94(s) force field optimisation of the geometry of the two possible dimers, their energies can be calculated and are 55.4 and 58.2 kcal/mol for the exo and endo dimers respectively. Based on this, it can be seen that the exo dimer is energetically more stable and hence, is the thermodynamic product. However, in the Diels-Alder reaction, the endo dimer is in fact the major product, indicating that kinetic factors dominate here. This can be understood by analysing the transition state of the reaction (Figure 2).
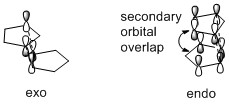
By comparing the two transition states, it is observed that the endo approach allows the transition state of the endo product to achieve additional stabilisation by the presence of secondary orbital overlap. In summary, the dimersation of cyclopentadiene is under kinetic control as the formation of the thermodynamically less stable endo product is favoured, resulting in the stereochemistry as shown for dimer 2.
Comparing the Products of Hydrogenation
By carrying out the same calculations on the dihydro derivatives 3 and 4, the energies obtained are 50.7 and 41.3 kcal/mol respectively, suggesting that compound 4 is the thermodynamic product. Comparing compounds 3 and 4, their bond stretching energy, stretch bending energy, torsional energy, out-of-plane bending energy, and electrostatic energy are all relatively similar. The main difference between the total energy of the compounds can be attributed to the angle bending energy and van der Waals energy. These two also contribute the most to the total energy. The bonds are not significantly stretched resulting in little stretch energy. Being a neutral compound, there is little electrostatic energy, and as the molecule is able to pucker, torsional strain is avoided and torsion energy is hence, insignificant.
The total bending energies are 30.9 and 24.7 kcal/mol for compounds 3 and 4 respectively. The significant angle bending energy is likely to be a result of the 3 cyclic rings present in each compound. Both compounds have a double bond which as an sp2 carbon, ideally would like to have a bond angle of 120°. However, the cyclic alkene restricts the bond angle at the sp2 carbon. For compound 4, cyclopentene is able to have relatively large bond angles, minimising the angle strain. In contrast, compound 3 has the double bond at the norbornene ring, resulting in the carbon bridge restricting the angle attainable at the sp2 carbon, resulting in the higher angle bending energy.
The total van der Waals energies are 13.3 and 10.6 kcal/mol for compounds 3 and 4 respectively. This arises from the steric interactions between the hydrogen atoms as a result of the 5-membered ring being endo with respect to the 6-membered ring.
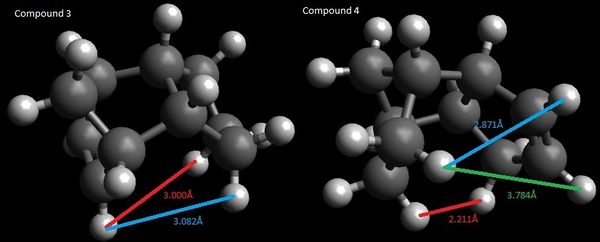
As seen in figure 3, the hydrogen atoms are about 3.0 Å apart in compound 3 and between 2.2 to 3.8 Å apart in compound 4. Although the sp2 carbon in the cyclopentene holds the hydrogen atom attached to it further from the other hydrogen atoms (3.784 Å), there is a pair of hydrogen atoms about 2.2 Å apart. This results in an attractive van der Waals interaction, contributing to a lower van der Waals energy and thus, the stabilisation of compound 4. In contrast, in compound 3, the two pairs of hydrogen atoms are held closer at about 3 Å, resulting in a marginally higher van der Waals energy.
Given that compound 4 is thermodynamically more stable, the enthalpy of hydrogenation of the cyclopentadiene dimer to compound 4 would be higher. This suggests that the alkene in the norbornene is more easily hydrogenated, and hence, it is expected that compound 4 is the major product. This is the case as the double bond in the norbornene is first hydrogenated followed by that in the cyclopentene ring [1], indicating that the reaction is under thermodynamic control.
From calculations of the energy of each isomer, compound 10 (with the carbonyl facing downwards) is more stable (60.6 kcal/mol) than compound 9 (82.8 kcal/mol). This suggests that compound 9 is first formed, before isomerising to the thermodynamically more stable compound 10. The energy difference can be accounted for by the significant difference in the angle bending energy (33.86241 kcal/mol for compound 9 as compared to 18.79459 kcal/mol for compound 10). The angle bending energy in both compounds is quite large and could be mostly due to the angle strain on the carbon atoms in the 6-membered ring of norbornene. The carbon with two methyl groups (in figure 4) also shows deviation from the usual tetrahedral geometry. However, comparison of certain angles in each isomer reveals some differences which could be the reason for the relatively higher angle bending energy in compound 9. This is shown in Figure 4, where the carbon adjacent to the carbonyl carbon has an angle of 125.1° and 115.8° for compound 9 and 10 respectively. In compound 9, the deviation from the ideal sp3 angle of 109.5° is larger and hence, could result in the higher angle strain.

It is also observed that the alkene reacts slowly. This bridgehead alkene is recognised as a hyperstable alkene which arises when in a trans-cycloalkene consisting of at least 8 members. [2] In such systems, the olefinic strain is directly related to the enthalpy of hydrogenation and as a result, can be understood by calculating the various energies of compounds 9 and 10 and their alkane analogues.[2] As shown in table 3, compound 9 has a total energy of 82.8 kcal/mol as compared to 89.8 kcal/mol for its alkane analogue, while compound 10 has a total energy of 60.6 kcal/mol as compared to 71.5 kcal/mol for its alkane analogue. In both cases, the alkane analogue has a higher energy and is less stable. Similarly, in both compounds 9 and 10, the alkane analogue has higher angle bending energy and torsional energy. This suggests that the bridgehead olefin confers greater stability to the compound, leading to the alkene being less reactive than expected.
It was noted that it is possible for the cyclohexane ring in the compound to exist in either the chair or twist-boat conformation. Though it was expected that the cyclic ketone ring may affect the conformation of the cyclohexane, locking it in the less thermodynamically stable twist-boat conformation,[2] adjustments of the atoms still resulted in the compound being optimised to form the chair conformation.
Spectroscopic Simulation Using Quantum Mechanics
Energy Calculations
1H NMR


| Description | Calculated chemical shift (ppm)[3] | Literature data[4] | ||
|---|---|---|---|---|
| Chemical shift (ppm) | Number of protons | Multiplicity | ||
| Allylic proton (atom 40) | 5.85886 | 4.84 | 1H | dd |
| Protons in the 1,3-dithiolane group (atoms 50-53) | 3.51652, 3.32131, 3.26727, 3.05755 | 3.4-3.1 | 4H | m |
| Protons in the methyl group (atoms 42-44) | 2.1794, 1.58212, 0.502248 [1.42126 (average)] |
1.38, 1.25, 1.10 | 3H | s |
| Protons in the methyl group (atoms 31-33) | 1.59018, 1.00589, 0.741166 [1.11241 (average)] |
3H | s | |
| Protons in the methyl group (atoms 35-37) | 1.33624, 0.824549, 0.664303 [0.94170 (average)] |
3H | s | |
| All other protons | 3.47473, 3.10718, 2.84775, 2.79425, 2.70198, 2.53733, 2.42934, 2.22107, 2.13485, 2.06662, 1.9827, 1.85223, 1.45715, 1.39798, 1.32588, 1.27936 | 2.99 | 1H | dd |
| 2.8-1.35 | 14H | m | ||
| 1.00-0.80 | 1H | m | ||
Comparing the calculated proton NMR spectrum to literature data,[4] it can be observed that although the spectra obtained is roughly similar, there are many differences in the values and there are certain difficulties in comparing data. It is expected that the allylic proton will be significantly deshielded in comparison to the other protons and hence, appear more downfield. Despite a slight difference in value (5.85 ppm compared to 4.84 ppm in literature), this peak appears much more downfield than the other peaks in the spectrum. The protons of the dithiolane group can also be easily compared. This is because the relatively electronegative nature of the sulphur atoms causes them to be slightly more deshielded than the other protons, resulting in these 4 protons appearing at 3.4-3.1 ppm without overlapping with other protons. This allows them to be compared to the calculated chemical shift of the protons numbered 50 to 53. As seen from Table 5, here is fairly good agreement between the chemical shifts.
In order to compare the NMR shifts of the 3 methyl groups present in the compound, the calculated chemical shifts were averaged and are shown in Table 5. There is fairly good agreement between the averaged values with the literature data. However, it is interesting to note that the individual chemical shifts are quite different and range from about 2.18 to 0.50 ppm. It is also difficult to know which of the 3 methyl groups each chemical shift corresponds to.
Greater difficulties arise in comparing the remaining protons as many of them are multiplets and have similar chemical shifts. The calculated values range from 3.47 to 1.28 ppm while the actual values range from 2.99 to 0.80 ppm. Notably, most of the peaks lie within the same range. However, it is important to bear in mind that it is difficult to assign a chemical shift to the individual protons and that as seen from the protons in each of the methyl groups, the calculated value can be quite different from the actual/averaged value. As such, it would not be accurate to compare the values simply in the order of their magnitude.
13C NMR

| Calculated chemical shift (ppm)[3] | Literature chemical shift (ppm)[4] | Difference (calculated-actual) |
|---|---|---|
| 220.118 | 218.79 | +1.328 |
| 149.689 | 144.63 | +5.059 |
| 116.959 | 125.33 | -8.371 |
| 92.9833 | 72.88 | +19.4288 |
| 62.3088 | 56.19 | +6.1188 |
| 57.3622 | 52.52 | +4.8422 |
| 55.2009 | 48.50 | +6.7009 |
| 53.9652 | 46.80 | +7.1652 |
| 51.9081 | 45.76 | +6.1481 |
| 49.033 | 39.80 | +10.223 |
| 48.6631 | 38.81 | +9.8531 |
| 46.2822 | 35.85 | +10.4322 |
| 41.8761 | 32.66 | +9.2161 |
| 36.0814 | 28.79 | +7.2914 |
| 32.2525 | 28.29 | +3.9625 |
| 30.564 | 26.88 | +3.684 |
| 26.8588 | 25.66 | +1.1988 |
| 26.2534 | 23.86 | +3.1934 |
| 23.7602 | 20.96 | +2.8002 |
| 22.5307 | 18.71 | +3.8207 |
Although the chemical shifts are compared in the order of magnitude, similar to the proton NMR, it is important to note that it is difficult to assign the chemical shifts to corresponding carbon atom. The calculated NMR spectrum allows the chemical shifts to be matched with each carbon atom. However, from the actual spectrum, this would only be possible using 2D NMR methods of which there is no available data. Another consideration is that arbon atoms attached to "heavy" elements have shifts which require correction due to spin-orbit coupling errors. In this compound, this would apply to the 3 carbon atoms bound to sulphur (atoms 20, 48 and 49). These have calculated chemical shifts of 92.98, 48.66 and 41.88 ppm respectively, which differing from literature by +19.43, +9.85 and +9.21 ppm.
As there are still many carbon atoms with calculated chemical shifts differing from literature data by more than 5 ppm, it is likely that the computed conformation of the molecule is not the most stable possible. Unfortunately, further attempts to minimise the energy of the molecule by manually adjusting the position of the atoms or by re-drawing and re-optimising the geometry of the compound were unsuccessful. It is also possible that the compound does not exist in the lowest energy conformation, resulting in the measured NMR spectrum being different from the calculated spectrum.
Part 2
Crystal Structure of the Catalysts
Shi Catalyst
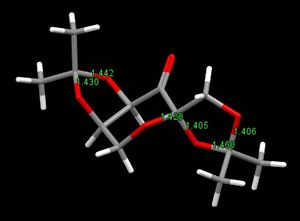
In the Shi catalyst, there are 3 pairs of C-O bonds at 3 anomeric centres, as shown in Figure 8. In all 3 pairs, the C-O bonds are of unequal length, with one longer than the other. This is not unexpected of anomeric centers as the lone pair on the oxygen atom is able to donate electron density into the other C-O antibonding orbital, resulting in the lengthening of that C-O bond. Consequently, the C-O bond with the oxygen donating electron density also becomes shorter. Examining the C-O bond lengths and comparing them to the average C-O bond length can provide evidence of this. The characteristic length of a C-O single bond is about 1.42 Å.[5] In the pair with bond lengths of 1.430 and 1.442 Å, although both are longer than the typical C-O bond, they are of unequal lengths. In the other two pairs, the bond lengths alternate as such: 1.406, 1.460, 1.405 and 1.420 Å. This suggests that the donation of electron density causes the first C-O bond to shorten and the adjacent C-O bond to lengthen due to donation into its antibonding orbital.
Jacobsen Catalyst

In the Jacobsen catalyst, two of the t-butyl groups are brought exceptionally close to each other, as shown in Figure 9. This might lead to steric clashes, but on closer inspection, the distances between the hydrogen atoms range from 2.328 to 2.924 Å. This is similar to the van der Waals attraction distance, which is about 2.4 Å between hydrogen atoms.[6] As such, it is possible that this favours close proximity of the t-butyl groups. It is also interesting to note that in the Jacobsen catalyst crystal, the t-butyl groups being examined are in an eclipsed conformation. This further suggests that there are other interactions involved as an eclipsed conformation would not minimise steric interactions.
NMR Properties of Epoxides
trans-β-Methylstyrene oxide
Energy Calculations
1H NMR

| Description | Calculated chemical shift (ppm)[7] | Literature data[8] | ||
|---|---|---|---|---|
| Chemical shift (ppm) | Number of protons | Multiplicity | ||
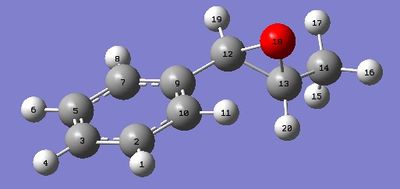
| Protons in the phenyl ring | 7.50057, 7.49654, 7.47641, 7.42151, 7.3073 | 7.32-7.22 | 5H | m |
| Proton attached to epoxide carbon (atom 19) | 3.41477 | 3.55 | 1H | d |
| Proton attached to epoxide carbon with methyl group (atom 20) | 2.7878 | 3.10 | 1H | dq |
| Protons in the methyl group (atoms 15-17) | 1.67823, 1.5873, 0.716946 [1.327492 (average)] |
1.42 | 3H | d |
The calculated chemical shifts are roughly similar to that reported in literature.[8] It is easier to compare the computed result as the coupling reported in literature allows each proton to be identified the corresponding calculated chemical shift. In the same way, the chemical shift of the 3 protons of the methyl group are averaged before a comparison is made to literature.
13C NMR

| Calculated chemical shift (ppm)[7] | Literature chemical shift (ppm)[8] | Difference (calculated-actual) |
|---|---|---|
| 134.976 | 137.9 | -2.924 |
| 124.073 | 128.4 | -4.327 |
| 123.328 | 128.4 | -5.072 |
| 122.796 | 128.0 | -5.204 |
| 122.727 | 125.5 | -2.773 |
| 118.486 | 125.5 | -8.014 |
| 62.3198 | 59.5 | +2.8198 |
| 60.5767 | 59.0 | +1.5767 |
| 18.8376 | 18.0 | +0.8367 |
There is better agreement between the calculated and measured NMR spectra for the epoxide here than for the taxol intermediate (compound 17) previously measured. This could be because the epoxide here is a smaller compound with less variation in the possible conformations, resulting in a more accurate calculation being carried out. In the data reported in literature, there are 2 pairs of carbon atoms which have the same chemical shift. For the comparison, the assignment given in literature, as well as analysis of the structure and which carbon atoms might be in similar/same chemical environment, was used to determine which two pairs of calculated chemical shifts would match them. It is possible that in assigning the actual spectra, other data such as 2D NMR data could have been used to more accurately assign the peaks observed.
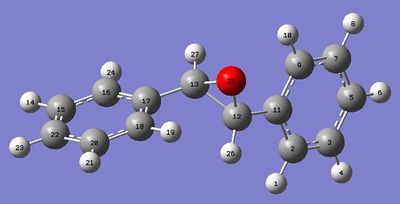
trans-Stilbene oxide
Energy Calculations
1H NMR

| Description | Calculated chemical shift (ppm)[9] | Literature data[8] | ||
|---|---|---|---|---|
| Chemical shift (ppm) | Number of protons | Multiplicity | ||
| Protons in the phenyl rings | 7.57043, 7.507, 7.48965, 7.4692, 7.45066 | 7.30-7.238 | 10H | m |
| Proton attached to epoxide carbons (atoms 26 and 27) | 3.53781 | 3.87 | 2H | s |
The calculated chemical shifts are roughly similar to that reported in literature.[8] Like the previous epoxide, the computed result can be easily compared to literature by analysis of the compound. Having a point of inversion, each atom has a corresponding atom with exactly the same chemical shift.
13C NMR

| Calculated chemical shift (ppm)[9] | Literature chemical shift (ppm)[8] | Difference (calculated-actual) |
|---|---|---|
| 134.088 | 137.1 | -3.012 |
| 124.22 | 128.5 | -4.28 |
| 123.518 | 128.5 | -4.983 |
| 123.212 | 128.3 | -5.088 |
| 123.079 | 125.5 | -2.421 |
| 118.263 | 125.5 | -7.237 |
| 66.4259 | 62.9 | +3.5259 |
Like the previous epoxide, there is relatively better agreement between the calculated and measured NMR chemical shift, possibly due to the relatively smaller number of atoms involved. Also, the rigid phenyl ring limits the number of conformations possible, resulting in the conformation of the calculated compound being more likely to be similar to that of the actual compound. Due to the symmetry of the molecule, each observed and calculated chemical shift has 2 or 4 carbons corresponding to it.
Optical Properties of Epoxides
trans-β-methylstyrene oxide
Calculated: [α]D = +46.77°[10]
Actual: [α]D25 = +40.8°[11]
trans-stilbene oxide
Calculated: [α]D = +297.98°[12]
Actual: [α]D22 = +250.8°[13]
Discussion
In calculating the properties of the epoxides, it is expected that the R,R and S,S isomers will have the same energies as well as same NMR spectra. The optical rotation, on the other hand, is expected to be equal in magnitude, but of opposite sign for the two isomers. In this case, the optical rotation calculated was for both R,R isomers. A mixture of isomers would give an overall optical rotation of smaller magnitude, with the sign following that of the major isomer. By comparison of experimental data to known data (calculated or from literature), it is possible to assign the stereochemistry of the major product.
Before comparing, it is important to note that calculations as well as experimental measurement were carried out using light with a wavelength of 589 nm and in chloroform as the solvent. For trans-β-methylstyrene oxide, the calculated result is +46.77°,[10] which is in fairly good agreement with literature (+40.8°).[11] The minor difference might be attributed to the computational method which is less reliable when the optical rotation falls below 100°. For trans-stilbene oxide, the calculated result is +297.98°[12] while that reported in literature is +250.8°.[13] While the difference is relatively significant, it is worthy to note that the measured optical rotation is dependent on the temperature at which it is measured. This also results in it being sensitive to differences in temperature, as observed in the wide range of values reported in literature.
Transition State Analysis
Shi Catalyst
For the R,R and S,S configurations, each have 4 possible transition states. The transition state with the lowest energy will be used for the purpose of calculations, based on the assumption that the reaction will go through the transition state with the lowest energy and consequently, follow the reaction path with the lowest activation energy barrier.
trans-β-Methylstyrene oxide
R,R configuration
Lowest sum of electronic and thermal free energies for possible transition states = -1343.032443 Hartree = -3526131.679 kJ/mol (1 Hartree = 2625.5 kJ/mol)[14]
S,S configuration
Lowest sum of electronic and thermal free energies for possible transition states = -1343.024742 Hartree = -3526111.46 kJ/mol[15]
ΔG = -3526131.679 - (-3526111.46) = -20.219 kJ/mol
ΔG = -RTlnK
-20.219 kJ/mol = -(8.314 J K-1 mol-1)(298.15 K) lnK
lnK = 8.157
K = 3486.68 > 1
Ratio of RR:SS = 3486.68:1
Enantiomeric excess = [(3486.68÷3586.68)/(1÷3486.68)] × 100% = 99.94 %
Literature enantiomeric excess = 88 to 95.5 % (R,R as the major isomer)[16]
trans-Stilbene oxide
R,R configuration
Lowest sum of electronic and thermal free energies for possible transition states = -1534.700037 Hartree = -4029354.947 kJ/mol[17]
S,S configuration
Lowest sum of electronic and thermal free energies for possible transition states = -1534.693818 Hartree = -4029338.619 kJ/mol[18]
ΔG = -4029354.947 - (-4029338.619) = -16.328 kJ/mol
ΔG = -RTlnK
-16.328 kJ/mol = -(8.314 J K-1 mol-1)(298.15 K) lnK
lnK = 6.587
K = 725.61 > 1
Ratio of RR:SS = 725.61:1
Enantiomeric excess = 99.72 %
Literature enantiomeric excess = 95.2 to 98.9 % (R,R as the major isomer)[16]
Jacobsen Catalyst
In the same way as for the Shi catalyst, when there is more than one possible transition state, the energy of the lowest energy transition state is used for calculations.
trans-β-Methylstyrene oxide
R,R configuration
Lowest sum of electronic and thermal free energies for possible transition states = -3383.254344 Hartree = -8882734.28 kJ/mol[19]
S,S configuration
Lowest sum of electronic and thermal free energies for possible transition states = -3383.262481 Hartree = -8882755.644 kJ/mol[20]
ΔG = -8882734.28 - (-8882755.644) = 21.364 kJ/mol
ΔG = -RTlnK
21.364 kJ/mol = -(8.314 J K-1 mol-1)(298.15 K) lnK
lnK = -8.619
K = 1.807 × 10⁻⁴ < 1
Ratio of RR:SS = 1.807 × 10⁻⁴:1
Enantiomeric excess = 99.96 %
Literature enantiomeric excess = 56 % (R,R as the major isomer)[21]
trans-Stilbene oxide
R,R configuration
Lowest sum of electronic and thermal free energies for possible transition states = -3574.921174 Hartree = -9385955.542 kJ/mol[22]
S,S configuration
Lowest sum of electronic and thermal free energies for possible transition states = -3574.923087 Hartree = -9385960.565 kJ/mol[23]
ΔG = -9385955.542 - (-9385960.565) = 5.023 kJ/mol
ΔG = -RTlnK
5.023 kJ/mol = -(8.314 J K-1 mol-1)(298.15 K) lnK
lnK = -2.026
K = 0.1318 < 1
Ratio of RR:SS = 0.1318:1
Enantiomeric excess = 76.71 %
Literature enantiomeric excess = 25 % (S,S as the major isomer)[21]
Discussion
In the Shi catalyst, for both trans-β-methylstyrene and trans-stilbene, the computed major isomer is R,R, with an enantiomeric excess of 99.94 % and 99.72 %. This is in close agreement with that reported in literature with enantiomeric excesses of 88 to 95.5 % and 95.2 to 98.9 %[16] respectively. For the Jacobsen catalyst, for both trans-β-methylstyrene and trans-stilbene, the computed major isomer is the S,S epoxide, with an enantiomeric excess of 99.96 % and 76.71 % respectively. In contrast, the literature result for trans-β-methylstyrene is an enantiomeric excess of 56% with the R,R isomer as the major product. For trans-stilbene, the S,S isomer is obtained which agrees with that calculated, but with a lower enantiomeric excess of 25 %.[21]
There are numerous reasons that could contribute to this discrepancy between the experimental result and that obtained using computational methods. Firstly, experimentally, it is important for the catalyst to be enantiomerically pure as this would directly result the ratio of products formed. As the Jacobsen catalyst is synthesised from a racemate, it is possible that the catalyst used in the epoxidation is actually made up of a mixture of catalyst with the R,R and S,S ligands. The proportion of this would then affect the products obtained or even result in the opposite isomer being them major product. Secondly, it is important to note that the specific ligand used is also important and can affect the interactions between the catalyst and alkene substrate. For trans-β-methylstyrene, the only literature found that could be compared had a slightly different ligand and hence, may result in the different result obtained. Thirdly, the computational method assumes that the reaction goes through the transition state with the lowest energy as calculated from the computational method. It is possible that other effects not accounted for by the computational method takes place when the reaction is carried out experimentally and results in the results being slightly different from that calculated computationally. This demonstrates one of the limitations of computational chemistry that should be kept in mind while carrying out computational analysis and making comparisons to experimental results.
NCI (Non-Covalent-Interaction) analysis
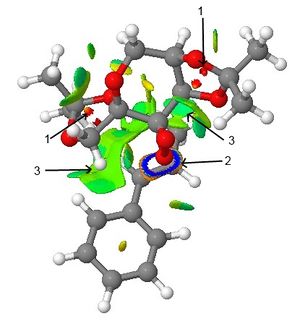
By computing the non-covalent interactions, the colours can be used to analyse the type of interaction and roughly describe its strength. In this case, the transition state of the Shi catalyst with trans-β-methylstyrene has been calculated. The orientation here results in the R,R-epoxide being formed. The small red interactions indicated by arrow 1 show strong repulsion resulting from the oxygen atoms in the catalyst. The ring at arrow 2 represents where the C-O bonds of the epoxide will form. The main interaction here is the large green-blue patch shown by arrow 3. Blue interactions indicate strong attraction while green interactions indicate mild attraction. These interactions are important in holding the substrate (trans-β-methylstyrene) in place for epoxidation by the catalyst. The overall strength of the attraction between the catalyst and substrate could then account for the preferred substrate type, or the preferred stereochemistry of the products. Comparing these interactions between the various possible transition states could then allow for a better understanding of the origin of regio- and stereoselectivity.
Electronic topology (QTAIM)
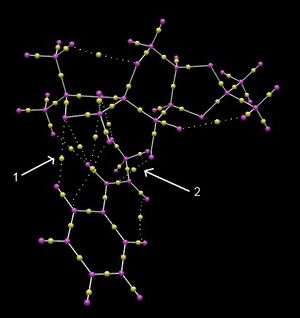
Calculating the electronic topology of the transition state allows for the electron density between the atoms to be analysed. In this case, the transition state between the shi catalyst and trans-β-methylstyrene as the substrate gave the result in Figure 17. The interactions of interest are those between the catalyst and substrate as these determine which configurations are favoured and hence, the regiochemistry and stereochemistry of the resulting products. There are many non-covalent bond critical points (BCPs) between the catalyst (particularly the oxygen atoms) and the alkene substrate, indicated by arrow 1. These interactions match the attractive region previously calculated in the NCI analysis. There are also no covalent interactions between the catalyst and alkene. Notably, there is a BCP between the double bond of the alkene and the oxygen atom of the dioxirane (shown by arrow 2), which will become the oxygen incorporated into the epoxide product. Interestingly, the BCPs in the non-covalent interactions lie in the middle of the two atoms, while the BCPs of some covalent interactions may lie closer to one atom.
Alternative Candidate for Investigations

The epoxide 3-((2R,3R)-3-phenyloxiran-2-yl)pyridine has an optical rotation of [α]D20 = +365.9° in benzene.[24] The corresponding alkene, 4-Styrylpyridine, can also be purchased. As there is not much data about this epoxide, its properties such as the optical rotation for the specific isomers can be calculated computationally to obtain a better understanding of the epoxide and its chirality.
References
- ↑ D. Skála and J. Hanika, Pet. Coal, 2003, 45, 105–108.
- ↑ 2.0 2.1 2.2 W. F. Maier and P. V. R. Schleyer, J. Am. Chem. Soc., 1981, 103, 1891–1900; DOI:10.1021/ja00398a003
- ↑ 3.0 3.1 L. See, "NMR Spectrum of compound 17", 2014; DOI:10042/28145
- ↑ 4.0 4.1 4.2 L. A. Paquette, N. A. Pegg, D. Toops, G. D. Maynard, and R. D. Rogers, J. Am. Chem. Soc., 1990, 112, 277–283; DOI:10.1021/ja00157a043
- ↑ CRC Handbook of Chemistry and Physics, ed. D. R. Lide, CRC Press, Boca Raton, 85th edn., 2005.
- ↑ H. Rzepa, Conformational Analysis Notes, Second Year Chemistry, Imperial College London, 2014; DOI:10042/a3uy9
- ↑ 7.0 7.1 L. See, "NMR Spectrum of trans-β-methylstyrene oxide", 2014; DOI:10042/28146
- ↑ 8.0 8.1 8.2 8.3 8.4 8.5 L. Ji, Y.N. Wang, C. Qian, and X.Z. Chen, Synth. Commun., 2013, 43, 2256–2264; DOI:10.1080/00397911.2012.699578
- ↑ 9.0 9.1 L. See, "NMR Spectrum of trans-stilbene oxide", 2014; DOI:10042/28147
- ↑ 10.0 10.1 L. See, "Optical Rotation of trans-β-methylstyrene oxide", 2014; DOI:10042/28149
- ↑ 11.0 11.1 B. Wang, X. Wu, O. A. Wong, B. Nettles, M. Zhao, D. Chen, and Y. Shi, J. Org. Chem., 2009, 74, 3986–9; DOI:10.1021/jo900330n
- ↑ 12.0 12.1 L. See, "Optical Rotation of trans-stilbene oxide", 2014; DOI:10042/28150
- ↑ 13.0 13.1 D. J. Fox, D. S. Pedersen, A. B. Petersen, and S. Warren, Org. Biomol. Chem., 2006, 4, 3117–9; DOI:10.1039/b606881b
- ↑ H. Rzepa, "Gaussian Job Archive for C21H28O7", 2013; DOI:10.6084/m9.figshare.738037
- ↑ H. Rzepa, "Gaussian Job Archive for C21H28O7", 2013; DOI:10.6084/m9.figshare.739117
- ↑ 16.0 16.1 16.2 Z. Wang, Y. Tu, M. Frohn, J. Zhang, and Y. Shi, J. Am. Chem. Soc., 1997, 119, 11224–11235; DOI:10.1021/ja972272g
- ↑ H. Rzepa, "Gaussian Job Archive for C26H30O7", 2013; DOI:10.6084/m9.figshare.829522
- ↑ H. Rzepa, "Gaussian Job Archive for C26H30O7", 2013; DOI:10.6084/m9.figshare.830389
- ↑ H. Rzepa, "Gaussian Job Archive for C37H46ClMnN2O3", 2013; DOI:10.6084/m9.figshare.856651
- ↑ H. Rzepa, "Gaussian Job Archive for C37H46ClMnN2O3", 2013; DOI:10042/25945
- ↑ 21.0 21.1 21.2 T. Katsuki, J. Mol. Catal. A Chem., 1996, 113, 87–107; DOI:10.1016/S1381-1169(96)00106-9
- ↑ H. Rzepa, "Gaussian Job Archive for C42H48ClMnN2O3", 2013; DOI:10.6084/m9.figshare.899176
- ↑ H. Rzepa, "Gaussian Job Archive for C42H48ClMnN2O3", 2013; DOI:10.6084/m9.figshare.903625
- ↑ A. Solladié-Cavallo, M. Roje, T. Isarno, V. Sunjic, and V. Vinkovic, European J. Org. Chem., 2000, 2000, 1077–1080.; DOI:<1077::AID-EJOC1077>3.0.CO;2-4 10.1002/(SICI)1099-0690(200003)2000:6<1077::AID-EJOC1077>3.0.CO;2-4


