Rep:Mod:lks11
Larissa See
CID: 00684162
BSc Chemistry
3rd Year Inorganic Computational Lab
Optimisations
BH3 Optimisation
3-21G Optimisation
The log file for the BH3 3‑21G optimisation can be found here
Summary of calculation details
File type: .log
Calculation type: FOPT
Calculation method: RB3LYP
Basis set: 3‑21G
Final energy: ‑26.46226388 a.u.
Gradient: 0.00000022 a.u.
Dipole moment: 0.00 Debye
Point group: Cs
Time taken for calculation: 6.0 s
         Item               Value     Threshold  Converged?
 Maximum Force            0.000000     0.000002     YES
 RMS     Force            0.000000     0.000001     YES
 Maximum Displacement     0.000002     0.000006     YES
 RMS     Displacement     0.000001     0.000004     YES
 Predicted change in Energy=-1.045395D-12
 Optimization completed.
    -- Stationary point found.
The calculations are complete as the forces and displacement have converged.
Optimisation Plot

6-31G(d,p) Optimisation
The log file for the BH3 6-31G(d,p) optimisation can be found here
Summary of calculation details
File type: .log
Calculation type: FOPT
Calculation method: RB3LYP
Basis set: 6‑31G(d,p)
Final energy: ‑26.61532364 a.u.
Gradient: 0.00000708 a.u.
Dipole moment: 0.00 Debye
Point group: Cs
Time taken for calculation: 8.0 s
         Item               Value     Threshold  Converged?
 Maximum Force            0.000000     0.000002     YES
 RMS     Force            0.000000     0.000001     YES
 Maximum Displacement     0.000000     0.000006     YES
 RMS     Displacement     0.000000     0.000004     YES
 Predicted change in Energy=-5.700671D-14
 Optimization completed.
    -- Stationary point found.
The calculations are complete as the forces and displacement have converged.
Optimised B‑H distance: 1.19 Å
Optimised H‑B‑H bond angle: 120.0 °
Total energy for 3‑21G optimised structure: ‑26.46226388 a.u.
Total energy for 6‑31G(d,p) optimised structure: ‑26.61532364 a.u.
The optimised B‑H distance is similar to literature, which is 1.19 Å. [1] The bond angle of 120.0 ° corresponds to its trigonal planar shape.
GaBr3 Optimisation
The log file for the GaBr3 optimisation can be found here
The D-space link can be found here
Summary of calculation details
File type: .log
Calculation type: FOPT
Calculation method: RB3LYP
Basis set: LanL2DZ
Final energy: ‑41.70082783 a.u.
Gradient: 0.00000016 a.u.
Dipole moment: 0.00 Debye
Point group: D3h
Time taken for calculation: 13.9 s
         Item               Value     Threshold  Converged?
 Maximum Force            0.000000     0.000450     YES
 RMS     Force            0.000000     0.000300     YES
 Maximum Displacement     0.000003     0.001800     YES
 RMS     Displacement     0.000002     0.001200     YES
 Predicted change in Energy=-1.282688D-12
 Optimization completed.
    -- Stationary point found.
The calculations are complete as the forces and displacement have converged.
Optimised Ga‑Br bond distance: 2.35 Å
Optimised Br‑Ga‑Br bond angle: 120.0 °
The optimised Ga‑Br bond distance is similar to that reported in literature, which is 2.3525 Å. [1] The bond angle of 120.0 ° corresponds to its trigonal planar shape.
BBr3 Optimisation
The log file for the BBr3 optimisation can be found here
The D-space link can be found here
Summary of calculation details
File type: .log
Calculation type: FOPT
Calculation method: RB3LYP
Basis set: Gen (6‑31G(d,p) for B, LanL2DZ for Br)
Final energy: ‑64.43644656 a.u.
Gradient: 0.00000953 a.u.
Dipole moment: 0.00 Debye
Point group: Cs
Time taken for calculation: 20.7 s
         Item               Value     Threshold  Converged?
 Maximum Force            0.000023     0.000450     YES
 RMS     Force            0.000011     0.000300     YES
 Maximum Displacement     0.000150     0.001800     YES
 RMS     Displacement     0.000084     0.001200     YES
 Predicted change in Energy=-2.467500D-09
 Optimization completed.
    -- Stationary point found.
The calculations are complete as the forces and displacement have converged.
Optimised B‑Br distance: 1.93 Å
Optimised Br‑B‑Br bond angle: 120.0 °
The optimised B‑Br bond distance is similar to that reported in literature, which is 1.893 Å. [1] The bond angle of 120.0 ° corresponds to its trigonal planar shape.
Bond Distance Comparison
| Compound | Bond Distance (Å) |
|---|---|
| BH3 | 1.19 |
| GaBr3 | 2.35 |
| BBr3 | 1.93 |
Discussion
The bond distances of BH3, GaBr3 and BBr3 are 1.19, 2.35, and 1.93 Å respectively.
Comparing the bond distances of BH3 and BBr3, the bond distance of BH3 is shorter, at 1.19 Å, than that of BBr3 (1.93 Å). H and Br both bond similarly with B, forming one covalent bond. However, Br being in the 4th row of the periodic table, has 3 more electron shells than H, and is much larger in size, resulting in a larger bond distance. Another difference between Br and H is their electronegativity, which also affects the bond distance. While Br and H are both more electronegative than B, Br is significantly more electronegative, resulting in a more polar bond formed. The lone pairs on Br which are available to partially donate electron density into the empty p orbital on B also affects the bond distance. This would result in a shorter B-Br bond distance than if the comparison were made solely on atomic size.
The bond distance is also affected by the central atom. A larger central atom would result in a longer bond distance than a smaller central atom. This can be observed by comparing the B‑Br bond distance in BBr3 (1.93 Å) and the Ga-Br bond distance in GaBr3 (2.35 Å). While both are in group 13 of the periodic table, B is in the 2nd row while Ga is in the 4th row of the periodic table. As such, both bond similarly, forming 3 single covalent bonds to Br, but Ga, with two more electron shells than B, is larger in size. The larger atomic size of Ga therefore results in the longer Ga‑Br bond distance than B‑Br bond distance.
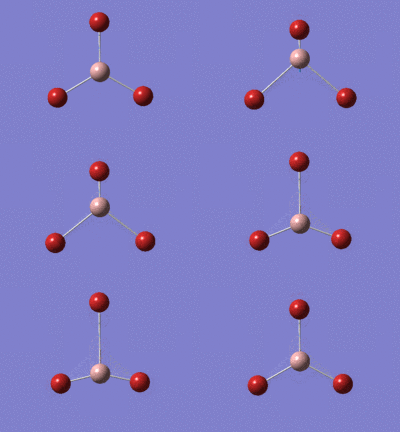
In the optimisation process, the atoms are far apart from one another and there may not be any bonds present. Over the optimisation process, as the atoms are moved closer to one another, the presence of bonds is indicated in the diagram, eventually reaching the final optimised structure.
However, a bond is not defined by the distance between the atoms, but rather, involves the sharing of electron density between two atoms due to the electrostatic attraction between the positively charged nuclei and the negatively charged electrons of the other atom. In some structures, Gaussview does not draw in the expected bonds. This does not necessarily mean that there are no bonds because the program decides when to draw bonds based on a pre-defined average bond distance. In reality, it is possible that at distances larger than the pre-defined average bond distance, there is already some sharing of electron density which would represent the presence of a bond.
Frequency Analysis
BH3
The log file for the BH3 frequency analysis can be found here
Summary of calculation details
File type: .log
Calculation type: FOPT
Calculation method: RB3LYP
Basis set: 6‑31G(d,p)
Final energy: ‑26.61532364 a.u.
Gradient: 0.00000008 a.u.
Dipole moment: 0.00 Debye
Point group: D3h
Time taken for calculation: 5.0 s
         Item               Value     Threshold  Converged?
 Maximum Force            0.000000     0.000002     YES
 RMS     Force            0.000000     0.000001     YES
 Maximum Displacement     0.000001     0.000006     YES
 RMS     Displacement     0.000000     0.000004     YES
 Predicted change in Energy=-1.606959D-13
 Optimization completed.
    -- Stationary point found.
Frequencies
 Low frequencies ---   -9.4579   -9.4430   -0.0877   -0.0010    0.5303    2.1023
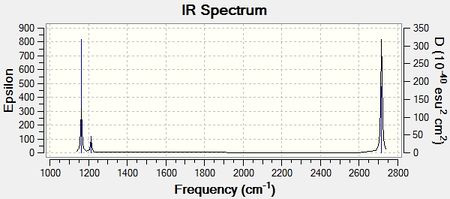
 Low frequencies --- 1162.9897 1213.1492 1213.1494
The low frequencies obtained are between ±15 cm-1. The calculation is complete as the frequencies obtained are positive, showing that a minimum point has been obtained.
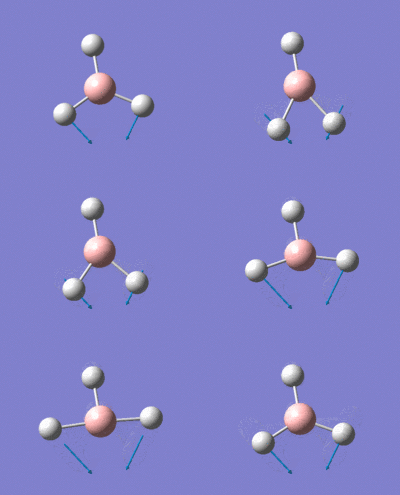
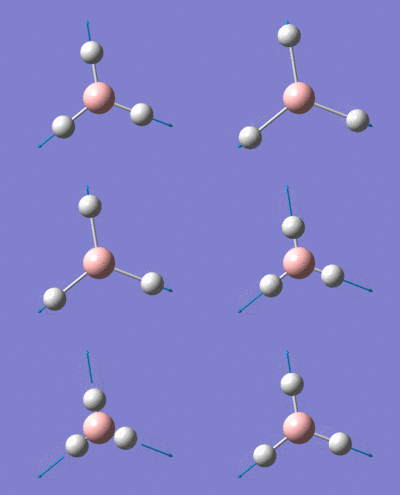
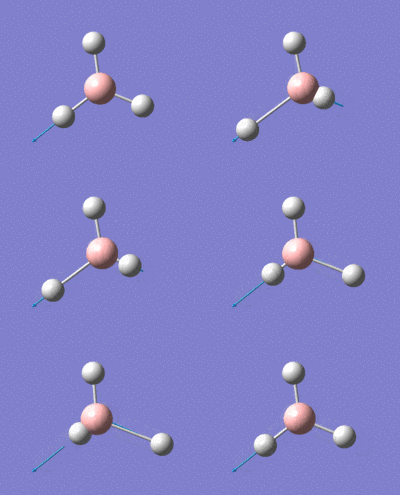
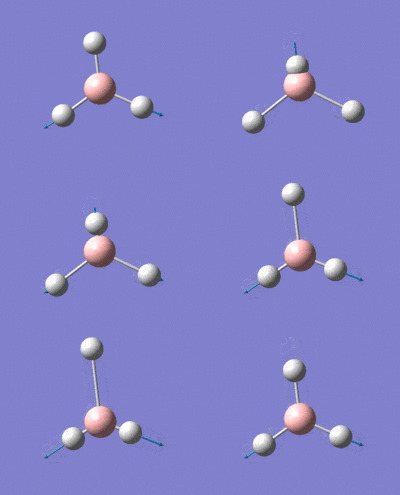
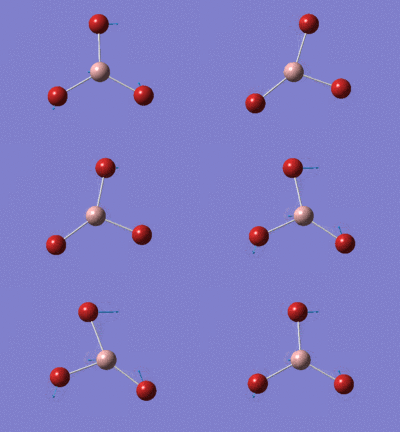
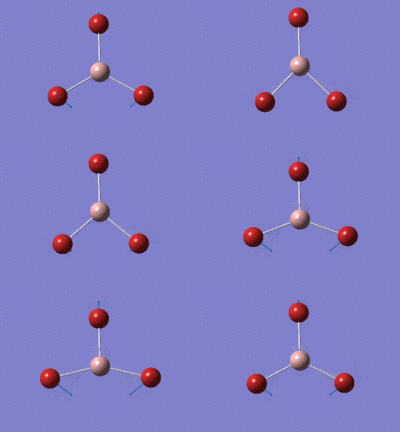
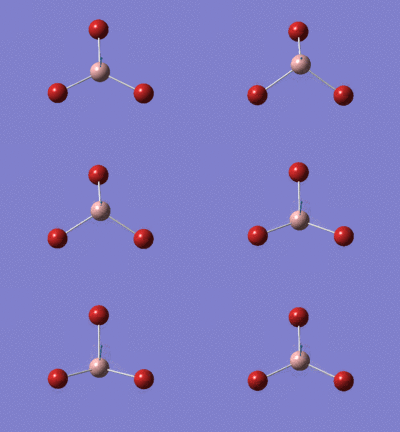
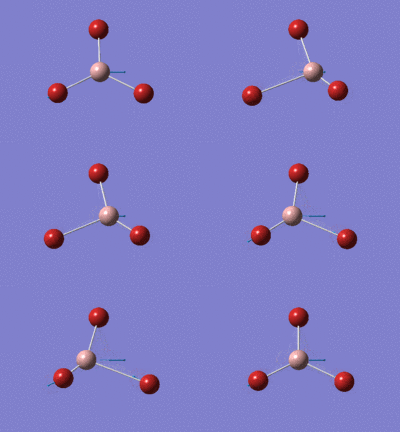
Vibrations
IR Spectrum
Discussion
The IR spectrum of BH3 has three peaks at 1163, 1213, and 2716 cm-1. Based on vibration analysis, there are two vibrations each at 1213 and 2716 cm-1. As these are at the same frequency, they appear in the IR spectrum as a single peak. There is also a sixth vibration with a frequency of 2583 cm-1. However, the intensity of this vibration is 0 and as a result, does not appear in the IR spectrum. For a vibration to be IR active, a change in dipole moment is needed. In this vibration mode, the 3 H atoms are moving towards and away from the central B atom in a synchronised fashion, resulting in no net change of dipole. Hence, this vibration does not appear in the IR spectrum as a peak.
GaBr3
The log file for the GaBr3 frequency analysis can be found here
The D-space link can be found here
Summary of calculation details
File type: .log
Calculation type: FOPT
Calculation method: RB3LYP
Basis set: LanL2DZ
Final energy: ‑41.70082783 a.u.
Gradient: 0.00000011 a.u.
Dipole moment: 0.00 Debye
Point group: D3h
Time taken for calculation: 11.2 s
         Item               Value     Threshold  Converged?
 Maximum Force            0.000000     0.000450     YES
 RMS     Force            0.000000     0.000300     YES
 Maximum Displacement     0.000002     0.001800     YES
 RMS     Displacement     0.000001     0.001200     YES
 Predicted change in Energy=-6.142862D-13
 Optimization completed.
    -- Stationary point found.
The calculations are complete as the forces and displacement have converged.
Frequencies
 Low frequencies ---   -0.5252   -0.5247   -0.0024   -0.0010    0.0235    1.2010
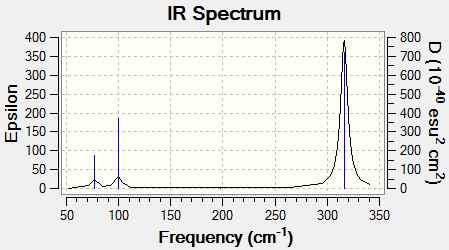
 Low frequencies ---   76.3744   76.3753   99.6982
The low frequencies obtained are between ±15 cm-1. The calculation is complete as the frequencies obtained are positive, showing that a minimum point has been obtained.
The lowest "real" normal mode here is E' (76 cm-1).
Vibrations
IR Spectrum
Comparison of Molecular Vibrations
Discussion
The frequency of a bond is related proportional to the squareroot of the force constant of the covalent bond, and inversely proportional to the squareroot of the reduced mass of the two atoms of the bond. Comparing the mass of BH3 and GaBr3, Ga and Br have much higher atomic masses of 69.7 and 79.9 respectively, as compared to B and H (10.8 and 1.0 respectively). This would result in a higher reduced mass for GaBr3 and hence lower frequency. In addition, based on calculation of bond distance, the Ga-Br bond distance is longer than that for B‑H. Consequently, the Ga-Br bond would be weaker and hence, have a smaller force constant than the B‑H bond. As frequency is proportional to the squareroot of the force constant of the covalent bond, the smaller force constant of the Ga-Br bond results in GaBr3 having a much lower value of frequencies than BH3.
Between BH3 and GaBr3, there has been a slight reordering of the vibration modes. In BH3, the A2" mode has the lowest frequency, followed but the two E' modes. In GaBr3, these two modes have swapped, and the two degenerate E' modes have the lowest frequency, followed by the A2".
In the IR spectra of BH3 and GaBr3, although the frequencies are very different, there are several similarities. Firstly, both spectra have 3 peaks although 6 vibrations have been calculated. This is attributed to the presence of 2 sets of 2 degenerate vibration modes (both E') which have the same frequency. The vibration modes with the same frequency appear as a single peak. Also, for both compounds, the A1' mode has an intensity of 0 and as a result, is not observed in the IR spectrum. Secondly, in both spectra, the frequency of the E' mode corresponding to the bond stretching vibration mode has the highest intensity and hence, strongest peak in the IR spectra. The other two peaks are relatively much weaker in both spectra.
The A1' mode corresponds to symmetric stretching while the other two E' modes correspond to antisymmetric stretching vibration modes. The A2" mode corresponds to the wagging vibration mode while the two E' modes correspond to the scissoring vibration mode. These bending vibrations are of a lower frequency than stretching vibrations. More energy is required to cause the stretching of the bond, which would result in a change in bond distance.
When optimising a structure, the Schrödinger equation is solved at different points until a stable point is reached. Through this process, the structure is adjusted along the potential energy surface to look for the minimum point. Frequency analysis is then carried out by taking the second derivative of the potential energy surface to ensure that the stable point on the potential energy surface, determined by the optimisation, is in fact a minimum point. The method and basis set define the potential energy surface, which would affect the result obtained from the optimisation and subsequently, frequency analysis. Consequently, for comparisons between the optimisation and frequency analysis of different molecules to be valid, the same method and basis set must be used.
Positive frequency values confirm that the point obtained is indeed a minimum. Additionally, frequency analysis enables the IR spectrum to be predicted by providing data of the frequencies and intensities of the various vibration modes present in the molecule.
In determining the number of vibrational modes present in a molecule, the formula 3N‑6 (or 3N‑5 for linear molecules) is used. The "low frequencies" reported represent the translational and rotational degrees of freedom and relate to the motion of the nuclei in the molecule. There are 3 translational degrees of freedom (x, y, and z direction), and 3 (2 for linear molecules) rotational degrees of freedom, giving rise to the "‑6" in the equation.
MO Orbitals of BH3
The D-space link can be found here
MO Diagram of BH3
Discussion
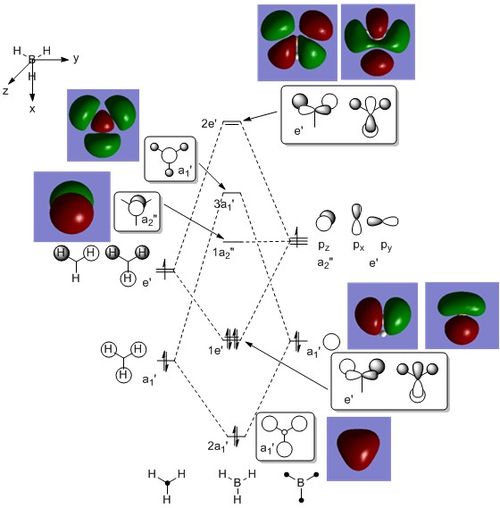
The MOs obtained from LCAO and from computation are very similar with no significant differences, suggesting that qualitative MO theory can be relatively accurate and useful. The MOs calculated from computation also had a 1s orbital, which is not shown here.
NH3
6-31G(d,p) Optimisation
The log file for the NH3 optimisation can be found here
Summary of calculation details
File type: .log
Calculation type: FOPT
Calculation method: RB3LYP
Basis set: 6‑31G(d,p)
Final energy: ‑56.55776872 a.u.
Gradient: 0.00000010 a.u.
Dipole moment: 1.85 Debye
Point group: C1
Time taken for calculation: 20.0 s
         Item               Value     Threshold  Converged?
 Maximum Force            0.000000     0.000002     YES
 RMS     Force            0.000000     0.000001     YES
 Maximum Displacement     0.000001     0.000006     YES
 RMS     Displacement     0.000000     0.000004     YES
 Predicted change in Energy=-1.239175D-13
 Optimization completed.
    -- Stationary point found.
The calculations are complete as the forces and displacement have converged.
Optimised N-H bond distance: 1.02 Å
Optimised H-N-H bond angle: 105.7 °
The optimised N-H bond distance is similar to that reported in literature, which is 1.012 Å. [1] The bond angle of 105.7 ° corresponds to its trigonal pyramidal shape.
Frequency Analysis
The log file for the NH3 frequency analysis can be found here
The D-space link can be found here
Summary of calculation details
File type: .log
Calculation type: FOPT
Calculation method: RB3LYP
Basis set: 6‑31G(d,p)
Final energy: ‑56.55776872 a.u.
Gradient: 0.00000030 a.u.
Dipole moment: 1.85 Debye
Point group: C1
Time taken for calculation: 20.7 s
         Item               Value     Threshold  Converged?
 Maximum Force            0.000001     0.000002     YES
 RMS     Force            0.000000     0.000001     YES
 Maximum Displacement     0.000001     0.000006     YES
 RMS     Displacement     0.000001     0.000004     YES
 Predicted change in Energy=-7.237411D-13
 Optimization completed.
    -- Stationary point found.
The calculations are complete as the forces and displacement have converged.
 Low frequencies ---   -7.8555   -6.1330   -3.6334   -0.0017   -0.0017   -0.0011
 Low frequencies --- 1089.3462 1693.9237 1693.9283
The low frequencies obtained are between ±15 cm-1. The calculation is complete as the frequencies obtained are positive, showing that a minimum point has been obtained.
MO Analysis
The log file for the GaBr3 frequency analysis can be found here
The D-space link can be found here
NBO Analysis
Charge distribution
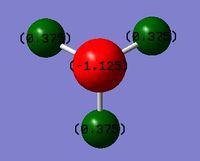
Charge range: ‑1.125 to 1.125
NBO charge for N: ‑1.125
NBO charge for H: 0.375
Association Energies: Ammonia-Borane
Optimisation
The log file for the NH3NH3 optimisation can be found here
Summary of calculation details
File type: .log
Calculation type: FOPT
Calculation method: RB3LYP
Basis set: 6‑31G(d,p)
Final energy: ‑83.22468911 a.u.
Gradient: 0.00000009 a.u.
Dipole moment: 5.56 Debye
Point group: C1
Time taken for calculation: 45.0 s
         Item               Value     Threshold  Converged?
 Maximum Force            0.000000     0.000002     YES
 RMS     Force            0.000000     0.000001     YES
 Maximum Displacement     0.000000     0.000006     YES
 RMS     Displacement     0.000000     0.000004     YES
 Predicted change in Energy=-1.596803D-14
 Optimization completed.
    -- Stationary point found.
The calculations are complete as the forces and displacement have converged.
Frequency Analysis
The log file for the NH3NH3 frequency analysis can be found here
The D-space link can be found here
Summary of calculation details
File type: .log
Calculation type: FOPT
Calculation method: RB3LYP
Basis set: 6‑31G(d,p)
Final energy: ‑83.22468911 a.u.
Gradient: 0.00000021 a.u.
Dipole moment: 5.56 Debye
Point group: C1
Time taken for calculation: 1 min 44.8 s
         Item               Value     Threshold  Converged?
 Maximum Force            0.000000     0.000002     YES
 RMS     Force            0.000000     0.000001     YES
 Maximum Displacement     0.000001     0.000006     YES
 RMS     Displacement     0.000000     0.000004     YES
 Predicted change in Energy=-5.986405D-13
 Optimization completed.
    -- Stationary point found.
The calculations are complete as the forces and displacement have converged.
 Low frequencies ---   -2.8575   -1.2261   -0.0010   -0.0007    0.0009    3.5954
 Low frequencies ---  263.3617  632.9765  638.4464
The low frequencies obtained are between ±15 cm-1. The calculation is complete as the frequencies obtained are positive, showing that a minimum point has been obtained.
Energy Analysis
E(NH3) = ‑56.55776872 a.u.
E(BH3) = ‑26.61532364 a.u
E(NH3BH3) = ‑83.22468911 a.u.
ΔE = E(NH3BH3) - [E(NH3) + E(BH3)] = ‑0.05159675 a.u.
1 a.u. = 2625.5 kJ/mol
ΔE = ‑0.05159675 × 2625.5 = ‑135.4672671 kJ/mol
Dissociation energy = ‑135.4672671 kJ/mol
The bond dissociation energy obtained here falls within the typical range of bond dissociation energies for a single bond dissociation energies (about 100 to 500 kJ/mol). This also indicates that the association between ammonia and borane is relatively weak.


