Rep:Mod:lg1109mod3
The Cope Rearrangement
Introduction
The Cope rearrangement reaction[1] involves 1,5-hexadiene which undergoes the [3,3]-sigmatropic shift rearrangement. It was first developed by Arthur Cope in the early 1900's. In this module, the reaction is investigated and analyzed using computational methods. The aim is to determine whether the reaction would occur via a "chair" or a "boat" transition state structure with the lowest energy conformations. The literature states that the "chair" transition state is generally observed in lower energy than the "boat". The concerted mechanism is shown below.

Optimising the Reactants and Products
For 1,5-hexadiene, there are several possible conformations exist owing to the free rotation of the C-C single bonds. Among these structures, it is found that antiperiplanar and gauche conformations have relative low energies. However, it is difficult to further compare among these ten staggered structures if they are not closely examined. They are always affected by various factors such as repulsions, orbital interactions, etc. Therefore, the ten structures are investigated, including four anti and six gauche ones. These structures are first drawn on GaussView 5.0 program, followed by the correction of CLEAN function. The obtained molecules are then submitted to optimisation using Hartree-Fock method with 3-21G default basis set. The %men is also changed to 250MB. The results are summarized in the table below with attached 3D structures and assigned point groups.
| Conformation of Molecules | Point Group | Total Energy (Ha) | Relative Energy (kcal mol-1) | LOG File Link |
|---|---|---|---|---|
| Anti1 | C2 | -231.69260 | 0.04 | DOI:10042/to-58361 |
| Anti2 | Ci | -231.69254 | 0.08 | DOI:10042/to-58297 |
| Anti3 | C2h | -231.68907 | 2.25 | DOI:10042/to-58365 |
| Anti4 | C1 | -231.69097 | 1.06 | DOI:10042/to-58371 |
| Gauche1 | C2 | -231.68772 | 3.10 | DOI:10042/to-58312 |
| Gauche2 | C2 | -231.69167 | 0.62 | DOI:10042/to-58304 |
| Gauche3 | C1 | -231.69266 | 0.00 | DOI:10042/to-58307 |
| Gauche4 | C2 | -231.69153 | 0.71 | DOI:10042/to-58372 |
| Gauche5 | C1 | -231.68962 | 1.91 | DOI:10042/to-58382 |
| Gauche6 | C1 | -231.68916 | 2.20 | DOI:10042/to-58383 |
The energies are converted to kcal/mol by the equation 1 Ha=627.5 kcal/mol.
According to the table, it is clearly found that Gauche 3 is the most stable conformer with the lowest energy of -231.69266 Ha. This is quite surprising as it is contradictory to the theory[2] which states the antiperiplanar arrangement should be in the lowest energy state. This is because for antiperiplanar, the orbital alignment is more favourable than for gauche, which results in better orbital overlap, hence stabilising the whole molecule.
Anti 2 conformer, as one of the antiperiplanar conformers with relative low energy, is chosen to be further compared with Gauche 3 through DFT/B3LYP optimisation with a 6-31G(d) default basis set. The relative energies listed are the results from the comparison to the total energy of Anti 1 which has the lowest energy by DFT method. By choosing the more sophisticated optimising method, a more accurate result is expected. The results of higher level calculations are illustrated in the table below with corresponding 3D structures.
| Conformation of Molecules | Point Group | Total Energy (Ha) | Relative Energy (kcal mol-1) | LOG File Link |
|---|---|---|---|---|
| Anti2 | Ci | -234.61170 | 0.04 | DOI:10042/to-58411 |
| Anti2 | C1 | -234.61133 | 0.29 | DOI:10042/to-58424 |
Referring to the table above, it has been proven that the Anti 2 conformer has lower energy than Gauche 3 which is more stable as a whole. This agrees with the theory. The allyl groups in antiperiplanar have good orbital overlaps which are not observed in Gauche 3. In addition, the steric strain resulting from the two large allyl groups is much smaller in anti conformers than in gauche ones. On the other hand, the results predicted by DFT-B3LYP/6-31(d) method are overall 3 Ha lower than by HF/3-21G method. The results predicted by the two methods are actually very similar in geometries. Greater differences would be obtained for each method if larger molecules are accounted for.
Frequency Analysis
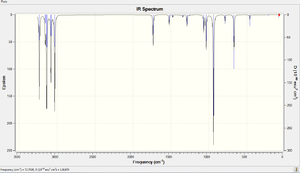
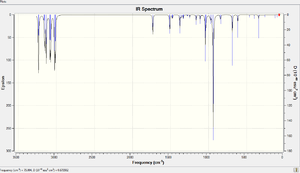
A vibrational analysis is carried out using the DFT-B3LYP/6-31(d) based method to determine whether an energy minima is obtained for each of the conformations. If there are no negative vibrational peaks, the energy minima is reached and vice versa. The predicted IR spectra for anti 2 and gauche 3 are attached below.
 |
 |
|---|
According to the spectra, there is no single negative frequency found for either conformations indicating the structures are optimised to an energy minimum. The expected modes of vibrations are all displayed clearly which correlates to the C-H and C-C stretching as well as bending modes. The C=C alkene double bonds, occur at around 1700 cm-1, contain vital information about the molecules. These peaks result from the symmetric and asymmetric stretching vibrations of the double bonds which are listed in the table below.[3]
Comparing to the literature values, the C=C bonds here have slightly higher wavenumbers but the errors are within the accepted range. This might be explained by the presence of two double bonds in a single molecule which increases the vibrational modes of stretching to a larger extent. It is also noticed that the asymmetric modes always occur at higher frequencies.
For gauche conformations, the two vibrational modes are found to be very similar to each other. Nevertheless, the extent of stretching of the C=C double bonds differs significantly. For symmetric stretch, the double bond on one side oscillates much stronger than the double bond on the other side of the molecule. The opposite is true for asymmetric stretch. This might be explained by the low symmetry of the gauche conformation as the observation is not found in the highly symmetrical Anti 2 conformer.
Thermochemical Analysis
The output file of the vibrational analysis can be visualized by WordPad. The thermochemical results for each conformer are listed with specific energies terms. The first term refers to the overall potential energy at 0K as well as the zero-point energy which can be represented using the formula E=Eelec+ZPE. The second term refers to the energy involving the transilational, rotational and vibrational modes at 298.15K and 1atm which can be represented using the formula E=E+Evib+Erot+Etrans. The third term refers to an additional correction for the value of RT in the formula H=E+RT for dissociation reactions. The last term refers to the entropic contribution to the free energy represented in G=H-TS.
ANTI 2 Thermochemical Results (Ha) at 298.15K
Sum of electronic and zero-point Energies=           -234.469212
Sum of electronic and thermal Energies=              -234.461856
Sum of electronic and thermal Enthalpies=            -234.460912
Sum of electronic and thermal Free Energies=         -234.500821
GAUCHE 3 Thermochemical Results (Ha) at 298.15K
Sum of electronic and zero-point Energies=           -234.468693
Sum of electronic and thermal Energies=              -234.461464
Sum of electronic and thermal Enthalpies=            -234.460520
Sum of electronic and thermal Free Energies=         -234.500105
The vibrational analysis for these conformations are also run for low temperatures by changing the setting in the input files. The temperature is actually set to 0.00001K so that the number is small enough to be neglected. Otherwise, the results would still be calculated at 298.15K as 0K in the input file is unrecognized by the program. In order to compare the results on the same basis, the more accurate DFT/B3LYP method is applied through the calculations.
ANTI 2 Thermochemical Results (Ha) at 0.00K
Sum of electronic and zero-point Energies=           -234.468775
Sum of electronic and thermal Energies=              -234.468775
Sum of electronic and thermal Enthalpies=            -234.468775
Sum of electronic and thermal Free Energies=         -234.468775
GAUCHE 3 Thermochemical Results (Ha) at 0.00K
Sum of electronic and zero-point Energies=           -234.468256
Sum of electronic and thermal Energies=              -234.468256
Sum of electronic and thermal Enthalpies=            -234.468256
Sum of electronic and thermal Free Energies=         -234.468256
According to the results, it can be seen that the four terms give out identical values which might due to the absence of thermal contributions to the potential energy at 0K. As temperature decreased, the total energy of the systems stabilise except for the free energy term. This can be explained according to the equation G=H-TS. As the temperature decreases, the Gibbs Free Energy of the system would increase due to their negative correlations. In order to further investigate the trend of vibrational frequencies, more results at different temperatures can be tested.
Optimising the "Chair" and "Boat" Transition Structures
In this part, we are going to look closely into the transition states of the Cope Rearrangement reaction which apparently exist in two forms, chair and boat structures. These two transition states are shown as below.

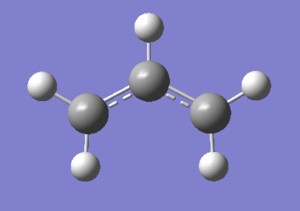
To start with, an allyl fragment CH2CHCH2 is drawn using GaussView 5.0 and optimised by HF/3-21G method. The allyl fragment is a very simple molecule. As a result, the low level of optimisation method is enough to determine the energy minima. The structure of the allyl fragment is illustrated below.
Chair Conformation
A chair transition state is obtained by placing the two optimised allyl fragments vertically above each other with the both terminal carbons approximately 2.2Å apart. The hydrogen atoms attached to the central carbons of the two fragments point in the opposite directions. This is our guessed structure of the chair transition state. It is then subjected into optimisation by the two following methods. The first method is easy which involves computing the force constant Hessian matrix at the beginning of the optimisation and being updated in the process. The second option is to freeze the reaction coordinate using the redundant coordinate editor and carry out the optimisation on the rest of the molecule. This is followed by relaxation of the coordinates for further optimisation.
Method A: The guessed structure is carried out by Opt+Freq method using the HF/3-21G setting. The option is changed to Optimization to a TS(Berny) and the force constant is calculated once. The additional keyword "Opt=NoEigen" is also typed in the box. The optimised chair structure is shown in the 3D view below.
Chair TS |
After the optimization, it is observed that the hydrogen atoms attached to the terminal carbons are slightly bented out of the plane. This is due to the steric repulsion exists when the two allyl fragment are brought together. On the other hand, the interatomic distances between the terminal carbon atoms are reduced from 2.2Å to 2.02Å.
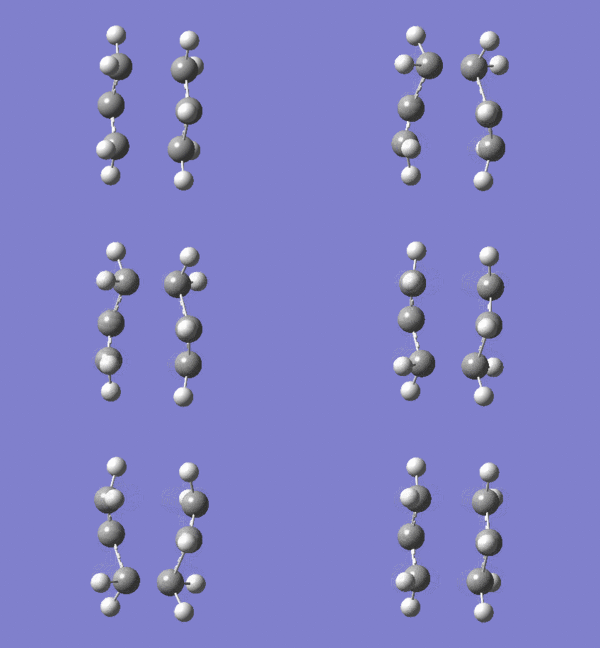
From the vibrational analysis, an imaginary frequency occurs at -818 cm-1 is reported. This matches the asynchronous bond formation of the transition state whereas one bond breaks and the other bonds forms at the same time. An temporary energy maximum on the potential energy curve is obtained. The imaginary mode is shown in the animation below.
Method B: The guessed structure is again used in order to start with. The Redundant Coord Editor is applied to freeze the distance of both sets of terminal carbons to exactly 2.2Å and optimised under HF/3-21G method. The obtained 3D frozen structure is shown in the link. The structure is then unfreezed again using the Redundant Coord Editor but with the bonds set to derivative this time. The optimization carried out under normal Hessian method with 3-21G basis set. The obtained 3D unfrozen structure can be viewed in the link. Looking closely into the molecule, the interatomic distances between the terminal carbon atoms again are reduced from 2.20Å to 2.02Å and the imaginary vibrational mode occurs at the exactly same frequency -818 cm-1 with slightly different intensity. This further confirms that the structure is optimised to a transition state which is an potential energy maximum.
Comparing the two methods, the results produced are pretty much the same which indicate that both methods are reliable for this relative simple molecule. The advantage of the second method relies on the differentiation of the reaction coordinates which would give greater difference for more complicated molecules.
Boat Conformation
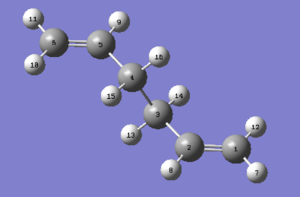
A boat transition state is analyzed by QTS2 method which both the reactant and product are specified. The Anti 2 conformer from Appendix 1 is used here as the reactant as well as the product by rotating the molecule in the GaussView. Each atoms are labelled according to the requirements and shown in the fugures below.
 |
 |
|---|
The QST2 calculation is set up by selecting TS(QST2) option. After the submittion, the optimization of the strucutre failed as the rotations around the central C-C bonds are not taken into consideration. The obtained failed structure is shown below.
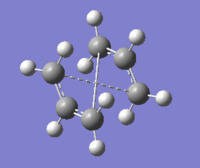
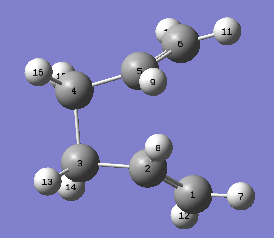
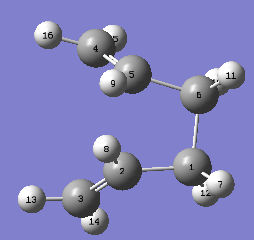
Therefore, the rotations of the bonds are required to be achieved manually so that the transition state can be reconstructed. This is done by changing the central C-C-C-C dihedral angle to 0°, followed by changing the dihedral angles of the two pairs of triatomic carbon backbone to 100°. The altered structures are displayed below.
 |
 |
|---|
The optimisation performs well this time. The resultant vibration mode shows the existence of an imaginary frequency at -840 cm-1 with the intensity of 1.6. This confirms that the transition state are successfully determined. On the other hand, the terminal carbon bond distances are found to tbe 2.14Å. The figure below displays the imaginary vibrational mode for the boat transition state.

Summary
This is a summary of the optimisation of the chair and boat transition states which illustrates all the important frequencies and bond lengths.
| Transition State | Frequency (cm-1) | Intensity | LOG File Link |
|---|---|---|---|
| Chair | -818 | 6 | DOI:10042/to-58577 |
| Boat | -840 | 2 | DOI:10042/to-58881 |
| Structure | Method Applied | Bond Length between Terminal Carbons (Å) |
|---|---|---|
| Allyl Fragment | HF/3-21G Optimisation | n/a |
| Chair | TS(Berny) Optimisation | 2.02 |
| Chair | Frozen Coordinate | 2.20 |
| Chair | Unfrozen Coordinate | 2.02 |
| Boat | QST2 | 2.14 |
Intrinsic Reaction Coordinate
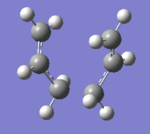
Intrinsic Reaction Coordinate is a method used to follow the minimum energy path from a transition state structure down to the local potential energy minimum. The method is carried out under Gaussian by selecting the IRC option. For chair transition state, the reaction coordinate is computed only in forward direction as the molecule is highly symmetrical. The force constant is set to be calculated once and the number of steps is changed to 50. The initial IRC shows that the chair structure terminates at step 21. The plots of total energy and RMS gradient along IRC are illustrated below together with the structure of the final step.
 |
 |
 |
|---|
By comparing the total energy of the final step structure with the HF optimised one, it is clearly seen that these two values differ largely from each other. This is an indication which tells that the geometry of the transition state has not reached to a minimum. In order to complete the calculation, three options can be taken. The first method is to run a normal Hessian minimisation on the final structure from the IRC calculation. The second method is to restart the IRC calculation and change the number of points along the path to 100 so that the limitation on steps is reduced. The third method is also to restart the IRC calculation but with computing the force constants at every step. All of the three methods are carried out respectively.
The first method produces the structure with total energy -231.69167 Ha with a point group of C2. This corresponds to the information given by Gauche 2 which shows that the optimised conformer is the desired product of the reaction. The results produced by the second method is exactly the same as the initial IRC calculation which are summarized in the end. The increasing of the number of points along the reaction path does not affect the terminal step. The third method does make difference on the result. The reaction pathway is extended to 47 steps. The final structure and the plots are illustrated below.
 |
 |
 |
|---|
Comparing the information with the initial IRC calculation, it can be confirmed that the geometry is optimised to a greater extent.
The IRC calculation is then performed on the boat transition state. As the third method gives more accurate results, it is chosen directly to calculate the force constant "always" with the number of steps retains at 50 steps. The final structure and the plots are illustrated below.
 |
 |
 |
|---|
This time, the number of termination steps increases to 51 with the total energy of -231.60280 Ha. The structure does not resemble to any of the conformers in Appendix 1. This might result from the error occured during the calculation along the path. The information of IRC calculation of both chair and boat transition state are summarised in the table below.
| Conformation | Compute Force Constant | Number of Steps | Terminated Step | Total Energy | RMS Gradient | LOG File |
|---|---|---|---|---|---|---|
| Chair | Once | 50 | 21 | -231.61932 | 0.00005389 | DOI:10042/to-58891 |
| Chair | Once | 100 | 21 | -231.61932 | 0.00005389 | DOI:10042/to-58899 |
| Chair | Always | 50 | 47 | -231.61932 | 0.00005389 | DOI:10042/to-58900 |
| Boat | Always | 50 | 51 | -231.60280 | 0.00009955 | DOI:10042/to-58908 |
The Diels-Alder Cycloaddition
Introduction
The Diels Alder Cycloaddition[4] a well-known type of concerted pericyclic reaction occuring through the [4s+2s] orbital overlap. In particular, the πorbital of an electron poor dienophile forms new bonds by interacting with the πorbital of an electron rich diene. In this part, two specific reactions are investigated by computational approach. Cyclohexene is formed by reacting ethene with cis-butadiene while through Diels Alder maner. The reaction between maleic anhydride and cyclohexadiene is also considered. The reaction scheme of the formation of cyclohexene is illustrated below.

Ethene and cis-Butadiene Cycloaddition
The two reactant cis-butadiene and ethene are produced using GaussView 5.0 and optimised using the AM1 semi-empirical method which is a more accurate method that HF/3-21G. The 3D structures and relative information are summarised in the table below.
| Reactant | Total Energy (Ha) | RMS Gradient | LOG File Link |
|---|---|---|---|
| cis-Butadiene | 0.04880 | 0.000001429 | DOI:10042/to-59022 |
| Ethene | 0.02619 | 0.00003328 | DOI:10042/to-59023 |
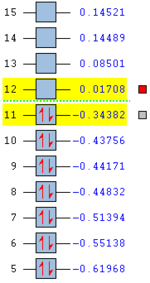
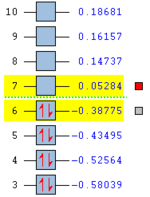
Both of the RMS gradients are very small which suggests the successful optimisation is performed and an energy minima is reached. The molecular orbitals of both reactants can be solved by Schrodinger's equation and visualised as below. The HOMO and LUMO orbitals are predicted as these mesh phases. These orbitals contain important information as they involve in the cycloaddition. The relative energy levels are also shown.
By analysing the symmetry of the orbitals of both reactants, it is confirmed that the HOMO of the diene has the same symmetry as the LUMO of the dienophile. Therefore, it is favourable for these orbitals to interact to form new bonds to obtain an stabilised product.
Optimisation of the Transition State
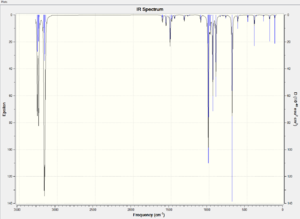
The transition state of the reaction is obtained by placing the optimised cis-butadiene and ethene in the same window in GaussView 5.0. The two molecules are then arranged in an envelope-like structure with the interatomic distance of the terminal carbons fixed at 2.20Å. These terminal distances are frozen using the Redundant Coord Editor as before and the rest of the molecule is optimised under AM1 method. This is followed by the optimisation to a TS(Berny) and unfreezing the coordinates on the same basis of method. The calculation of optimisation and frequency based on DFT/B3LYP method is also carried out as a comparison. The obtained vibrational spectra based AM1 and DFT/B3LYP method are illustrated below. The existence of imaginary peaks confirm that both methods produce the expected transition states.
 |
 |
|---|
These two spectra produced by different methods are quite similar to each other. The information of the transition states are illustrated in the table below with animated vibrational mode of imaginary peaks.
| Transition State | Total Energy (Ha) | RMS Gradient | Point Group | Frequency of Imaginary Peak (cm-1) | Intensity | Direction of Vibrational Mode |
|---|---|---|---|---|---|---|
| AM1 Optimisation | 0.11165 | 0.0000023 | Cs | -956 | 6 |  |
| DFT/B3LYP Optimisation | -234.54390 | 0.00000806 | Cs | -525 | 6 |  |
Another important peak is the lowest positive vibrational mode which is found at 136 cm-1 with intensity of 1 from the DFT optimised spectrum. This results from the rotation of ethene and cis-butadiene in opposite directions along a fixed axis. This oscillation cause asymmetric movement by lengthening one of the new forming σ bonds and shortening the other. The animation is illustrated below.

According to the table above, the imaginary vibrational mode for DFT method oscillates at higher wavenumber than for the AM1 method. The presence of the negative peaks indicates that the transition state is reached. In both cases, the transition states are found to vibrate along the reaction coordinate in a concerted movement which is consistent with the theory.
Analysis of Molecular Orbital
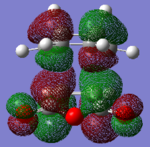
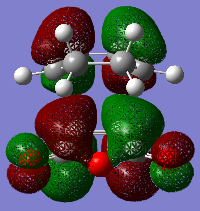
The molecular orbital of the transition states of AM1 and DFT methods are summarised in the table below.
Referring to the table above, the molecular orbitals of the transition state are compared with the orbitals of the reactants under AM1 method. The HOMO of the transition state is obtained by interacting the HOMO of cis-butadiene with the LUMO of the ethene while the LUMO of the transition state is derived from the overlapping of the LUMO of cis-butadiene with the HOMO of ethene. The combinations are consistent with the theory which states that the symmetry of the formed orbitals must be same as the symmetry of the combining orbitals.
Maleic Anhydride and Cyclohexadiene Cycloaddition
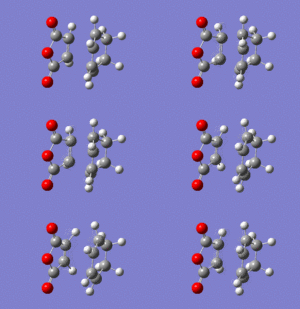
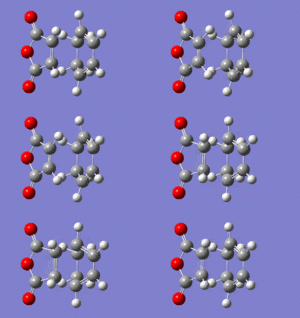
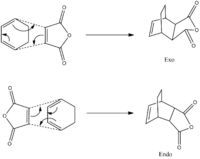
The reaction of maleic anhydride with cyclohexadiene also undergoes Diels Alder cycloaddition. It forms two isomer structures, endo- and exo-. The endo- product is kinetically favourable with lower activation energy while the exo- product is thermodynamically more favourable with the most stable energy levels. The reaction scheme is illustrated in the figure below.
To start with, the structures of the reactants are drawn in GaussView 5.0 and optimised again using the AM1 semi-empirical method. The 3D structures and relative information are summarised in the table below.
| Reactant | Total Energy (Ha) | RMS Gradient | Point Group | LOG File Link |
|---|---|---|---|---|
| Cyclohexadiene | 0.02771 | 0.00000562 | C2 | DOI:10042/to-59106 |
| Maleic | -0.1218 | 0.00003683 | C2v | DOI:10042/to-59107 |
Both of the RMS gradients are close to zero which suggests the successful optimisation is performed and an energy minima is reached. The molecular orbitals of both reactants can be solved by Schrodinger's equation and visualised as below. The relative energy levels are also shown.
The HOMO of cyclohexadiene is observed to be anti symmetric with respect to the plane of reflection of the molecule. On the other hand, the LUMO of maleic anhydride is symmetric with respect to the same plane.
Optimisation of the Transition State
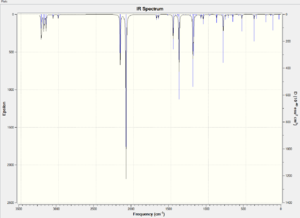
The analysis of transition states of the reaction between maleic anhydride and cyclohexadiene is carried out in similar approach as the cycloaddition of ethene and cis-butadiene. The interatomic distances of corresponding carbons of the two isomers are frozen to be 2.20Å using the Redundant Coord Editor. The structures are optimised and unfrozen using the same method as above. The calculations of optimisation and frequency based on DFT/B3LYP method are also carried out as a comparison. The obtained vibrational spectra based AM1 method for both isomers are illustrated below.
 |
 |
|---|
The information obtained from both optimisation methods are gethered in the table below.
| Transition State | Total Energy (Ha) | RMS Gradient | Point Group | LOG File Link |
|---|---|---|---|---|
| Endo- | -0.05150 | 0.00000195 | Cs | DOI:10042/to-59240 |
| Exo- | -0.05042 | 0.00000074 | Cs | DOI:10042/to-59241 |
| Endo- | -612.68340 | 0.00000445 | Cs | DOI:10042/to-59242 |
| Exo- | -612.67931 | 0.00001138 | Cs | DOI:10042/to-59243 |
According to the table, it can be observed that the endo isomer has lower total energy in both methods which confirms that it is the thermodynamically favourable product. Vibrational analysis is carried out for both isomers to determine whether they are in the transition states. The table below illustrates the information from the spectra for both isomers under AM1 method.
For both isomers, one imaginary peak is found for each transition state with similar wavenumber and distinct intensities. The presence of the negative peaks indicates that the transition states are actually reached. The concerted movements are found in endo- vibrations.
Analysis of Molecular Orbital
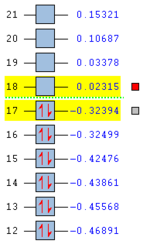
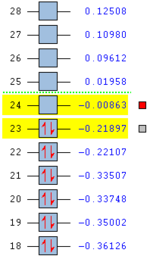
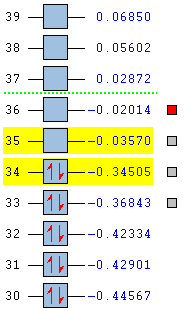
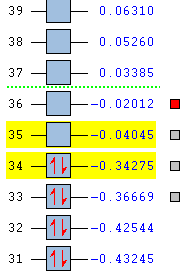
The important molecular orbitals and their corresponding energy level diagrams of the transition states of both endo- and exo- forms under AM1 method are summarised in the table below.
 |
 |
|---|
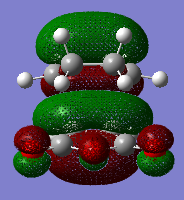
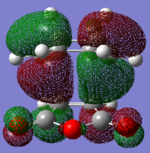
Referring to the table above, the molecular orbitals of the transition state of both isomers are compared with the orbitals of the reactants under AM1 method. For endo- transition states, the symmetry of HOMO-1, HOMO, LUMO and LUMO+1 are symmetric, anti symmetric, symmetric and anti symmetric respectively according to the same plane. For exo- transition states, the symmetry of HOMO-1, HOMO, LUMO and LUMO+1 are also symmetric, anti symmetric, symmetric and anti symmetric respectively according to the same plane. The obtained orbitals follow rules of combination where the symmetry of the formed orbitals must be same as the symmetry of the combining orbitals. The representations of the additional orbitals of the isomers are listed which are all combined by the HOMO and LUMO of the reactants.
Endo-(HOMO-1)=Cyclohexadiene(LUMO)+Maleic Anhydride(HOMO)
Endo-(LUMO+1)=Cyclohexadiene(LUMO)+Maleic Anhydride(HOMO)
Exo-(HOMO-1)=Cyclohexadiene(LUMO)+Maleic Anhydride(HOMO)
Exo-(LUMO+1)=Cyclohexadiene(LUMO)+Maleic Anhydride(HOMO)
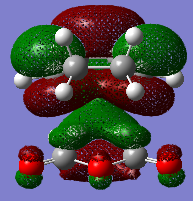
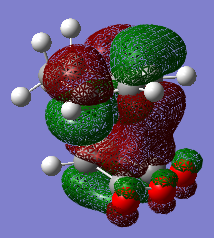
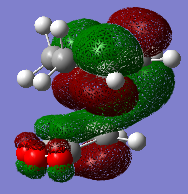
The sideview of LUMO+1 MOs for both endo and exo transition states can attached below.
 |
 |
|---|
This allows close examination of the secondary orbital interaction which can be used to determine the regioselectivity of the reaction. The LUMO of cyclohexadiene has much stronger interaction with the carbonyl groups of the maleic anhydride part of the endo- transition state than of the exo- transition state. This contributes to the stabilisation of the product.
Intrinsic Reaction Coordinate
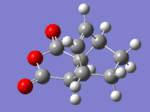
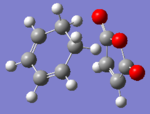
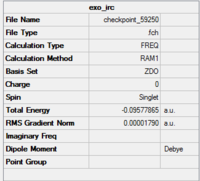
IRC calculations are run for both transition states. The operations are carried out under settings including computing the reaction coordinates in both directions with 100 numbers of steps and calculating the force constant at each step under AM1 method. The endo- and exo- transition states terminate at step 125 and step 110 respectively. The obtained final structure and plots are illustrated below.
 |
 |
 |
|---|
 |
 |
 |
|---|
The summary of the final steps of both transition states are also shown.
 |
 |
|---|
The overall results confirms that the endo has a lower total energy but a relative high transition state while the exo has a lower transition state but a higher product energy level. These observation have good agreement with the theory for which the endo- product is more thermodynamically favourable.
Conclusion
The transition states in the reaction are always unstable as they are high in energy. Therefore, it is difficult to investigate in normal sense. However, with the application of computational analysis, it becomes much easier for researchers to examine the transition states along the reaction paths. In this module, the Cope Rearrangement and the Diels Alder reaction are analyzed in full detail with the application of HF, DFT and AM1 methods. The results obtained have good consistency with the literatures. Overall, computational analytical methods are powerful tool.


