Rep:Mod:lg1109mod2
BH3 Molecule Analysis
Geometry Optimisation
A BH3 molecule of trigonal planar geometry was created using Gaussview 5.0 and optimised by B3LYP DFT method with 3-21G as the basis set. This is a very quick calculation carried out by Gaussian 09W of finding the optimum configuration of the molecule with a low level of accuracy in terms of the setups. B3LYP applies Hartree-Fock methodology to the exchange correlation terms to produce hybrid functions and solves Schrodinger equation for the electron density. [1] As more accurate basis set applying to the molecules, the time taken for the calculations will increase. The optimisation of the molecule tries to obtain a minima point on the potential energy surface which has the gradient of energy equals to zero. The B-H bond length was initially set to 1.5Å. File:BH3 OPT.LOG
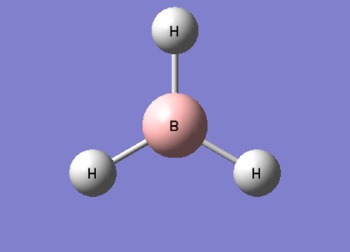
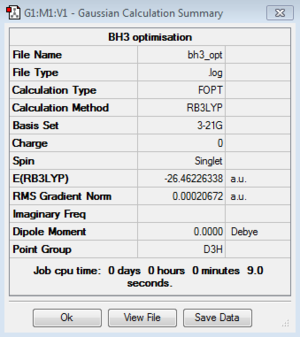
The optimised structure of the molecule and its summary are shown below.
 |
 |
|---|
After optimisation, it is observed that the B-H bond lengths are all changed to 1.19Å while the H-B-H bond angles have the value of 120°. It has good consistency with the literature value which indicates the bond length should be 1.19Å and the bond angle is 120°. The dipole moment of the molecule is found to be 0.00 Debye which refers to a highly symmetrical structure with a point group of D3h.
The output LOG file can be opened with Wordpad and the information of the molecule is provided with text based. All the parameters are converged and the root-mean-squared gradient reported is less than 0.001 which is a good indication of the completion of the optimisation process and the determination of the energy minima as well.
      Item               Value     Threshold  Converged?
Maximum Force            0.000413     0.000450     YES
RMS     Force            0.000271     0.000300     YES
Maximum Displacement     0.001610     0.001800     YES
RMS     Displacement     0.001054     0.001200     YES
Predicted change in Energy=-1.071764D-06
Optimization completed.
   -- Stationary point found.
| Optimisation Step 1 | Optimisation Step 2 | Optimisation Step 3 | Optimisation Step 4 |
|---|---|---|---|
 |
 |
 |
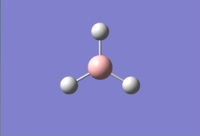 |
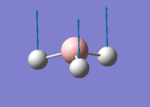
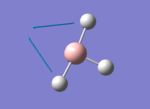
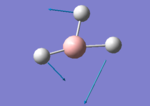
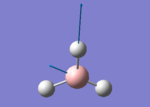
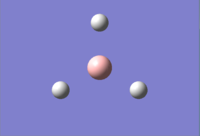
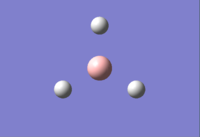
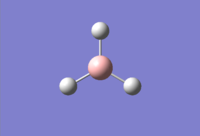
The optimisation procedure has been through four steps of iterative cycles to achieve a minimisation of the gradient. The calculation of the bond lengths and bond angles are also listed in the file which are report to be 120.0°and 1.1935Å.
                          ----------------------------
                          !   Optimized Parameters   !
                          ! (Angstroms and Degrees)  !
--------------------------                            --------------------------
! Name  Definition              Value          Derivative Info.                !
--------------------------------------------------------------------------------
! R1    R(1,2)                  1.1935         -DE/DX =    0.0004              !
! R2    R(1,3)                  1.1935         -DE/DX =    0.0004              !
! R3    R(1,4)                  1.1935         -DE/DX =    0.0004              !
! A1    A(2,1,3)              120.0            -DE/DX =    0.0                 !
! A2    A(2,1,4)              120.0            -DE/DX =    0.0                 !
! A3    A(3,1,4)              120.0            -DE/DX =    0.0                 !
! D1    D(2,1,4,3)            180.0            -DE/DX =    0.0                 !
--------------------------------------------------------------------------------
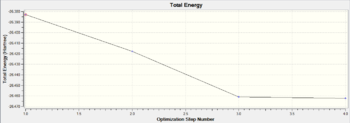
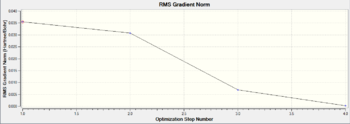
The stabilised energy and minimised gradient can also be understood in the form of the graphic plots as below. The plot of Total Energy refers to the change in energy of the molecular system with respect to the process of the optimisation while the plots of RMS Gradient refers to the first derivative, in other words, the rate of change of the molecular energy during the calculations. These graphs give good illustrations of how total energy and RMS gradient decrease as the iteration goes on because a better optimisation is obtained for each successive step. It is easy to see that for the first two steps of the optimisation, the B-H bonds are not displayed by Gaussian. This is because the bond lengths calculated are greater than the default set of the program for the diatomic bondings of borane. The bonds definitely exist, just not be shown.
 |
 |
|---|
Frequency Analysis
Vibrational analysis is carried out on the molecule so that the degree of optimisation can be investigated. The optimised molecule would either be in the ground state with a global minima or in a transition state with the presence of negative vibrational frequencies. The IR spectrum of the optimised molecule are predicted using Gaussian by B3LYP DFT method with a 3-21G basis set. It is important to apply the same calculation method and basis set as previous procedures. File:GELIN BH3 FREQ.LOG
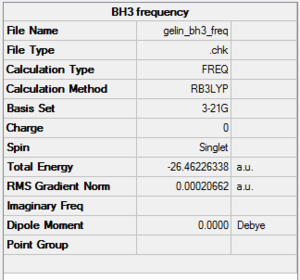
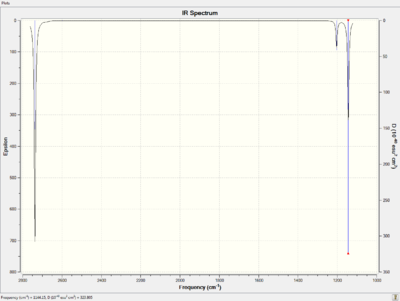
The predicted IR spectrum and the summary are shown below.
 |
 |
|---|
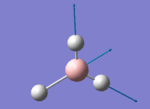
There are six important vibrational modes determined from the spectrum. All of these modes are assigned and described in detail as shown in the table below.
According to the IR spectrum of BH3 molecule, only three vibrational mode are observed which is contradictory with the assigned six stretches. The possible explanation for this could be the degeneration of the two pairs of E' modes. If that is the case, the degenerated vibrations will appear at the same IR frequencies. On the other hand, the A1' vibration is absent from the spectrum which results from the highly symmetric motion. No change in dipole moment gives no peak on the spectrum. The peaks in the finger print region of the spectrum are relative more close to the literature values with percentage difference low than 1%. The overall frequencies have good agreement with the literature values and are in the acceptable percentage difference. Moreover, there is no negative vibrational frequency observed which indicates that the molecule exists in the ground state.
Molecular Orbitals Analysis
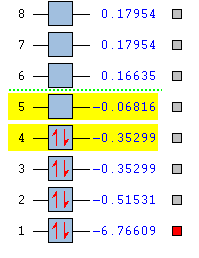
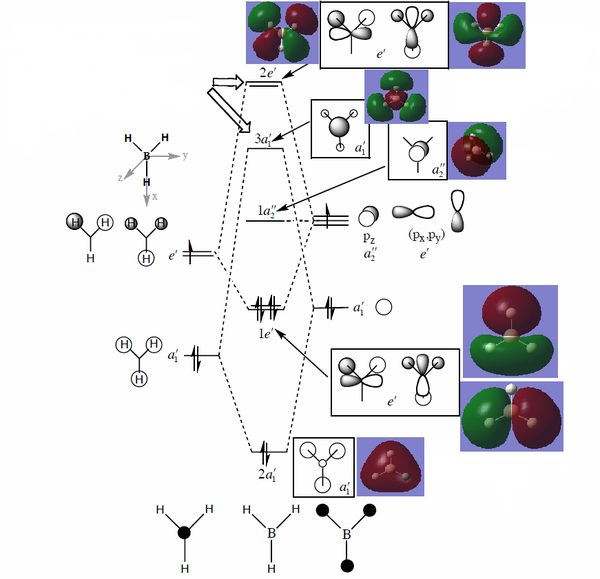
The molecular orbital of the optimised BH3 structure is predicted using HPC by a B3LYP method with 3-21G basis set. The additional keyword "pop=full" and the selection of "Full NBO" opens the MO option. The first eight energy levels and their populations are investigated and listed below. (DOI:10042/to-57065 )
 |
 |
|---|
A full molecular orbital diagram is obtained by linear combination of molecular orbital with the same symmetry. The two fragments used in this MO is the trigonal planar fragment H3 orbital and the atomic boron orbital. By comparing the electronegativity of boron and hydrogen fragment, it is easy to find that boron is slightly more electropositive. Therefore, when allocating the energy levels, the boron atomic orbital should be placed in slightly higher energy. After successfully mixing the orbitals of the two fragments with the same symmetry, electrons are filled up from the lowest energy levels. The energy of 1s atomic orbital of boron is very low so that it does not participate the orbital mixing though it has a1' symmetry. According to the energy levels shown above, the fourth energy level is the HOMO and the fifth energy level is the LUMO.
On the full MO diagram, the predicted mixed 3D orbitals are placed together with the theoretical orbitals. The program predicted that 2e' anti-bonding orbitals are degenerate and are in lower energy than 3a1. It is easy to explain the observation by considering the overlaps of these orbitals. The 2e' orbitals has two pairs of weak anti-bonding making the whole system lower in energy while the 3a1' orbital has three pairs of strong anti-bonding, making the entire system destabilised to the most extent.
The HOMO is also a double degenerated orbital while the LUMO is the unmixed pz orbital with a a2" symmetry label. The low-lying LUMO makes the molecule Lewis acidic which is easy to accept a pair of electrons from the higher energy HOMO of other molecules.
By the calculation of Gaussian, the MO diagram provides great information about the molecule structure. Although they are not physical quantities, it gives vital visualisation and illustration of the bond as well as the reactivity of the molecule.
Natural Bond Orbitals Analysis
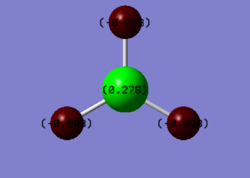
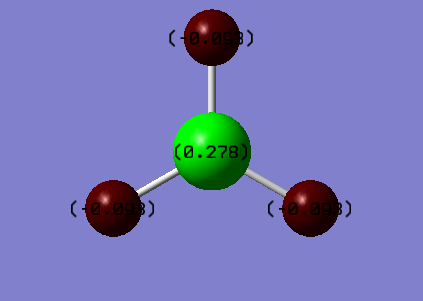
The natural bond orbitals (NBO) and charge distribution are also provided by the Gaussian calculation. According to the figure above, the dark red colour refers to highly negative atoms and the bright green refers to the positive boron centre which results from the great Lewis acidity explain in the MO analysis. This observation also has good consistency with the Pauling electronegativity principle. The information of NBO analysis is detailed in the text file below.
Summary of Natural Population Analysis:

                                      Natural Population
               Natural  -----------------------------------------------
   Atom  No    Charge         Core      Valence    Rydberg      Total
-----------------------------------------------------------------------
     B    1    0.27816      1.99954     2.72230    0.00000     4.72184
     H    2   -0.09272      0.00000     1.09256    0.00015     1.09272
     H    3   -0.09272      0.00000     1.09256    0.00015     1.09272
     H    4   -0.09272      0.00000     1.09256    0.00015     1.09272
=======================================================================
  * Total *    0.00000      1.99954     6.00000    0.00046     8.00000
The values of charge represented in the diagram are analysed and found to be the same as in the file. The three hydrogen atoms has the same value of charge and they cancel out with each other because of the highly symmetric structure. The file below provides information about the bond orbitals of the molecule.
     (Occupancy)   Bond orbital/ Coefficients/ Hybrids
---------------------------------------------------------------------------------
    1. (1.99854) BD ( 1) B   1 - H   2
               ( 45.36%)   0.6735* B   1 s( 33.33%)p 2.00( 66.67%)
                                           0.0000  0.5774  0.0000  0.0000  0.0000
                                           0.8165  0.0000  0.0000  0.0000
               ( 54.64%)   0.7392* H   2 s(100.00%)
                                           1.0000  0.0001
    2. (1.99854) BD ( 1) B   1 - H   3
               ( 45.36%)   0.6735* B   1 s( 33.33%)p 2.00( 66.67%)
                                           0.0000  0.5774  0.0000  0.7071  0.0000
                                          -0.4082  0.0000  0.0000  0.0000
               ( 54.64%)   0.7392* H   3 s(100.00%)
                                           1.0000  0.0001
    3. (1.99854) BD ( 1) B   1 - H   4
               ( 45.36%)   0.6735* B   1 s( 33.33%)p 2.00( 66.67%)
                                           0.0000  0.5774  0.0000 -0.7071  0.0000
                                          -0.4082  0.0000  0.0000  0.0000
               ( 54.64%)   0.7392* H   4 s(100.00%)
                                           1.0000  0.0001
    4. (1.99954) CR ( 1) B   1           s(100.00%)
                                           1.0000  0.0000  0.0000  0.0000  0.0000
                                           0.0000  0.0000  0.0000  0.0000
    5. (0.00000) LP*( 1) B   1           s(100.00%)
According to the information above, the three hydrogen atoms contribute equally 54.64% of electron density towards the B-H bonds while the boron atom contributes 45.36%. It is understandable that the hydrogens contribute greater to the diatomic bonds as they are relative electronegative in this case. The hybridisation of the bondings can also be determined from the information provided. The s character and p character has ratio of 1:2 for the first three orbitals which illustrates a sp2 hybridised bond. This is consistent with the D3h point groups which confirms that the bond are all equally distanced and the bond angles are always 120°. The fourth orbital illustrates the core of 1s orbital of the boron atom which has 100% s character. The fifth orbital relates to the lone pair located on the boron atom and it should have 100% p character.
TlBr3 Molecule Analysis
Geometry Optimisation
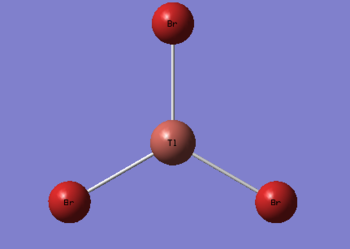
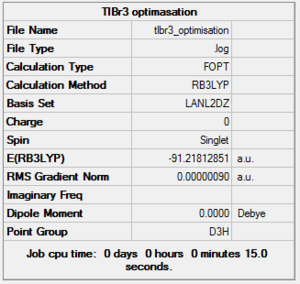
The TlBr3 molecule is analysed in the same way as the BH3 molecule. It is first drawn using GaussionView 5.0 and then optimised by B3LYP DFT method. Nevertheless, the basis set applied this time is LanL2DZ which is a more accurate setup to optimise the molecule to a greater extend. LanL2DZ applies the Los Alamos Effective Core Potential to the core orbitals and uses double zeta basis calculations for the valence AOs. Comparing to BH3, Tl and Br elements are heavier and exhibits relativistic effects. Therefore, this molecule is best not to be calculated using Schrodinger equation. TlBr3 contains rich electrons. The assumption hence would be that the most bonding interactions arise from the valence electrons. In order to get around the situation, a pseudo potential is applied which is a method to model the core atomic orbitals.
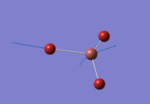
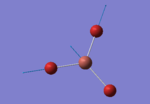
It is calculated by the program that the optimised structure is of the point group D3h. The dipole moment is again canceled out owing to the highly symmetrical structure. The Tl-Br bond distance is 2.65Å and the Br-Tl-Br dihedral angle is 120°. The molecular structure and the summary are shown below. File:Lg1109 TLBR3 OPt.LOG
 |
 |
|---|
        Item               Value     Threshold  Converged?
Maximum Force            0.000002     0.000450     YES
RMS     Force            0.000001     0.000300     YES
Maximum Displacement     0.000022     0.001800     YES
RMS     Displacement     0.000014     0.001200     YES
Predicted change in Energy=-6.083881D-11
Optimization completed.
   -- Stationary point found.
| Optimisation Step 1 | Optimisation Step 2 | Optimisation Step 3 |
|---|---|---|
 |
 |
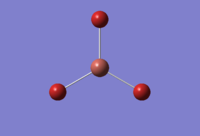 |
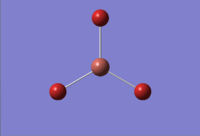
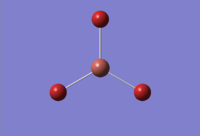
The optimisation proceeds through three iterative cycles to achieve the global minima on the potential energy surface as shown above. The bond length has slightly decreased from 2.69Å to the final value 2.65Å. The bonds during the three cycles are all displayed this time, meaning the resultant bond lengths have not exceeded the default setup of the program.
                          ----------------------------
                          !   Optimized Parameters   !
                          ! (Angstroms and Degrees)  !
--------------------------                            --------------------------
! Name  Definition              Value          Derivative Info.                !
--------------------------------------------------------------------------------
! R1    R(1,2)                  2.651          -DE/DX =    0.0                 !
! R2    R(1,3)                  2.651          -DE/DX =    0.0                 !
! R3    R(1,4)                  2.651          -DE/DX =    0.0                 !
! A1    A(2,1,3)              120.0            -DE/DX =    0.0                 !
! A2    A(2,1,4)              120.0            -DE/DX =    0.0                 !
! A3    A(3,1,4)              120.0            -DE/DX =    0.0                 !
! D1    D(2,1,4,3)            180.0            -DE/DX =    0.0                 !
--------------------------------------------------------------------------------
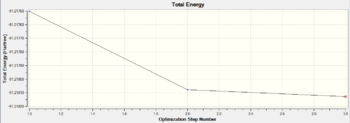
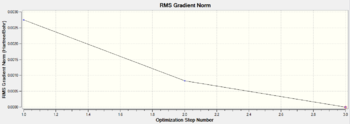
The optimisation process stabilises the total energy and minimises the RMS gradient to a close-to-zero value, showing the optimisation method is useful and successful. The information is clearly displayed in the features below as going through the iterative steps.
 |
 |
|---|
Frequency Analysis
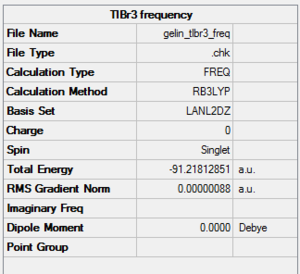
Vibrational analysis is carried out on the molecule so that the degree of optimisation can be investigated. As in the case of BH3, the optimised molecule would either be in the ground state with a global minima or in a transition state with the presence of negative vibrational frequencies. The IR spectrum of the optimised molecule are predicted using Gaussian by B3LYP DFT method with a LanL2DZ basis set instead of 3-21 G as it is important to apply the same calculation method and basis set as previous procedures.
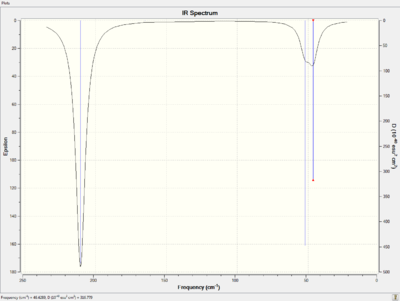
The predicted IR spectrum and the summary are shown below. File:GELIN TLBR3 FREQ.LOG
 |
 |
|---|
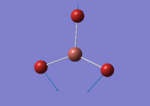
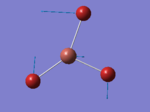
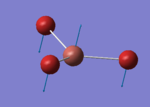
As in the case of BH3, there are six vibrational modes are found and described in detail in the table below.
As with the IR spectrum of BH3 molecule, only three vibrational mode are observed for TlBr3 molecule. The possible explanation for this could be the degeneration of the two pairs of E' modes. If that is the case, the degenerated vibrations will appear at the same IR frequencies. On the other hand, the A1' vibration is absent from the spectrum which results from the highly symmetric motion. No change in dipole moment gives no peak on the spectrum.
Low frequencies --- -3.4213 -0.0026 -0.0004 0.0015 3.9367 3.9367
According to the spectrum, the first observable peak occurs at 46 cm-1 which is much greater than the low frequencies recorded above. These low frequencies are very close to zero which indicates a good optimisation method is applied.
Analysis of Cis and Trans Isomers of Mo(CO)4L2
In this section, we are going to investigate the cis and trans isomer in the form of Mo(CO)4L2. We have first encountered with the isomers of this form in the 2nd Year synthesis lab. During the experiment, Mo(CO)4(PPh3)2 were synthesised and analysed. In our case, the phenyl rings attached to the phosphorus in the compound is now substituted with chlorine atoms. As the chlorine atoms preforms similar role in the compound while it is much smaller in size. The computational demand will decrease significantly. The pseudo potential is again used here.
Energy Optimisation
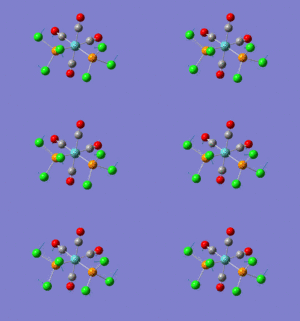
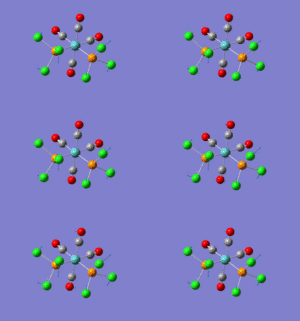
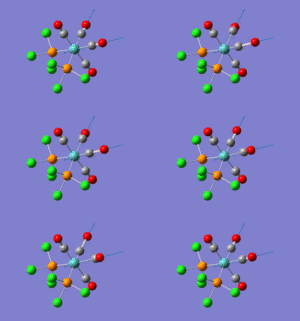
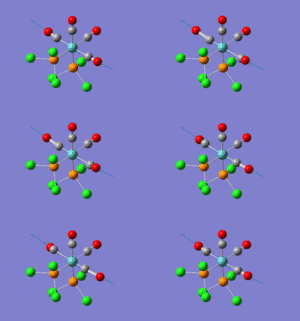
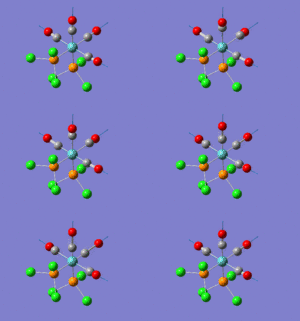
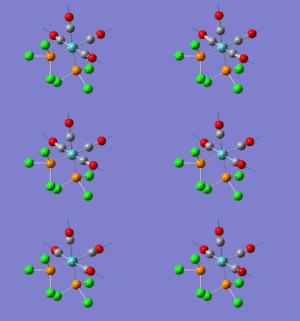
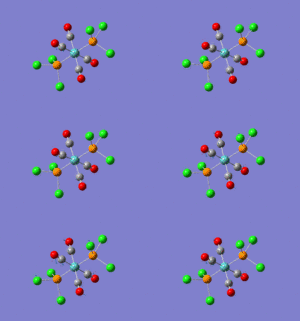
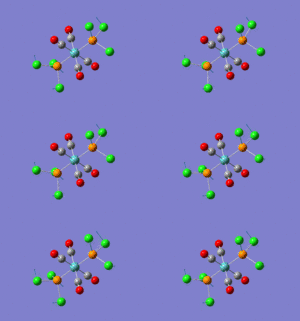
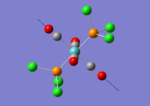
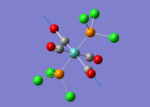
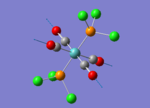
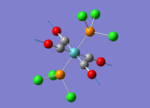
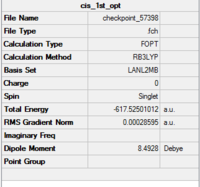
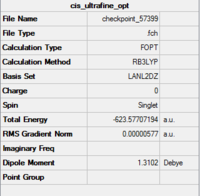
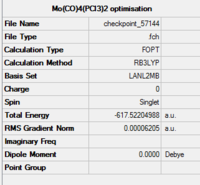
The isomers are first optimised using loose LanL2MB method to obtain roughly minimised structures which could be used for further optimisation. As the first optimisation is done, manipulation is required to alter the structure of the two isomers so that the time of computational work would decrease. For cis isomer, one chlorine atom is adjusted to point up parallel to the axial bond while that one chlorine atom of the other group points down. The Mo centre is fixed. For trans isomer, both PCl3 groups are in the eclipsed conformation which one the chlorine atom of each group lies parallel with one of the Mo-C bond. The basis set is then changed to ultrafine LanL2DZ which is a more accurate calculation method. The structures and summary of the loose and ultrafine optimisation of the cis and trans Mo(CO)4(PCl3)2 compounds are summarised in the table below.
| Cis Mo(CO)4(PCl3)2 Loose Optimisation (DOI:10042/to-57398 ) | Cis Mo(CO)4(PCl3)2 Ultrafine Optimisation (DOI:10042/to-57399 ) | Trans Mo(CO)4(PCl3)2 Loose Optimisation (DOI:10042/to-57144 ) | Trans Mo(CO)4(PCl3)2 Ultrafine Optimisation (DOI:10042/to-57397 ) | ||||||||||||
|---|---|---|---|---|---|---|---|---|---|---|---|---|---|---|---|
|
|
|
| ||||||||||||
 |
 |
 |
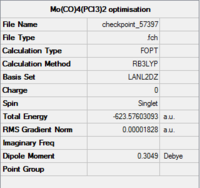 |
According to the table, after apply the ultrafine LanL2DZ method, the energy of formation decreases for both cis and trans isomers. It confirms that the further optimisation processes are successful. The expected point group for cis isomer is C2v and for trans isomer is D4h.
| Bond Type | Cis Isomer Bond Length(Å) | Literature Bond Length(Å) | Trans Isomer Bond Length(Å) | Literature Bond Length(Å) |
|---|---|---|---|---|
| Mo-C | 2.06 | 2.01 | 2.06 | 1.87 |
| Mo-P | 2.51 | 2.58 | 2.44 | 2.37 |
| C-O | 1.17 | 1.15 | 1.17 | 1.15 |
| P-Cl | 2.24 | - | 2.24 | - |
Frequency Analysis
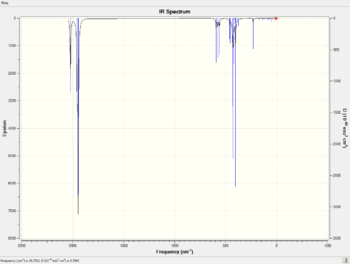
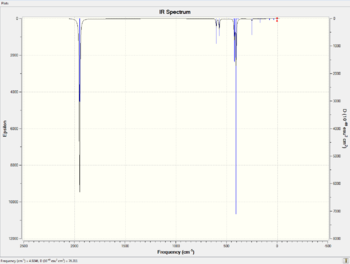
Vibrational analysis is carried out for both cis and trans isomers. The IR spectra of the optimised molecules are predicted using Gaussian by B3LYP DFT method with a LanL2DZ basis set. The predicted spectra are shown below.
 |
 |
|---|
The tables below listed the important vibrational modes for cis and trans isomers.
According to the tables above, all the CO ligand stretches correlate to the literature values quite well. It is found that the four carbonyl vibrational modes of cis isomer can be distinguished nicely from the spectra as the intensity is high enough while for the trans isomer, only two peaks can be distinguished which are double degenerated. The other two carbonyl vibrational modes have very low intensity as there is no change in both of the dipole moments.
Mini Project: Explore Bonding in Main Group Halides
Diborane
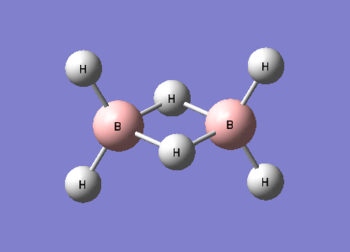
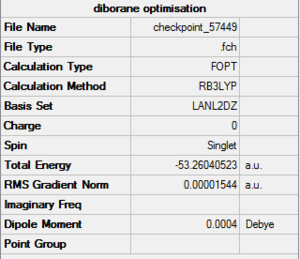
Diborane was drawn using GaussianView 5.0 and optimised by B3LYP DFT method with the basis set of LanL2DZ. The optimised structure of the molecule and its summary are shown below.
 |
 |
|---|
The expected point group of diborane is D2h. The terminal and bridging bond lengths and bond angles are listed in the table below.
| Bond Type | Bond Length (Å) | Angle Type | Bond Angle(°) |
|---|---|---|---|
| B-H Terminal | 1.19 | H-B-H Terminal | 123 |
| B-H Bridging | 1.34 | H-B-H Bridging | 85 |
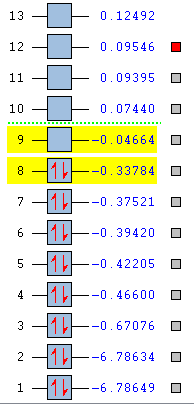
The additional keyword "pop=full" and the selection of "Full NBO" opens the MO option. The molecular orbital of diborane is then predicted using HPC by a B3LYP method with LanL2DZ basis set. The energy levels are listed below.
 |
 |
|---|
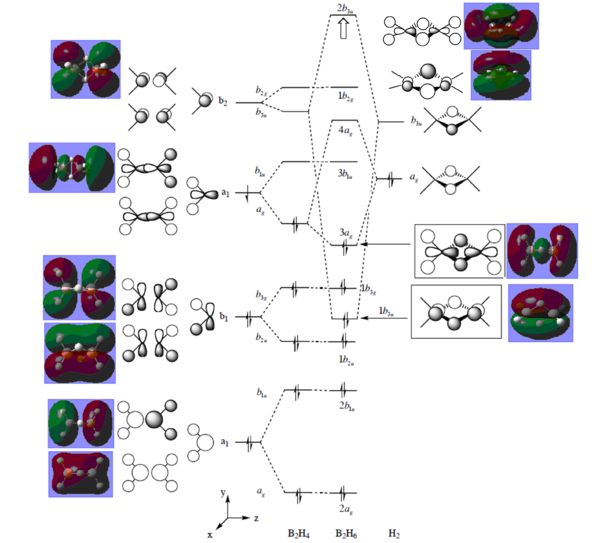
A full molecular orbital diagram is obtained by linear combination of molecular orbital with the same symmetry. The two fragments used in combination are B2H4 and H2 units.
From the MO diagram, it can be seen that the HOMO is located at the eighth energy level while the LUMO on the ninth energy level. The energy difference between the HOMO and LUMO are relative large comparing to other energy gaps. Nevertheless, the LUMO is still Lewis acidic and be able to accept electron pairs from other molecules. If an additional pair of electrons are added to the vacant energy levels i.e. LUMO, the overall energy of the molecule will not be destabilised. The predicted 3D orbitals are in good consistency with the drawn orbitals. The vital feature is that the 1b3u orbital contributes the most to the bridging 3c-2e bonding.
Aluminium Compounds Al2Br2Cl4
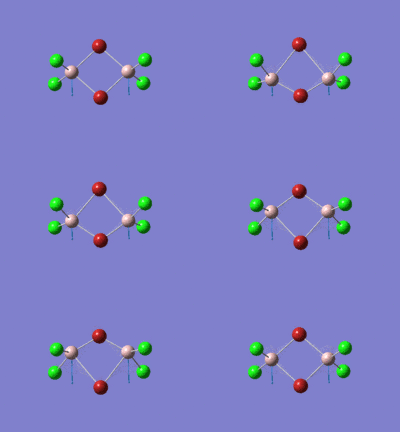
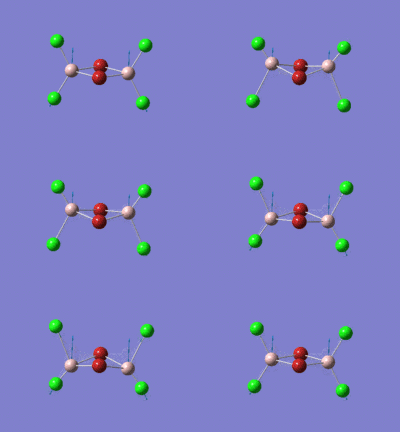
Al2Cl6 has similar bonding situation as B2H6 analysed above. In this section, we are going to replace the two of the six chlorine atoms with two halide bromine atoms. The resultant Al2Br2Cl4 has three conformations which are cis, trans an bridging. The three structures are first produced in GaussianView 5.0 and optimised with LanL2DZ basis set. The 3D view of the three molecules and their optimisation summaries are tabulated below.
| Cis Al2Br2Cl4 | Trans Al2Br2Cl4 | Bridging Al2Br2Cl4 | |||||||||
|---|---|---|---|---|---|---|---|---|---|---|---|
|
|
| |||||||||
 |
 |
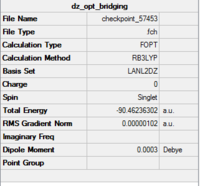 |
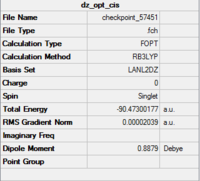
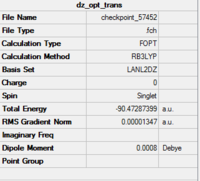
From the data shown above, it is observed that the bridging configuration is the least thermodynamically stable with a slightly increase in the total energy when comparing two the other two. This is because the heavier and larger bromine atoms result in greater steric clash when forcing them into the bridging positions.
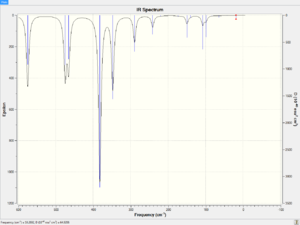
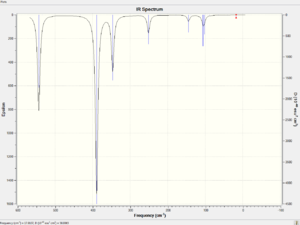
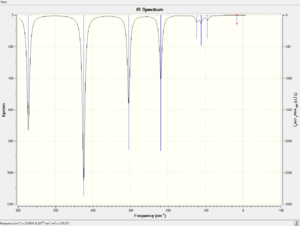
The spectra of vibrational modes of cis, trans and bridging Al2Br2Cl4 are shown below.
 |
 |
 |
|---|
The vibrational modes of bridging Al2Br2Cl4 are illustrated in the table below.
The frequencies of trans Al2Br2Cl4 are briefly illustrated in the table below.
| Vibrational mode | Predicted Frequency (cm-1) | Intensity |
|---|---|---|
| v(x) | 347 | 135 |
| v(y) | 389 | 439 |
| v(z) | 543 | 235 |
Both bridging and trans configurations have three main vibrational modes.
The frequencies of cis Al2Br2Cl4 are briefly illustrated in the table below.
| Vibrational mode | Predicted Frequency (cm-1) | Intensity |
|---|---|---|
| v(x) | 347 | 135 |
| v(y) | 382 | 306 |
| v(y)' | 465 | 95 |
| v(z) | 475 | 110 |
| v(z)' | 575 | 132 |
According to the table of cis configuration, it is found that the molecule shows no degeneracy of mode 2 and 3. This results from the different bonds attached to the two Al centres. One is associated with two bromine atoms while the other associated with two chlorine atoms. The vibrational frequencies are always lower for the Al-Br bonds than for the Al-Cl bonds. The intensities of the vibrational modes are all much greater than zero which means the vibrational motions are asymmetric and involve changes in dipole moments.
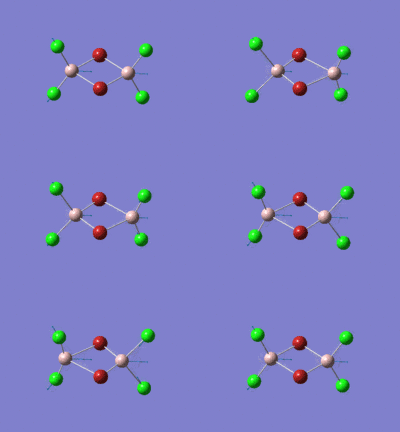
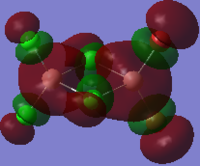
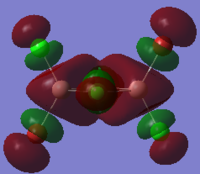
The HOMO and LUMO orbitals of cis, trans and bridging Al2Br2Cl4 are tabulated below. These two orbitals are included because they are the most relevant to the reactivity and stability of the molecules.
| Molecular Configuration Type | HOMO Orbital | LUMO Orbital |
|---|---|---|
| Cis Al2Br2Cl4 (DOI:10042/to-57463 ) | 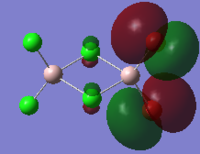 |
 |
| Trans Al2Br2Cl4 (DOI:10042/to-57464 ) | 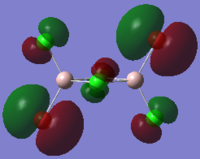 |
 |
| Bridging Al2Br2Cl4 (DOI:10042/to-57465 ) | 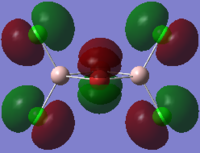 |
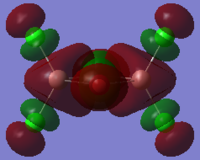 |
By close examine the orbitals, it is found that the orbitals relevant to bromine atoms are always more diffuse than to chlorine atoms. This can be explained by the electronegativity of the atoms as the chlorine atoms is more electronegative so that the electrons are attracted more tightly than the bromine. On the other hand, the Al and Cl in cis and trans configurations have good interactions with each other. This is not observed in the bridging configuration owing to the mismatching of the orbitals.
References
- ↑ 1.A R. Katritzky, J. A. Joule, V.V Zhdankin, Handbook of Heterocyclic Chemistry, 2010, 3rd edition, 36

