Rep:Mod:lewisacidsandbases module2
BH3
Geometry Optimisation
An ab initio quantum mechanical calculation was performed to obtain the optimized structure of BH3. The Density Functional Theory (DFT)-level calculation using Becke’s three-parameter exchange functional in combination with the Lee, Yang and Parr correlation function (B3LYP) was carried in the Gaussian 09 suite of programs. The DFT method is often chosen over Hartree-Fock theory because the former is capable of achieving greater accuracy at only a slight increase in cost.[1] Hence, all the calculations presented in this wiki page were performed at the DFT-level using B3LYP.
A 3-21G basis set was used for the optimisation of BH3. Although 3-21G is a relatively simple basis set, the optimisation will still be fairly accurate as BH3 is a small and symmetrical molecule. It is important to note, though, that larger molecules containing heavier atoms would often require the use of a larger basis set to produce accurate results.
The log file of the optimisation of BH3 can be found here: https://wiki.ch.ic.ac.uk/wiki/images/d/d6/Wsc108_bh3_opt.log
Some general information about this calculation is shown in table 1 below:
Table 1: General Information about Optimisation of BH3
| File Type | .log |
| Calculation Type | FOPT |
| Calculation Method | RB3LYP |
| Basis Set | 3-21G |
| Charge | 0 |
| Spin | Singlet |
| E(RB+HF-LYP) | -26.4623 a.u. |
| RMS Gradient Norm | 0.0000 a.u. |
| Imaginary Frequency | - |
| Dipole Moment | 0.00 Debye |
| Point Group | D3h |
| Job CPU Time | 10.0 seconds |
The optimised structure of BH3 can be seen here:
The optimized B-H bond distance in BH3 is 1.19Å and the optimised H-B-H bond angle is 120.0o. This corresponds closely to that of literature[2], where the average bond length is 1.21Å and the H-B-H bond angle is 120.1o.
Frequency Analysis
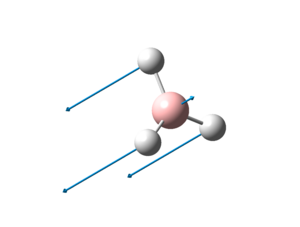
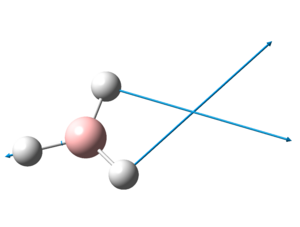
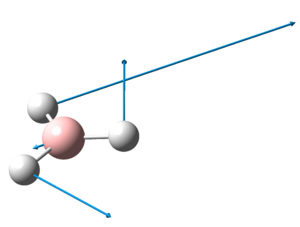
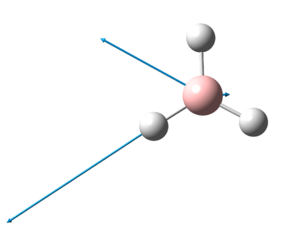
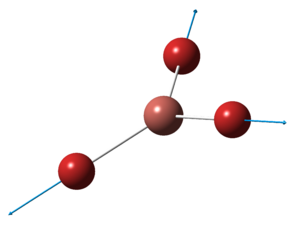
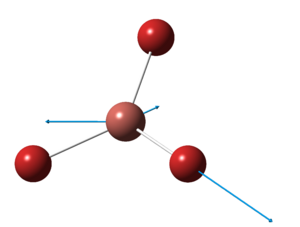
A frequency analysis is performed on the optimised structure of BH3. Each vibrational mode is shown and described in table 2 below. The frequency obtained is compared against literature[3] values and it can be seen that the values correspond quite well with that of literature. The log file of the frequency analysis of BH3 can be found here: https://wiki.ch.ic.ac.uk/wiki/images/2/25/Wsc108_bh3_freq.log
Table 2: BH3 Vibration Frequencies
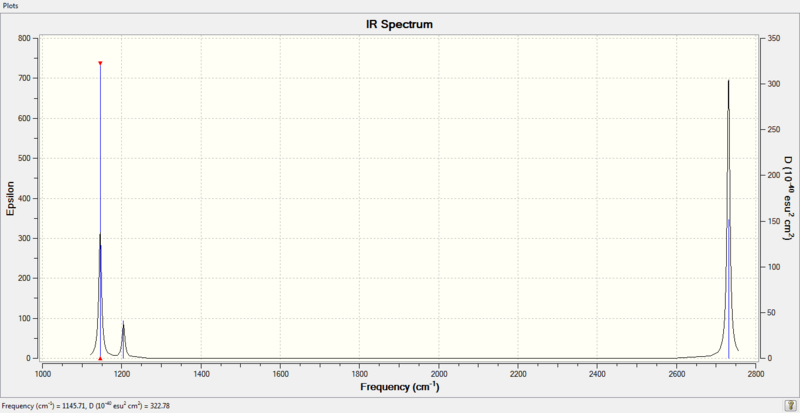
Figure 1: IR Spectrum of BH3
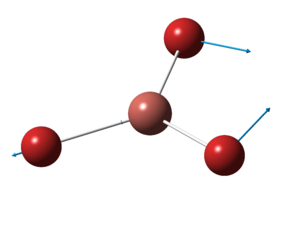
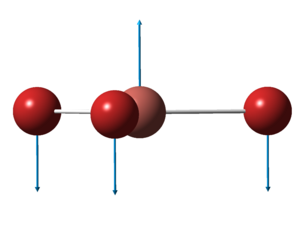
There are 6 forms of vibrations shown in table 2 above; however, only 3 peaks are observed in the infrared spectrum. This is because there are 2 sets of degenerate vibrations (vibrations 2 and 3 are degenerate; vibrations 5 and 6 are degenerate). Each set of degenerate vibration gives rise to 1 peak with an enhanced intensity. In addition, vibration mode 4 has an intensity of 0.0, where the totally symmetric stretch has all 3 H atoms move in and out in a concerted motion, resulting in no change in dipole moment of the molecule. As IR spectroscopy measures the changes in dipole moments generated by vibrations, vibrational mode 4 is infrared inactive and would not show up on the infrared spectrum. Hence, only a total of 3 peaks are observed.
Population Analysis
A population analysis is performed on the optimised structure of BH3, which can be found here: DOI:10042/to-6749 .
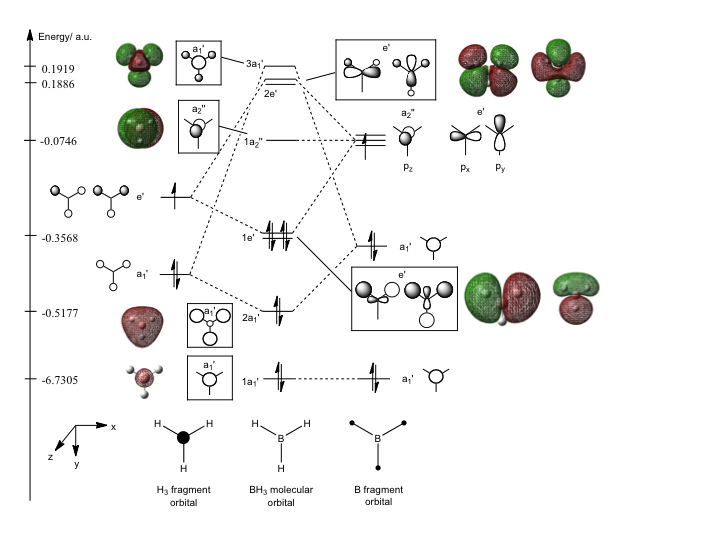
The molecular orbital diagram for BH3 is constructed based on the Gaussian calculations and molecular orbital theory, as shown below:
Figure 2: Molecular Orbital Diagram of BH3
Using molecular orbital theory, the fragment orbitals of H3 and B are constructed and their relative energies are rationalised. The 1s atomic orbital of B has the lowest energy and is placed right at the bottom of the MO diagram. As B and H are electropositive elements, the 2s atomic orbital of B and the H3 fragment orbital made up of 1s atomic orbitals would be at approximately the same level. The latter is placed at a slightly lower energy than the former as the a1' orbital is an all-in phase bonding fragment orbital. Nevertheless, this stabilisation should be rather small because based on the optimised structure of BH3, the H atoms are 2.07Å apart, which is much larger than a normal H-H bond length of 0.74Å.[4] The antibonding e' orbitals of the H3 fragment would be higher in energy than the a1' 2s orbital of the B fragment due to the antibonding interactions. However, again, the destabilisation energy would not be very large as the H atoms are far apart.
It can be seen from the diagram above that the general shape of the "real" BH3 molecular orbitals and energies produced by Gaussian calculations corresponds with that of the "LCAO" molecular orbitals fairly well. The 1s orbital of B is too low in energy to interact with any other orbitals. The subsequent a1' fragment orbitals combine to give a rather large splitting as the interactions lie between bonded atoms. The same goes for the higher energy e' fragments. As predicted by MO thoery, where interactions only occur between orbitals of the same symmetry, the a2" pz atomic orbital on B remains non-bonding as there are no H3 fragment orbitals of the same symmetry. In addition, it can be seen from the figure above that the antibonding MO is always destabilised more than the bonding MO is stabilised. Hence, this shows that qualitative MO theory is accurate and useful in predicting MO diagrams.
However, it should be noted that the "real" molecular orbitals produced based on the Gaussian calculations using the 3-21G basis set does not seem to take into consideration the fact that the higher energy fragment orbital makes a larger contribution to the molecular orbital. The contribution from the H3 fragment orbitals to the 3a1' and 2e' molecular orbitals would be expected to be much smaller based on MO theory. Nevertheless, when the same calculation is performed using the 6-311G+(d,p) basis set, the molecular orbitals seem to correspond even better with MO theory. This would be discussed further in the mini-project section.
In addition, the relative order of 3a1' and 2e' of the BH3 molecular orbital is often hard to determine based on MO theory. Stronger s-s interactions as compared to s-p interactions would lead to a higher 3a1' energy level; however, as the a1' fragment orbital of H3 is lower than the e' fragment orbital of H3, it is also possible that 3a1' would be of lower energy level. Based on Gaussian calculations using the 3-21G basis set, the 3a1' is higher in energy than the 2e' molecular orbital. Nevertheless, the opposite result is obtained when a larger basis set such as 6-311G+(d,p) is used. Again, this would be further discussed in the mini-project section.
TlBr3
Geometry Optimisation
Optimisation of TlBr3 was performed using the B3LYP method along with the LANL2DZ basis set. A pseudo potential is employed here as Tl is a heavy atom, hence a larger basis set is required to obtain accurate results. A pseudopotential is an effective potential which models the core electrons of an tom and takes into account relativistic effects which are important in heavier atoms; it is often used for atoms beyond the third row of the periodic table.[1]
The log file of the optimisation of TlBr3 can be found here: https://wiki.ch.ic.ac.uk/wiki/images/9/98/Wsc108_tlbr3_opt.log
Some general information about this calculation is shown in table 3 below:
Table 3: General Information about Optimisation of TlBr3
| File Type | .log |
| Calculation Type | FOPT |
| Calculation Method | RB3LYP |
| Basis Set | LANL2DZ |
| Charge | 0 |
| Spin | Singlet |
| E(RB+HF-LYP) | -91.2181 a.u. |
| RMS Gradient Norm | 0.0000 a.u. |
| Imaginary Frequency | - |
| Dipole Moment | 0.00 Debye |
| Point Group | D3h |
| Job CPU Time | 6.0 seconds |
The optimised structure of TlBr3 can be viewed here:
The optimized Tl-Br bond distance is 2.65Å and the optimised Br-Tl-Br bond angle is 120.0o. This corresponds closely to that of literature[5], where the Tl-Br bond distance is 2.512Å and the Br-Tl-Br bond angle is 120.0o.
Frequency Analysis
A frequency analysis is performed on the optimised structure of TlBr3. The log file of the frequency analysis can be found here: https://wiki.ch.ic.ac.uk/wiki/images/a/a5/Wsc108_tlbr3_freq.log
It is of paramount importance to perform a frequency analysis after a geometry optimisation to ensure that the structure obtained is indeed a minimum structure. Geometry optimizations often lead to a final structure where the forces of the potential energy surface on the system are essentially zero. This structure may correspond to a minimum point on the potential energy surface, or a saddle point, which is a minimum with respect to some directions on the surface and a maximum in one or more other directions. Hence, a frequency analysis must be performed, where a second derivative calculation is carried out. A minimum structure would have 0 imaginary frequencies; if 1 or more imaginary frequency is present, it means that optimisation of the molecule has to be performed again to locate the actual energy minimum. Frequency analysis can only be performed at stationary points on the potential energy surface due to the nature of the computations involved. Hence, frequency calculations must always be performed on the optimized structure. A frequency job must use the same method and basis set which produced the optimized geometry. This is to ensure consistency of the results obtained as different methods and basis sets would give results with different absolute values. As the frequencies calculated represent the second derivative of the energy optimization, frequencies computed with a different basis set or method essentially have no validity.
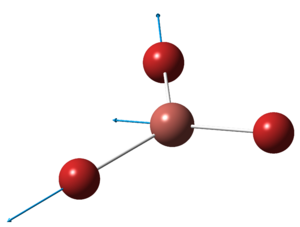
The "low frequencies" for TlBr3 are -3cm-1, 0cm-1, 0cm-1, 0cm-1, 4cm-1, 4cm-1. These 6 frequencies represent the "-6" vibrational frequencies in the "3N-6" vibrational frequencies that every molecule has. They represent the motions of the center of mass of TlBr3 and should be much smaller than the first "real" normal mode vibration. In this case, the lowest "real" normal mode is 46cm-1.
Table 4: TlBr3 Vibration Frequencies
Discussion About Bonds
A chemical bond is an electrostatic force of attraction between atoms which bind these atoms together to form compounds. The driving force for their formation is the lowering of the overall energy of the system. There are many types of bonds such as ionic bonds, covalent bonds, dipole-dipole interactions and hydrogen bonds. It is important to note that Gaussview draws bonds based on a pre-defined distance criteria, hence the absence of bonds in the structure simply indicates that the distance between the two atoms has exceeded the pre-defined value. It does not mean that there is no bond between the two atoms when there is no bond drawn between them in Gaussview. The pre-defined set of values works well for organic compounds, which often have bond distances that fall within the set of pre-defined values. However, bond lengths in inorganic compounds are often longer than that of organic compounds, hence, Gaussview often do not recognise those longer bond lengths as a bond based on its pre-defined values. It is thus important to recognise that interactions between the atoms are still present in such a case.
Cis and Trans Isomers of Mo(CO)4(PCl3)2
Geometry Optimisation
Both the cis and trans isomers of Mo(CO)4(PCl3)2 were optimised using the B3LYP method. They were first pre-optimised using the LANL2MB pseudo-potential and then optimised again using the pseudo potential LANL2DZ. As an extension to this exercise, a third optimisation was performed where extra d atomic orbital functions were added to the phosphorus atom so as to increase the accuracy of the calculation.
The general information of all three optimisations are shown below:
Table 5: General Information about First Optimisation of Cis and Trans Isomers of Mo(CO)4(PCl3)2
| Cis Isomer DOI:10042/to-6767 | Trans Isomer DOI:10042/to-6768 | |
| File Type | .log | .log |
| Calculation Type | FOPT | FOPT |
| Calculation Method | RB3LYP | RB3LYP |
| Basis Set | LANL2MB | LANL2MB |
| Charge | 0 | 0 |
| Spin | Singlet | Singlet |
| E(RB3LYP) | -617.5250 a.u. | -617.5221 a.u. |
| RMS Gradient Norm | 0.0001 a.u. | 0.0001 a.u. |
| Imaginary Frequency | - | - |
| Dipole Moment | 8.46 Debye | 0.00 Debye |
| Point Group | C1 | C1 |
| Job CPU Time | 12 minutes 16.5 seconds | 4 minutes 51.9 seconds |
Table 6: General Information about Second Optimisation of Cis and Trans Isomers of Mo(CO)4(PCl3)2
| Cis Isomer DOI:10042/to-6769 | Trans Isomer DOI:10042/to-6770 | |
| File Type | .log | .log |
| Calculation Type | FOPT | FOPT |
| Calculation Method | RB3LYP | RB3LYP |
| Basis Set | LANL2DZ | LANL2DZ |
| Charge | 0 | 0 |
| Spin | Singlet | Singlet |
| E(RB3LYP) | -623.5771 a.u. | -623.5760 a.u. |
| RMS Gradient Norm | 0.0001 a.u. | 0.0000 a.u. |
| Imaginary Frequency | 0 | 0 |
| Dipole Moment | 1.31 Debye | 0.30 Debye |
| Point Group | C1 | C1 |
| Job CPU Time | 1 hour 10 minutes 21.6 seconds | 48 minutes 37.6 seconds |
Table 7: General Information about Third Optimisation of Cis and Trans Isomers of Mo(CO)4(PCl3)2
| Cis Isomer DOI:10042/to-6771 | Trans Isomer DOI:10042/to-6772 | |
| File Type | .log | .log |
| Calculation Type | FOPT | FOPT |
| Calculation Method | RB3LYP | RB3LYP |
| Basis Set | Gen | Gen |
| Charge | 0 | 0 |
| Spin | Singlet | Singlet |
| E(RB3LYP) | -623.6929 a.u. | -623.6942 a.u. |
| RMS Gradient Norm | 0.0001 a.u. | 0.0000 a.u. |
| Imaginary Frequency | 0 | 0 |
| Dipole Moment | 0.071 Debye | 0.23 Debye |
| Point Group | C1 | C1 |
| Job CPU Time | 39 minutes 52.6 seconds | 42 minutes 56.1 seconds |
After the second optimisation, the trans-isomer is ~3kJ mol-1 less stable than the cis-isomer. However, after the third optimisation when the extra basis set is used, the trans-isomer is ~3kJ mol-1 more stable than the cis-isomer. The energy differences of ~3kJ mol-1 observed here is very small and might suggest that cis-trans isomerisation might readily occur at room temperature, which provides about 2.5kJ mol-1 of energy. The trans-isomer is expected to be more stable than the cis-isomer because the large PCl3 groups are closer together in the cis-isomer, resulting in greater steric hindrance. In addition, the dipole moments of the substituents in the trans-isomer cancel each other out, resulting in an overall dipole moment of zero. Hence, the trans-isomer should be the more stable complex compared to the cis-isomer and this can only be obtained from the calculations when the extrabasis set is used. This implies that a minimal basis set (with only the valence s and p orbital functions) for the phosphorus atom is not sufficient to obtain an accurate calculation as P prefers to be hypervalent, hence making use of its low lying d orbitals. The fact that the trans-isomer is the more stable complex is supported by literature[6], where cis-[PtCl2(PPh3)2] is the kinetic product and trans-[PtCl2(PPh3)2] is the thermodynamic product. To stabilise the trans-isomer further, a more bulky phosphorus ligand such as PPh3 could be used so as to increase the steric hindrance present in the cis-isomer. Furthermore, phosphorus ligands containing more electronegative groups could also be used so as to increase the dipole moment in the cis-isomer and destabilising it further; as the dipole moments cancel each other out in the trans-isomer, the trans-isomer would be relatively much more stable as compared to the cis-isomer.
The optimised structures of the cis and trans isomers based on the second optimisation can be viewed here:
The optimised structures of the cis and trans isomers based on the third optimisation can be viewed here:
The bond lengths and bond angles of the trans-isomer Mo(CO)4(PCl3)2 based on the second and third optimisations are compared with that of literature[7], where the compound in the literature is Mo(CO)4(PPh3)2.
Table 8: Bond Lengths and Angles of Trans-Isomer Mo(CO)4(PCl3)2
| Calculations based on Second Optimisation | Calculations based on Third Optimisation | Literature | |
| Mo-P/ Å | 2.44 | 2.42 | 2.500 |
| Mo-C/ Å | 2.06 | 2.06 | 2.005 |
| P-Cl (or P-C)/ Å | 2.24 | 2.12 | 1.828 |
| C-O/ Å | 1.17 | 1.17 | 1.164 |
| P-Mo-P/ o | 177.4 | 176.7 | 180 |
| Trans C-Mo-C/ o | 178.4 | 178.4 | 180 |
| 180.0 | 180.0 | ||
| Cis C-Mo-C/ o | 89.2 | 89.2 | 92.1 |
| 90.8 | 90.8 | ||
| P-Mo-C/ o | 91.3 | 91.6 | 87.2 |
| 90.0 | 90.0 | ||
| 88.7 | 88.4 |
As can be seen from table 8 above, the results obtained from Gaussian calculations do not correspond extremely well with that of literature, even when the extrabasis set is used. This suggests that perhaps another method and basis set should be used to produce a more accurate result that corresponds better with that observed experimentally. Nevertheless, having said that, the values obtained using the present method and basis set are still not that far off from that of literature and the differences observed could be attributed to the different phosphorus ligands.
Frequency Analysis
Low Frequency Vibrations
The log file of the frequency analysis performed based on the second optimisation of the cis and trans Mo complexes can be found here respectively: DOI:10042/to-6773 and DOI:10042/to-6774
The log file of the frequency analysis performed based on the third optimisation of the cis and trans Mo complexes can be found here respectively: DOI:10042/to-6775 and DOI:10042/to-6776
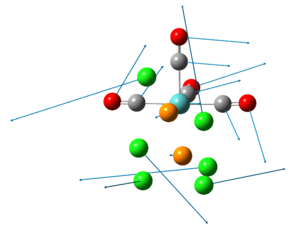
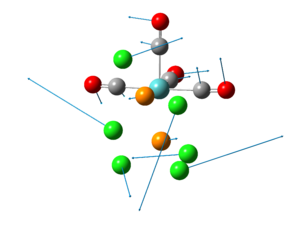
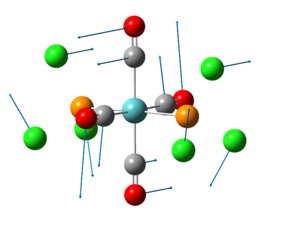
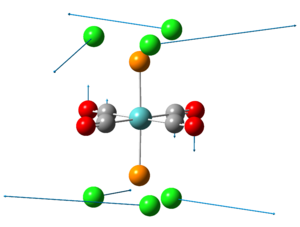
The low frequency vibrations of the cis and trans Mo complexes performed on the second optimisation are shown in the table below:
Table 9: Cis- and Trans-Mo(CO)4(PCl3)2 Vibration Frequencies
The results from the frequency analysis performed based on the second and third optimisations are very similar. The low frequencies of both results are presented in table 10 below.
Table 10: Cis- and Trans-Mo(CO)4(PCl3)2 Vibration Frequencies Based on Different Optimisation Files
| Based on Second Optimisation | Based on Third Optimisation | |||
| Frequency/ cm-1 | Intensity | Frequency/ cm-1 | Intensity | |
| Cis | 11 | 0 | 12 | 0 |
| Cis | 18 | 0 | 20 | 0 |
| Trans | 5 | 0 | 4 | 0 |
| Trans | 6 | 0 | 7 | 0 |
These vibrations occur at very low frequencies, especially that of the trans-isomer. As energy is proportional to frequency, these low energy vibrations might be occuring at room temperature.
C=O Stretching Frequencies
The calculated C=O stretching frequencies are compared with that of literature[8] in the tables below.
Table 11: C=O Stretching Frequencies of Cis-Mo(CO)4(PCl3)2
| Calculated Frequency Based on Second Optimisation | Calculated Frequency Based on Third Optimisation | Literature Frequency | Calculated Intensity | Symmetry |
| 1945 | 1938 | 1986 | 763 | B2 |
| 1949 | 1942 | 1994 | 1499 | B1 |
| 1958 | 1952 | 2004 | 633 | A1 |
| 2023 | 2019 | 2072 | 598 | A1 |
Table 12: C=O Stretching Frequencies of Trans-Mo(CO)4(PCl3)2
| Calculated Frequency Based on Second Optimisation | Calculated Frequency Based on Third Optimisation | Literature Frequency | Calculated Intensity | Symmetry |
| 1950 | 1939 | 1896 | 1475 | Eu |
| 1951 | 1940 | 1896 | 1467 | Eu |
| 1977 | 1967 | - | 1 | B1g |
| 2031 | 2026 | - | 4 | A1g |
As can be seen from the results above, the results obtained for the cis-isomer corresponds very well with that of literature values both in terms of the number of peaks and their respective frequencies. In fact, the frequency results based on the second optimisation is closer to that of literature values. However, in the case of the trans-isomer, 2 peaks are observed experimentally although 4 peaks are predicted by theoretical calculations for both the frequency analysis based on the second and third optimisation. This is because there are 2 vibrational modes in the trans-isomer that do not have an overall change in dipole moment, hence they are not IR active and would not show up on the IR spectrum. Nevertheless, the two peaks observed correspond quite well to that of literature values as well.
Mini-Project
Introduction
The concept of Lewis acids and bases has been commonly discussed in various inorganic chemistry courses. However, other than those involving coordination chemistry, there are few laboratory experiments on lewis acids and bases as these experiments often require high-vacuum apparatus. Hence, a computational method is employed here to investigate many of the concepts of lewis acid-lewis base chemistry.
This mini-project can be split into two main sections. The first section involves optimisation of the geometry of each free lewis acid and base (1-10) shown below. The hardness of the acids and bases can then be deduced by performing an NBO analysis on them. The NBO charges on the B and P atoms would also be studied to investigate the changes that occur in the presence of electron withdrawing ligands on the acids and bases. The second section involves optimisation of the geometry of some of the acid-base adducts. The various explanations offered for the relative stability of BF3 and BCl3 adducts would be investigated by performing quantum mechanical calculations on these adducts. In addition, the effects of electronegativity and steric hindrance on the adducts would be studied as well.
Figure 3: Lewis Acids and Lewis Bases 1-10
Methodology
All structures were created in Gaussview 5.0 and preoptimised to a local minimum using the 6-31G basis set, followed by a further optimisation using the 6-311+G(d,p) basis set. The 6-31G basis set is a split valence basis set with three contracted basis functions; 6-311+G(d,p) basis set adds diffuse functions and polarization functions to the original basis set. These polarization functions are particularly important so that the phosphorus and carbon atoms can polarize. The keyword "OPT(MAXCYCLE=50)" was included in some of the optimisations of the more complex molecules where it was suspected that the calculation might take too long. However, for some of the more complex molecules, each optimisation step took longer than usual. Hence, although the optimisation was performed within 50 cycles, the time taken for optimisation to complete was still quite long. In addition, when the optimisation was incomplete (i.e. the force and displacements have not converged) within the 50 cycles, the geometry of the most stable conformation would be extracted from the .log file and another cycle of optimisation would be performed on that structure again to see if an optimised structure could be easily obtained from it. All structures were fully optimised under no symmetry constraints and confirmed as an energy minima by frequency analysis. A population analysis was also performed for certain molecules to study the molecular orbitals and NBO charges as well. Furthermore, reorganisation energies of the lewis acids and bases was calculated for some of the adducts. This was done by deleting the acid or base from the adduct and performing an energy calculation of the acid or base at its geometry in the adduct. The reorganisation energy is then the difference between the energy of the free acid or base at its optimised geometry and the energy of the free acid or base at its geometry in the adduct.
Results
Optimised Structures
The optimised structures of the lewis acids 1-5 and lewis bases 6-10, as well as some of their corresponding adducts 11-22 are shown in the tables below, along with their general information.
Table 13: First Optimisation of Lewis Acids 1-5
| BCl3 | BF3 | BH3 | BEt3 | B(C6F5)3 | |
| No. | 1 | 2 | 3 | 4 | 5 |
| Optimisation Log File | DOI:10042/to-6780 | DOI:10042/to-6783 | DOI:10042/to-6789 | DOI:10042/to-6786 | DOI:10042/to-6792 |
| File Type | .log | ||||
| Calculation Type | FOPT | ||||
| Calculation Method | RB3LYP | ||||
| Basis Set | 6-31G | ||||
| Charge | 0 | ||||
| Spin | Singlet | ||||
| E(RB3LYP) | -1405.4923 a.u. | -324.4721 a.u. | -26.6060 a.u. | -262.4816 a.u. | -2207.7472 a.u. |
| RMS Gradient Norm | 0.0000 a.u. | 0.0001 a.u. | 0.0000 a.u. | 0.0000 a.u. | 0.0000 a.u. |
| Imaginary Frequency | - | - | - | - | - |
| Dipole Moment | 0.00 Debye | 0.00 Debye | 0.00 Debye | 0.10 Debye | 0.01 Debye |
| Point Group | D3h | D3h | D3h | C1 | C1 |
| Job CPU Time | 14.4 seconds | 14.2 seconds | 9.1 seconds | 9 minutes 4.2 seconds | 13 hours 40 minutes 22.1 seconds |
Table 14: Second Optimisation of Lewis Acids 1-5
| BCl3 | BF3 | BH3 | BEt3 | B(C6F5)3 | |
| No. | 1 | 2 | 3 | 4 | 5 |
| Optimisation Log File | DOI:10042/to-6781 | DOI:10042/to-6784 | DOI:10042/to-6790 | DOI:10042/to-6787 | DOI:10042/to-6793 |
| Jmol | |||||
| File Type | .log | ||||
| Calculation Type | FOPT | ||||
| Calculation Method | RB3LYP | ||||
| Basis Set | 6-311G+(d,p) | ||||
| Charge | 0 | ||||
| Spin | Singlet | ||||
| E(RB3LYP) | -1405.6573 a.u. | -324.6642 a.u. | -26.6211 a.u. | -262.61697510 a.u. | -2208.9267 a.u. |
| RMS Gradient Norm | 0.0000 a.u. | 0.0000 a.u. | 0.0000 a.u. | 0.0000 a.u. | 0.0000 a.u. |
| Imaginary Frequency | 0 | 0 | 0 | 0 | 0 |
| Dipole Moment | 0.00 Debye | 0.00 Debye | 0.00 Debye | 0.08 Debye | 0.00 Debye |
| Point Group | D3h | D3h | D3h | C1 | C1 |
| Job CPU Time | 59.5 seconds | 35.8 seconds | 14.7 seconds | 1 hour 23 minutes 7.6 seconds | 2 days 3 hours 20 minutes 8.5 seconds |
| Frequency Log File | DOI:10042/to-6782 | DOI:10042/to-6785 | DOI:10042/to-6791 | DOI:10042/to-6788 | DOI:10042/to-6794 |
Table 15: First Optimisation of Lewis Bases 6-10
| PCl3 | PF3 | PH3 | PEt3 | P(Mes)2H | |
| No. | 6 | 7 | 8 | 9 | 10 |
| Optimisation Log File | DOI:10042/to-6795 | DOI:10042/to-6798 | DOI:10042/to-6801 | DOI:10042/to-6804 | DOI:10042/to-6807 ,DOI:10042/to-6808 |
| File Type | .log | ||||
| Calculation Type | FOPT | ||||
| Calculation Method | RB3LYP | ||||
| Basis Set | 6-31G | ||||
| Charge | 0 | ||||
| Spin | Singlet | ||||
| E(RB3LYP) | -1721.9011 a.u. | -640.8221 a.u. | -343.1038 a.u. | -578.9457 a.u. | -1040.9458 a.u. |
| RMS Gradient Norm | 0.0000 a.u. | 0.0000 a.u. | 0.0001 a.u. | 0.0000 a.u. | 0.0000 a.u. |
| Imaginary Frequency | - | - | - | - | - |
| Dipole Moment | 1.92 Debye | 2.56 Debye | 1.35 Debye | 1.47 Debye | 1.34 Debye |
| Point Group | C3v | C3v | C3v | C1 | C1 |
| Job CPU Time | 28.4 seconds | 23.8 seconds | 19.9 seconds | 9 minutes 4.2 seconds | 25 minutes 31.2 seconds |
Table 16: Second Optimisation of Lewis Bases 6-10
| PCl3 | PF3 | PH3 | PEt3 | P(Mes)2H | |
| No. | 6 | 7 | 8 | 9 | 10 |
| Optimisation Log File | DOI:10042/to-6796 | DOI:10042/to-6799 | DOI:10042/to-6802 | DOI:10042/to-6805 | DOI:10042/to-6809 |
| Jmol | |||||
| File Type | .log | ||||
| Calculation Type | FOPT | ||||
| Calculation Method | RB3LYP | ||||
| Basis Set | 6-311G+(d,p) | ||||
| Charge | 0 | ||||
| Spin | Singlet | ||||
| E(RB3LYP) | -1722.1107 a.u. | -641.0875 a.u. | -343.1733 a.u. | -579.1296 a.u. | -1041.3417 a.u. |
| RMS Gradient Norm | 0.0001 a.u. | 0.0001 a.u. | 0.0000 a.u. | 0.0000 a.u. | 0.0000 a.u. |
| Imaginary Frequency | 0 | 0 | 0 | 0 | 0 |
| Dipole Moment | 1.08 Debye | 1.68 Debye | 0.82 Debye | 1.35 Debye | 1.21 Debye |
| Point Group | C3v | C3v | C3v | C1 | C1 |
| Job CPU Time | 1 minute 46.6 seconds | 1 minute 12.9 seconds | 24.8 seconds | 1 hour 6 minutes 34.0 seconds | 2 days 18 hours 2 minutes 48.4 seconds |
| Frequency Log File | DOI:10042/to-6797 | DOI:10042/to-6800 | DOI:10042/to-6803 | DOI:10042/to-6806 | DOI:10042/to-6810 |
Table 17: First Optimisation of Acid-Base Adducts 11-22
| BCl3-PEt3 | BCl3-PH3 | BEt3-PEt3 | BEt3-PH3 | BF3-PEt3 | BF3-PF3 | BF3-PH3 | BF3-P(Mes)2H | BH3-PEt3 | BH3-PF3 | BH3-PH3 | BH3-P(Mes)2H | |
| No. | 11 | 12 | 13 | 14 | 15 | 16 | 17 | 18 | 19 | 20 | 21 | 22 |
| Optimisation Log File | DOI:10042/to-6822 | DOI:10042/to-6825 | DOI:10042/to-6828 | DOI:10042/to-6831 ,DOI:10042/to-6832 | DOI:10042/to-6835 | DOI:10042/to-6838 | DOI:10042/to-6841 | DOI:10042/to-6844 | DOI:10042/to-6848 | DOI:10042/to-6851 | DOI:10042/to-6854 | DOI:10042/to-6857 |
| File Type | .log | |||||||||||
| Calculation Type | FOPT | |||||||||||
| Calculation Method | RB3LYP | |||||||||||
| Basis Set | 6-31G | |||||||||||
| Charge | 0 | |||||||||||
| Spin | Singlet | |||||||||||
| E(RB3LYP) | -1984.4763 a.u. | -1748.6054 a.u. | -841.4267 a.u. | -605.5852 a.u. | -903.4542 a.u. | -965.2953 a.u. | -667.5856 a.u. | -1365.4456 a.u. | -605.5984 a.u. | -667.4452 a.u. | -369.7380 a.u. | -1067.5873 a.u. |
| RMS Gradient Norm | 0.0000 a.u. | 0.0000 a.u. | 0.0000 a.u. | 0.0000 a.u. | 0.0000 a.u. | 0.0001 a.u. | 0.0000 a.u. | 0.0000 a.u. | 0.0000 a.u. | 0.0000 a.u. | 0.0000 a.u. | 0.0000 a.u. |
| Imaginary Frequency | - | - | - | - | - | - | - | - | - | - | - | - |
| Dipole Moment | 8.80 Debye | 7.02 Debye | 4.68 Debye | 1.55 Debye | 7.28 Debye | 2.26 Debye | 4.50 Debye | 7.11 Debye | 5.34 Debye | 0.38 Debye | 4.43 Debye | 5.37 Debye |
| Point Group | C1 | C1 | C1 | C1 | C1 | C3v | C1 | C1 | C1 | C1 | C3 | C1 |
| Job CPU Time | 49 minutes 32.7 seconds | 5 minutes 19.2 seconds | 1 hours 21 minutes 37.9 seconds | 3 minutes 33.5 seconds | 14 minutes 23.5 seconds | 1 minute 38.0 seconds | 2 minutes 4.4 seconds | 4 hours 54 minutes 9.5 seconds | 9 minutes 35.8 seconds | 1 minute 32.0 seconds | 39.0 seconds | 2 hours 51 minutes 48.8 seconds |
Table 18: Second Optimisation of Acid-Base Adducts 11-22
| BCl3-PEt3 | BCl3-PH3 | BEt3-PEt3 | BEt3-PH3 | BF3-PEt3 | BF3-PF3 | BF3-PH3 | BF3-P(Mes)2H | BH3-PEt3 | BH3-PF3 | BH3-PH3 | BH3-P(Mes)2H | |
| No. | 11 | 12 | 13 | 14 | 15 | 16 | 17 | 18 | 19 | 20 | 21 | 22 |
| Optimisation Log File | DOI:10042/to-6823 | DOI:10042/to-6826 | DOI:10042/to-6829 | DOI:10042/to-6833 | DOI:10042/to-6836 | DOI:10042/to-6839 | DOI:10042/to-6842 | DOI:10042/to-6845 | DOI:10042/to-6849 | DOI:10042/to-6852 | DOI:10042/to-6855 | DOI:10042/to-6858 |
| Jmol | ||||||||||||
| File Type | .log | |||||||||||
| Calculation Type | FOPT | |||||||||||
| Calculation Method | RB3LYP | |||||||||||
| Basis Set | 6-31G | |||||||||||
| Charge | 0 | |||||||||||
| Spin | Singlet | |||||||||||
| E(RB3LYP) | -1984.8189 a.u. | -1748.8337 a.u. | -841.7490 a.u. | -605.7901 a.u. | -903.8179 a.u. | -965.7521 a.u. | -667.8411 a.u. | -1366.0180 a.u. | -605.8055 a.u. | -667.7381 a.u. | -369.8277 a.u. | -1068.0036 a.u. |
| RMS Gradient Norm | 0.0000 a.u. | 0.0000 a.u. | 0.0000 a.u. | 0.0000 a.u. | 0.0000 a.u. | 0.0000 a.u. | 0.0000 a.u. | 0.0000 a.u. | 0.0000 a.u. | 0.0000 a.u. | 0.0000 a.u. | 0.0000 a.u. |
| Imaginary Frequency | 0 | 0 | 0 | 0 | 0 | 0 | 0 | 0 | 0 | 0 | 0 | 0 |
| Dipole Moment | 8.01 Debye | 6.13 Debye | 5.10 Debye | 0.87 Debye | 7.20 Debye | 1.39 Debye | 1.59 Debye | 6.88 Debye | 5.25 Debye | 0.92 Debye | 4.24 Debye | 5.26 Debye |
| Point Group | C1 | C1 | C1 | C1 | C1 | C3v | C1 | C1 | C1 | C1 | C3 | C1 |
| Job CPU Time | 5 hours 32 minutes 0.0 seconds | 9 minutes 47.2 seconds | 19 hours 58 minutes 57.9 seconds | 10 hours 47 minutes 6.1 seconds | 4 hours 22 minutes 27.2 seconds | 18 minutes 12.5 seconds | 26 minutes 54.3 seconds | 2 days 19 hours 47 minutes 46.0 seconds | 2 hours 11 minutes 9.8 seconds | 12 minutes 57.5 seconds | 2 minutes 15.9 seconds | 2 days 12 hours 21 minutes 26.8 seconds |
| Frequency Log File | DOI:10042/to-6824 | DOI:10042/to-6827 | DOI:10042/to-6830 | DOI:10042/to-6834 | DOI:10042/to-6837 | DOI:10042/to-6840 | DOI:10042/to-6843 | DOI:10042/to-6847 | DOI:10042/to-6850 | DOI:10042/to-6853 | DOI:10042/to-6856 | DOI:10042/to-6859 |
Free Lewis Acids and Lewis Bases
MO of Free Lewis Acids and Bases
The molecular orbitals of the free lewis acids and bases can be studied to rationalise the relative hardness of the free lewis acids and bases. R. G. Pearson[9] proposed that the hardness of an acid or base is approximately equivalent to 1/2 the energy of the HOMO-LUMO gap. Hence, the energies of the highest occupied molecular orbitals (HOMOs), lowest unoccupied orbitals (LUMOs), their calculated hardness (1/2 the HOMO-LUMO gap) is shown in the table below.
Table 19: Hardness of Lewis Acids
| Lewis Acid | Energy of HOMO/ eV | Energy of LUMO/ eV | Energy Gap/ eV | Hardness/ eV |
| BH3 DOI:10042/to-6817 | -0.36 | -0.08 | 0.28 | 0.14 |
| BCl3 DOI:10042/to-6811 | -0.33 | -0.07 | 0.25 | 0.13 |
| BF3 DOI:10042/to-6815 | -0.44 | -0.02 | 0.42 | 0.21 |
| BEt3 DOI:10042/to-6813 | -0.28 | -0.02 | 0.26 | 0.13 |
| B(C6F5)3DOI:10042/to-6819 | -0.29 | -0.14 | 0.15 | 0.08 |
Table 20: Hardness of Lewis Bases
| Lewis Base | Energy of HOMO/ eV | Energy of LUMO/ eV | Energy Gap/ eV | Hardness/ eV |
| PH3 DOI:10042/to-6818 | -0.28 | -0.01 | 0.27 | 0.14 |
| PCl3 DOI:10042/to-6812 | -0.31 | -0.08 | 0.23 | 0.11 |
| PF3 DOI:10042/to-6816 | -0.35 | -0.04 | 0.31 | 0.15 |
| PEt3 DOI:10042/to-6814 | -0.22 | 0.00 | 0.22 | 0.11 |
| P(Mes)2H DOI:10042/to-6820 | -0.22 | -0.03 | 0.19 | 0.09 |
By approximating the absolute hardness of the acid or base to 1/2 the energy of the HOMO-LUMO gap[9], it can be seen from tables 19 and 20 above that the hardness of the acid decreases in the order : BF3 > BH3 > BEt3 ≈ BCl3 > B(C6F5)3 and the hardness of the base decreases in the order : PF3 > PH3 > P(Et)3 ≈ PCl3 > P(Mes)2H. This corresponds to the common textbook classification[10], where BF3 is a hard acid, BH3 is a soft acid and PR3 is a soft base, where R is an alkyl group.
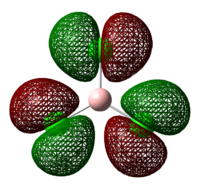
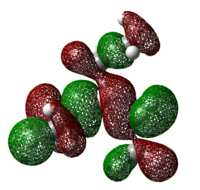
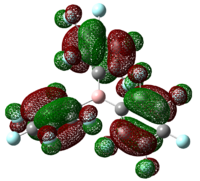
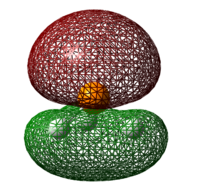
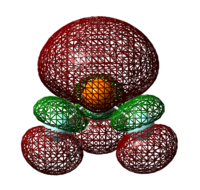
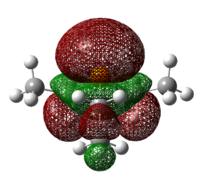
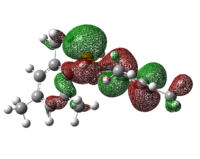
As it is a characteristic of soft acids and bases to be more polarisable than hard acids and bases[10], the HOMO of the lewis acids and bases are studied in greater detail to see if a trend can be observed. The images are shown in tables 21 and 22 below:
Table 21: HOMO of Lewis Acids
| BH3 | BCl3 | BF3 | BEt3 | B(C6F5)3 |
 |
 |
 |
 |
|
Table 22: HOMO of Lewis Bases
| PH3 | PCl3 | PF3 | PEt3 | P(Mes)2H |
 |
 |
 |
 |
|
As can be seen from the diagrams, the HOMO of the harder acids and bases (in particular BF3 and PF3) have “σ-like” orbitals whereas that of the softer acids and bases (in particular B(C6F5)3 and P(Mes)2H) have “π-like” orbitals, which are more polarisable. This corresponds to theoretical knowledge where soft acids and bases are more polarisable than hard acids and bases[10], where BF3 is a hard acid.
Effect of Different Basis Sets on MO
In addition, it is interesting to note that calculations performed on BH3 using the 3-21G (in section 1.3 of this wiki page) and 6-311+G(d,p) basis set give slightly different MO results. In particular, the ordering of the 2e' and 3a1' are different when the two different basis sets are used. This can be seen in figure 4 below:
Figure 4: Part of the Molecular Orbital Diagram of BH3 using different basis sets
As mentioned earlier, the exact order of the two molecular orbitals are hard to determine and both orders can be rationalised based on MO theory. Often, such is the case and the exact order of molecular orbitals can only be determined via calculations. As can be seen in the figure above, when 3-21G basis set is used, the 3a1' molecular orbital is higher in energy than 2e'; when a higher level basis set 6-311G+(d,p) is used, the ordering is reversed. It is observed that when the 6-311+G(d,p) basis set is used, the larger contribution from the B orbital to the anti-bonding orbitals becomes alot more prominent than that of the H3 fragment orbitals as compared to when the 3-21G basis set is used. This is in line with MO theory where the higher energy fragment orbital (i.e. the B fragment orbital in this case) makes a larger contribution to the antibonding molecular orbital. Hence, as the 6-311G+(d,p) basis set takes into consideration the relative contribution of fragment orbitals to the molecular orbitals, the relative molecular orbitals derived from it should be more accurate.
NBO Charges
The NBO charges on the donor and acceptor atoms are given in tables 23 and 24 below.
Table 23: NBO Charges of Lewis Acids
| Lewis Acid | Charge on B |
| BH3 | 0.053 |
| BCl3 | 0.328 |
| BF3 | 1.409 |
| BEt3 | 1.032 |
| B(C6F5)3 | 0.861 |
Table 24: NBO Charges of Lewis Bases
| Lewis Base | Charge on P |
| PH3 | 0.022 |
| PCl3 | 0.753 |
| PF3 | 1.685 |
| PEt3 | 0.782 |
| P(Mes)2H | 0.571 |
The electron-withdrawing effect of fluorine is clearly reflected in the more positive NBO charges on both boron and phosphorus. As the central atom in BF3 and PF3 are highly charged, it suggests that they would be predominantly involved in electrostatic rather than covalent interactions. This again corresponds to theoretical knowledge where hard acids and bases are involved mainly in electrostatic interactions and soft acids and bases are involved mainly in covalent interactions.
It is expected that the boron in BEt3 would have a less positive NBO charge than that in BH3 due to the inductive electron donating effect of the ethyl group. However, such an effect is not accurately reflected in the NBO charges.
Acid-Base Adducts
Comparison between BCl3 and BF3
It is a well known fact that the order of thermodynamic stability of complexes BX3 increases with decreasing electronegativity of X.[10] This can be seen from the energy of formation of BCl3 and BF3 adducts shown below, where the formation of BCl3-PEt3, in particular, is more favourable than that of BF3-PEt3. Although the energy of formation of BCl3-PH3 is ~2 kJ mol-1 higher than that of BF3-PH3, it should be noted that the energies calculated usually have an error of ~10 kJ mol-1 and there is ~2.5 kJ mol-1 of energy at room temperature, hence an energy difference of ~2 kJ mol-1 is very negligible and the two energies of formation can be treated as almost the same in this case.
Table 25: Energy of Formation of BCl3 and BF3 adducts
| Adduct | Energy of formation/ kJ mol-1 |
| BCl3-PH3 | -8 |
| BCl3-PEt3 | -84 |
| BF3-PH3 | -10 |
| BF3-PEt3 | -63 |
This observed thermodynamic stability is opposite to what would be expected based on an electronegativity argument. As the most electronegative halogen, fluorine, would cause the boron atom in BF3 to be most electron deficient, it is expected that BF3 would form the strongest bond with a base. Shriver et al.[10] claims that the currently accepted explanation is that in a BX3 molecule, the halogen atoms form pi bonds with the empty B2p orbitals which then have to be disrupted in order to make the acceptor orbital available for complex formation. Such a formation of pi bond would then favour a planar structure. Hence, as the small F atom forms the strongest pπ-pπ bonding in planar BF3, BF3 would be most reluctant to form a tetrahedral complex with a base, incurring the highest reorganizational energy.
However, Brink et al.[11] refuted this argument and proposed that the lower acidity of BF3 is due to its lower charge-accepting capacity. Robinson et al.[12] also suggested that the B-F bonds in BF3 has a greater ionic character than B-Cl bonds in BCl3, hence it is energetically less favourable for the B-F bonds to lengthen upon adduct formation, leading to a lower acidity of BF3.
However, based on the calculations performed, it was found that the reorganisation energy of BCl3-PH3 adduct is higher than BF3-PH3 adduct as shown in table 26 below, hence refuting the claim made by Shriver et al.[10]
Table 26: Reorganisation Energy of BCl3 and BF3 upon Adduct Formation
| Adduct | Energy of Free Acid/ a.u. | Energy of Free Acid upon Adduct Formation/ a.u. | Reorganisation Energy of Acid/ kJ mol-1 |
| BF3-PH3 | -324.6642 | -324.6635 DOI:10042/to-6995 | 2 |
| BCl3-PH3 | -1405.6573 | -1405.6226 DOI:10042/to-6996 | 91 |
| BF3-PEt3 | -324.6642 | -324.6194 DOI:10042/to-6998 | 117 |
| BCl3-PEt3 | -1405.6573 | -1405.6096 DOI:10042/to-7001 | 125 |
Instead, using the energy of the LUMO as a gauge of the electron affinity of the molecule, it can be seen from table 27 below that BCl3 has a higher electron accepting ability than BF3 due to its more stable LUMO. Hence, results from these calculations performed support the argument made by Brink et al.[11] , where the higher thermodynamic stability of the BCl3 adduct can be attributed to their electron-accepting capacity.
Table 27: Energy of LUMO
| Lewis Acid | Image of LUMO | Energy of LUMO/ kJ mol-1 |
| BCl3 | 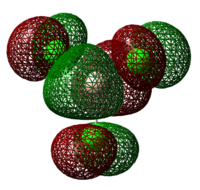 |
-195 |
| BF3 |  |
-48 |
Effects of electronegativity of R of base on adducts
Two sets of adducts, namely BH3 with PH3, PF3, PEt3 and BF3 with PH3, PF3, PEt3 would be studied in greater detail here to investigate the effects of the electronegativity of R groups of the base on the stability of the adducts.
Table 28: Energy of Formation of BH3 and BF3 adducts
| Adduct | Energy of formation/ kJ mol-1 |
| BH3-PH3 | -87 |
| BH3-PF3 | -77 |
| BH3-PEt3 | -144 |
| BF3-PH3 | -10 |
| BF3-PF3 | -1 |
| BF3-PEt3 | -63 |
Based on the results present in table 28 above, it can be seen that the adducts formed with PEt3 is the most stable, followed by adducts formed with PH3 and then PF3. This shows that the more electron donating the R groups on the base are, the more stable the corresponding adduct. This corresponds to theoretical knowledge where the planar molecule BH3 or BF3 has an incomplete octet, and the vacant p orbital perpendicular to the plane can accept a lone pair from a Lewis base. Hence, the more electron rich the lewis base is, the more stable the corresponding adduct would be.
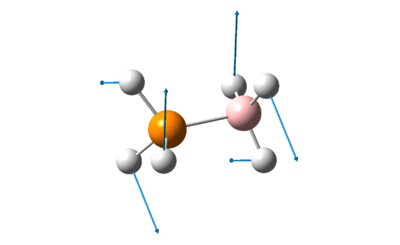
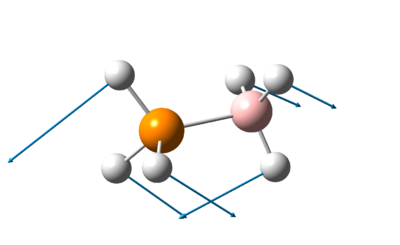
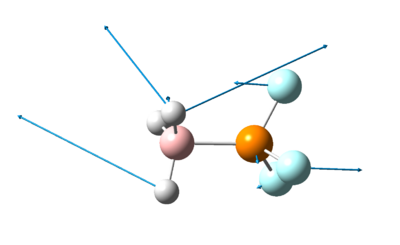
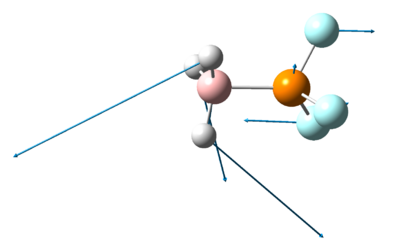
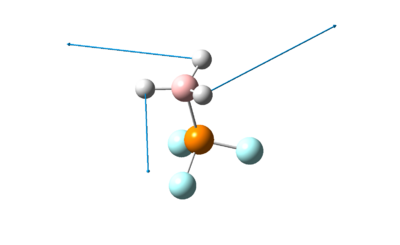
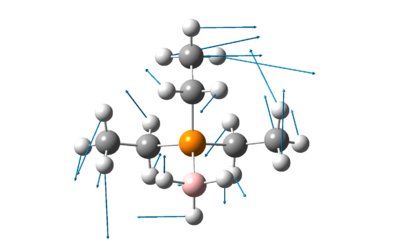
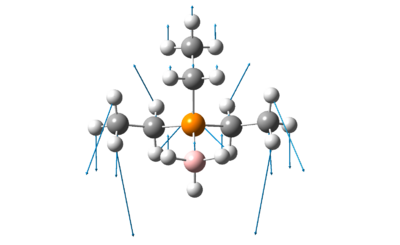
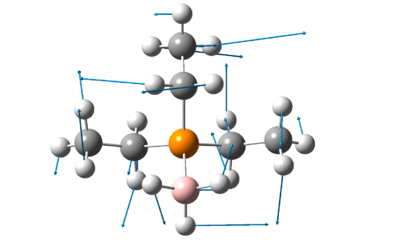
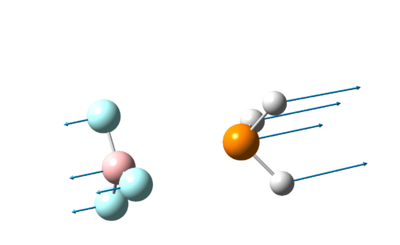
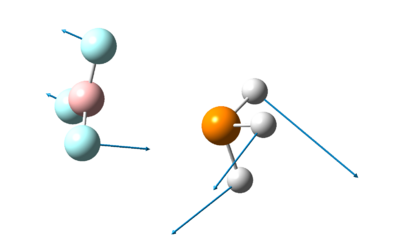
The 3 lowest frequencies of the 3 adducts containing BH3 are presented in the table below.
Table 29: Vibration Frequencies of BH3 adducts
The vibrations shown in table 29 above shows the vibrations of the various ligands in the direction indicated by the arrows. Although energy is proportional to frequency, it can be seen here that the frequency at which the molecules vibrate are not indicative of the stability of the molecule. While adducts with PEt3 still has the lowest vibrational energy, adducts with PF3 has a lower vibrational energy than adducts with PH3. This shows that besides vibrational energy, other factors such as translational energy, rotational energy and reorganisation energy play a very important role in the stability of the molecules as well.
Effects of electronegativity of R of acids on adducts
Two sets of adducts, namely PH3 with BH3, BF3, BEt3 and PEt3 with BH3, BF3, BEt3 would be studied in greater detail here to investigate the effects of the electronegativity of R groups on the acids on the stability of the adducts.
Table 30: Energy of Formation of PH3 and PEt3 adducts
| Adduct | Energy of formation/ kJ mol-1 |
| PH3-BH3 | -87 |
| PH3-BF3 | -10 |
| PH3-BEt3 | 1 |
| PEt3-BH3 | -144 |
| PEt3-BF3 | -63 |
| PEt3-BEt3 | -6 |
It is expected that the lewis acid with the most electron withdrawing groups would be most electron deficient, hence it would accept electrons from the base most readily. However, based on the results present in table 30 above, it can be seen that the adducts formed with BH3 is the most stable, followed by adducts formed with BF3 and then BEt3. Although BF3 is more electron poor than BH3, it does not form a more stable adduct with the same base.
A possible explanation of this order of stability of the BF3 and BH3 adducts may be offered by looking at the energies of the LUMO.
Table 31: Energy of LUMO
| Lewis Acid | Image of LUMO | Energy of LUMO/ kJ mol-1 |
| BH3 | 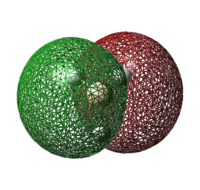 |
-217 |
| BF3 |  |
-48 |
As the LUMO of BH3 is more stable than that of BF3, the electron accepting ability of BH3 is better than that of BF3. Hence, BH3 adduct is more stable than that of BF3.
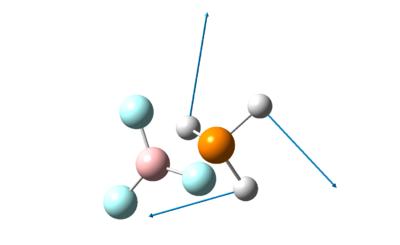
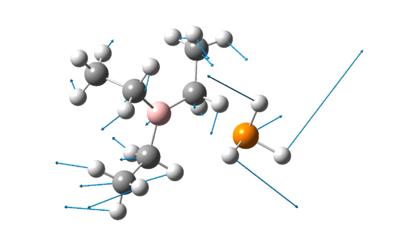
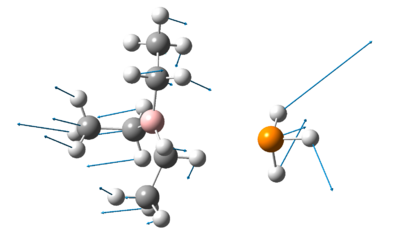
The 3 lowest frequencies of the 3 adducts containing PH3 are present in the table below.
Table 32: Vibration Frequencies of PH3 adducts
The vibrations shown in table 32 above shows the vibrations of the various ligands in the direction indicated by the arrows. In this case, the lowest energies of the vibrational frequencies of the adducts follow the trend of the stability of the adducts. Nevertheless, it is important to note that there are many other factors that may play a role in the stability of the molecules as well and vibrational frequency may not be good indication of the stability as seen in the previous section.
Steric effects
Two sets of adducts, namely BH3 with PH3, PEt3, P(Mes)2H and BF3 with PH3, PEt3, P(Mes)2H would be studied in greater detail here to investigate the effects of sterically bulky groups on the adducts. The reorganisation energies of the lewis acids and bases are calculated and presented in table 33 below:
Table 33: Reorganisation Energy of Lewis Acids and Bases upon Adduct Formation
| Adduct | Energy of Free Acid/ a.u. | Energy of Free Acid upon Adduct Formation/ a.u. | Reorganisation Energy of Acid/ kJ mol-1 | Energy of Free Base/ a.u. | Energy of Free Base upon Adduct Formation/ a.u. | Reorganisation Energy of Base/ kJ mol-1 |
| BH3-PH3 | -26.6211 | -26.6036 DOI:10042/to-7007 | 46 | -343.1733 | -343.1706 DOI:10042/to-7009 | 7 |
| BH3-PEt3 | -26.6211 | -26.5983 DOI:10042/to-7012 | 60 | -579.1296 | -579.1261 DOI:10042/to-7013 | 9 |
| BH3-P(Mes)2H | -26.6211 | -26.6007 DOI:10042/to-7015 | 54 | -1041.3417 | -1041.3387 DOI:10042/to-7017 | 8 |
| BF3-PH3 | -324.6642 | -324.6635 DOI:10042/to-6995 | 2 | -343.1733 | -343.1732 DOI:10042/to-7018 | 0 |
| BF3-PEt3 | -324.6642 | -324.6194 DOI:10042/to-6998 | 117 | -579.1296 | -579.1233 DOI:10042/to-7019 | 16 |
| BF3-P(Mes)2H | -324.6642 | -324.6271 DOI:10042/to-7022 | 97 | -1041.3417 | -1041.3380 DOI:10042/to-7026 | 10 |
It is expected that increasing steric hindrance would result in a larger reorganisational energy. However, this is not observed in the calculations presented above, where the reorganisational energy of adducts containing PEt3 is larger than adducts containing P(Mes)2H. This could be because PEt3 is a conformationally more flexible molecule than P(Mes)2H. Thus, although P(Mes)2H is a sterically more bulky group, PEt3 would have a greater degree of freedom to change its conformation to form a stable adduct, hence resulting in a greater reorganisation energy.
Conclusion
In conclusion, ab initio quantum mechanical calculations have proven to be a useful tool to investigate the various properties of lewis acids and bases as well as their corresponding adducts. The hardness of a free acid or base can be determined by considering the HOMO-LUMO gap as well as the polarisability of the HOMO orbitals. The NBO charges also elucidate some useful information on the changes that occur in the presence of electron withdrawing ligands. However, the electron donating effects of ethyl groups are not clearly observed here. In addition, quantum mechanical calculations can be used to explain the lower acidity of BF3 as compared to BCl3, an observation which has yielded several different explanations by different people. The effects of the different electronegativity of R groups of the bases and acids on the adducts as well as the effects of steric hindrance can also be investigated with quantum mechanical calculations.
References
- ↑ 1.0 1.1 J. B. Foresmann, A. Frisch, Exploring Chemistry with Electronic Structure, Gaussian Inc., Pittsburgh, 2nd Ed., 1993, pp. 97-99.
- ↑ M. R. Hartman, J. J. Rush, T. J. Udovic, R. C. Bowman Jr, S. J. Hwang, J. Solid State. Chem., 2007, 180, 1298. DOI:10.1016/j.jssc.2007.01.031
- ↑ M. S. Schuurman, W. D. Allen, H. F. Schaefer III, J. Comput. Chem., 2005, 26, 1106 DOI:10.1002/jcc.20238
- ↑ P. Atkins, J. D. Paula, Atkins’s Physical Chemistry, Oxford, New York, 8th ed., 2006, pp. 1011.
- ↑ J. Glaser, G. Johansson,Acta Chem. Scand. A, 1982, 36, 125. PDF
- ↑ D. J. Darensbourg, Inorg. Chem., 1979, 18, 14. DOI:10.1021/ic50191a003
- ↑ G. Hogarth, T. Norman, Inorg. Chem. Acta, 1997, 254, 167. DOI:10.1016/S0020-1693(96)05133-X
- ↑ F. A. Cotton, Inorg. Chem., 1964, 3, 702. DOI:10.1021/ic50015a024
- ↑ 9.0 9.1 R. G. Pearson, Inorg. Chem., 1988, 27, 734. DOI:10.1021/ic00277a030
- ↑ 10.0 10.1 10.2 10.3 10.4 10.5 D. F. Shriver, P. Atkins, T. Overton, J. Rourke, M. Weller, F. Armstrong, Inorganic Chemistry, Oxford, New York, 4th ed., 2006, pp. 127, 133.
- ↑ 11.0 11.1 T. Brinck, J. S. Murray, P. Politzer, Inorg. Chem., 1993, 32, 2622. DOI:10.1021/ic00064a008
- ↑ E. A. Robinson, S. A. Johnson, T.-H. Tang, R. J. Gillespie, Inorg. Chem., 1997, 36, 3022. DOI:10.1021/ic961315b

