Rep:Mod:larona
Physical Computational Chemistry
Introduction
Often in a reaction, a transition state cannot be isolated due to its short life time. By applying computational techniques, the structure and energies of the transition structures on a potential energy surface can be determined and visualized. In this exercise, the transition structures on the potential surfaces surface for the Cope rearrangement and Diels-Alder cycloaddition are calculated.
Method and Basis Set Used
In previous exercises, molecular mechanics and force field methods (e.g ChemBio3D) are used to determine the stable geometry of the molecule. However, when studying transition structures in large molecules, these methods are no longer useful. This is because molecular mechanics and force field methods can only provide the structure of the final optimized geometry instead of supplying information related to the type of bonds being broken and made as well as the changes in electronic distribution.
As such, a new method is introduced in this exercise, known as “molecule orbital-based” methods. By using this method, the Schrodinger equation can be solved numerically such that the transition structure can be located on the potential energy surface specifically. The method and basis set used in this exercise will mainly be Hartree-Fock (HF) and 3-21G.
The Cope Rearrangement
The Cope rearrangement is an example of [3,3] concerted pericyclic reaction, sometimes is regarded as a sigmatropic rearrangement reaction. This occurs when a σ-bond is migrated across the molecule and was first developed by Arthur C. Cope.[1] The mechanism of the 1,5 diene rearrangement is shown in Figure (i).
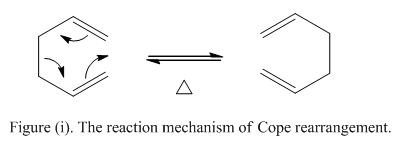
Note that 6 electrons are involved in this pericyclic reaction. As the reaction is proceed under heating condition, it is predicted that the reaction will undergo Huckel transition with suprafacial arrangement.
At first, it is suspected that the reaction is performed via a two-stage diradical intermediate, however, recent research showed that the reaction undergoes a concerted mechanism. The transition state formed can be either in a chair or boat conformation,[2] depending on the stereoelectronics of the doubles bonds. It is suspected that the boat conformation will be higher in energy relative to the chair confirmation. In order to study the reaction pathway of this sigmatropic rearrangement reaction, it is essential to locate the low-energy minima and the transition states on the C6H10 potential energy surface. One of the approaches is to optimize the reactants and products in this reaction.
Optimizing the Reactant and Products
From the previous session, it is found that 1, 5 hexadiene can undergo Cope rearrangement. Consider the structure of 1, 5 hexadiene, it has two C=C double at the edge of the molecule with C-C single bonds in between. The single bonds are able to exhibits free rotation such that the molecule is able to demonstrate either an “anti” (with dihedral angle of 0o) or a “gauche” linkage (with a dihedral angle of 180o between the four central carbon atoms). Optimization is preformed for both molecules such that the most stable structure is found.
Part A - Optimisation of the Anti Conformation
To perform an optimization to the anti-conformer of the reactant, a molecule of 1,5-hexadiene is drawn and cleaned using Guassianview. The conformer was then optimized using Hartree-Fock and 3-21G as the method and basis set. The starting geometry, as well as the optimized structure of the anti-conformer with its result summary table is as shown in Figure 1.

By using the Symmetrize function, the point group of the molecule is found to be Ci. The energy of the conformer is shown under the result table as shown in Figure 1 (i.e -231.69254 a.u). The geometry of the optimized structure is compared with the list of lowest energy conformers as given in Appendix 1. It was found that the structure obtained in this part of the exercise corresponds to anti-2.
Part B - Optimisation of the Gauche Conformation
Knowing that the molecule can also exist in gauche conformation, by adjusting the structure of the starting geometry, the conformer with gauche linkage is optimized. Note that the same method and basis set was used during the optimization. The starting and optimized geometry with the result table is as shown in Figure 2.
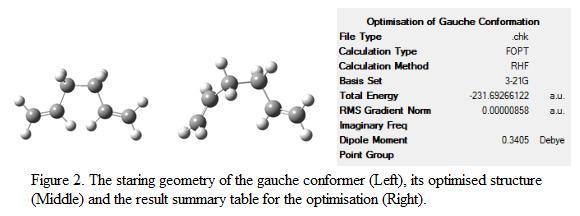
The point group of the optimized structure was determined and was found to be C1. It is expected that the anti-conformer will be more stable compare to the gauche-conformer due to steric effect. However, it turns out that the gauche-conformer is more stable with a total energy of -231.69266 a.u, giving an energy difference of 0.318 kJ mol-1. This is mainly due to the stabilization achieved by the electronic interaction between the πC=C orbital found in the double bond and the σ*C-H orbital found on the adjacent vinyl protons. This electron interacting effect reduced the overall energy of the molecule and hence stabilizing it. The conformer of the geometry is identified using Appendix A and is found to be in gauche-3 arrangement.
Part C & D – Determination of the Lowest Energy Conformation
In order to determine the activation energy and the enthalpy of the reaction, conformer with the lowest possible energy must be used as this will give a more accurate prediction. The “anti” and “gauche” geometry of the 1,5-hexadiene atoms is alternated manually and is optimized again. The geometries and point group of the structures are identified and are shown under Table 1.
| Type of conformer | Figure showing the optimized structure | Energy /a.u | Relative energy /kJ mol-1 | Name of conformer | Point Group | Jmol | File on D-space |
| Gauche | 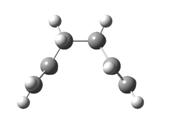 |
-213.69166 | +2.31 | Gauche-2 | C2 | DOI:10042/to-6119 | |
| Gauche |  |
0231.68962 | +7.67 | Gauche-5 | C1 | DOI:10042/to-6120 | |
| Gauche | 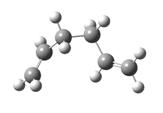 |
-231.69266 | 0.00 | Gauche-3 | C1 | DOI:10042/to-6121 | |
| Anti |  |
-231.68907 | +9.23 | Anti-3 | C2h | DOI:10042/to-6122 | |
| Anti |  |
-231.69097 | +4.44 | Anti-4 | C1 | DOI:10042/to-6124 | |
| Anti | 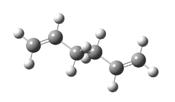 |
-231.69254 | +0.31 | Anti-2 | Ci | DOI:10042/to-6125 |
From Table 1, it is obvious that the gauche-3 conformer is the most stable structure. One would expect that the anti-conformers will be more stable due to minimum steric hinderance. However, the stereo-electronic effects have to be included as well. This can be explained using the figure as shown below:
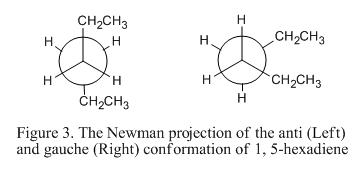
From the above figure, it can be seen that if the CH2CH3- groups are placed anti-periplanar to each other. Electronic interaction between the πC=C (in the double bond) and σ*C-H orbital (found on the adjacent vinyl protons) will not be able to occur. As such, stabilization effect cannot be achieved. However, if the CH2CH3- groups are in gauche arrangement, electronic interaction will be able to occur such that the molecule can be further stabilize. This showed that when considering the configuration of the low-energy conformer, the stertic factor as well as the electronic interaction behavior has to be taken into account.
Part E – Comparing the Calculated Final Energy of the Anti-2 Conformer with the Energy Given
The anti-2 conformer has been optimized in part d as shown in Table 1. The energy of the conformer is found to be -231.69253506 (~-231.69254), which is the most stable conformer among the rest of the anti conformers. The total energy of the anti-2 conformer is given to be -231.69254. This shows that the calculated value matches with the given value and the structure can be used in the next part of the calculation.
Part F – Re-optimization of Anti-2 Conformer using B3LYP/6-31G(d)
The method and basis set used in part a – e is HF and 3-21G. Note that 3-21G is the minimal basis set that contains a minimum number of basis function for each atom during the calculation. Although the computation cost is inexpensive, the calculation result may not be as accurate when compare to the actual results. In this part of the exercise, it is decided to use a better basis set and method (i.e 6-31G(d) and B3LYP). This basis set adds d function to the heavy atoms and would improve the accuracy of the calculation. The point group of the final optimized geometry is found to be Ci. The result summary tables obtained from HF/3-21G and B3LYP/6-31G(d) are compared and is shown in Figure 4.

The total energy of the optimized structure is displayed in the result table. The total energy of the re-optimised structure is found to be -234.61172 a.u. Comparing the total energy obtained using HF/3-21G and B3LYP/6-31G(d), it is found that the latter basis set and method produced structures with lower energy. One would expect that a more stable conformer has been optimized. However, as the geometry generated are based on different basis set, the energy of the conformer therefore cannot be compared directly. The structure of the conformers shown in Figure 4 does not show significant change of the structure of the molecule. In order to investigate the change in geometry upon optmization, the dihedral angle and the bond length between the carbon atoms are compared. This is shown under Table 2. The labeling of the atoms is shown in Figure 5.

| Level of theory used | C=C Bond length /Å | Bond length (C2-C3 and C4-C5) / Å | Bond length (C3-C4) /Å | Dihedral angle (C1-C2-C3-C4) /o | Dihedral angle (C2-C3-C4-C5) /o | Dihedral angle (C3-C4-C5-C6) /o |
| HF/3-21G | 1.32 | 1.51 | 1.55 | 114.7 | 180.0 | 114.7 |
| B3LYP/6-31G(d) | 1.33 | 1.50 | 1.55 | 118.8 | 180.0 | 118.8 |
By comparing the values of bond length and dihedral angle obtained, it is found that the difference between the values are not significant except the fact that the dihedral angle between C1-C2-C3-C4 increases by 4 degree when a better level of theory is used. The literature value of a C-C and C=C bond is 1.54Å and 1.34Å respectively.[3] This shows a good agreement between the experimental and the calculated results.
The link for the output file of this optimization can be view here: DOI:10042/to-6116
The jmol structure can be viewed here:
Part G – Frequency Analysis of the Optimized Anti-2 Conformer
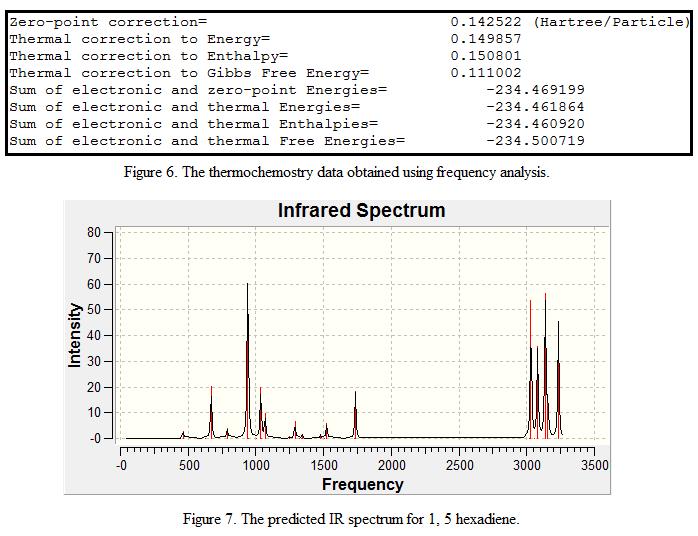
In order to confirm that the geometry that was optimized in Part F is a minimum point, a frequency analysis was carried out. The low frequencies are recorded and displayed under Table 3 with an IR spectrum shown in Figure 6. Note that only the first 6 “Real Normal Mode Frequencies“are shown as 1,5-hexadiene contains 16 atoms. In theory, it should contain 42 modes of vibration.
| Low Frequency /cm-1 | -15.1 | -0.0006 | -0.0005 | 0.0007 | 3.5 | 18.6 |
| Real Normal Mode Frequency cm-1 | 76.6 | 84.2 | 121.5 | 220.3 | 348.9 | 394.5 |
From the table, it is found that the “low frequencies” generated by the calculations are close to zero. This shows that the results obtained are fairy reliable for analysis. In addition, all the read normal mode frequencies are positive with no imaginary frequencies (imaginary frequencies are represented by negative frequencies). This further ensures that the calculated geometry is a minima.
By running the frequency analysis, information such as the sum of electronic and zero point energies, the sum of electronic and thermal enthalpies and the predicted IR spectrum can be obtained. These energies and the IR spectrum are recorded and shown in Figure 6 and 7. (N.B the zero-point correction energy can also be obtained in this analysis)
The output file of the frequency analysis can be view here: DOI:10042/to-6117
Optimizing the “Chair” and “Boat” Transition Structures
Previous sections show that 1, 5 hexadiene molecule undergoes Cope rearrangement via a chair or a boat transition state. In this part of the exercise, it is intended to investigate the structure of these transition states as well as their energies.
Part A – Optimisation of an Allyl Fragment
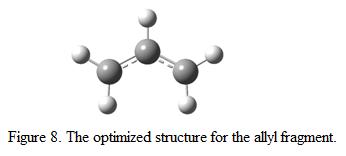
It is suspected that the “chair” transition structure consists of two C3H5 allyl fragment. Hence, by optimizing a C3H5 allyl fragment and combine the fragments together should give a structure more or less similar to the chair conformation. The C3H5 allyl fragment is optimized using HF/3-21G as the method and the basis set. The optimized structure is as shown in Figure 8.
The jmol of the optimized structure can be viewed here:
The output file of the optimization can be viewed here: DOI:10041/to-6126
Part B – Optimization of the Chair Transition State using Hessian Calculation
To model a chair transition state, two optimized allyl fragments were used (which is obtained in part A). The fragments were adjusted manually such that the structure looks similar to a chair conformation. Hessian calculation was then applied to the molecule such that the force constant matrix could be calculated. The level of theory used in the re-optimized process is HF/3-21G. Note that the keyword Opt+Freq was used such that optimization and frequency analysis can be calculated at the same time. The structure was optimized to a transition state (Berny). The proposed structure of the chair conformation is shown in Figure 9 whereas the optimized structure, together with the result summary table and vibrational analysis result is displayed in Figure 10.
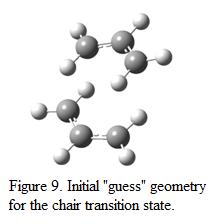
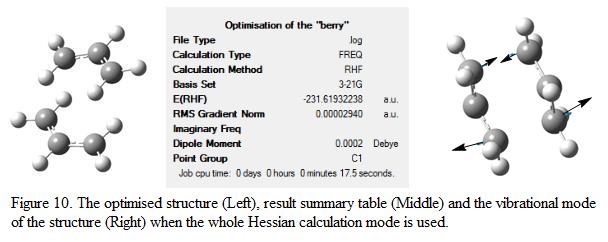
The energy of the “guess” transition state structure is found to be -231.61932 a.u, which is of higher energy compare to the anti-2 reactant. This shows that by forming a chair conformation, the total energy of the system increases(indicated that the system is passing through a high energy barrier). One negative frequency is observed in the frequency analysis at about 818cm-1, indicating the presence of transition state (or a saddle point) on the potential energy surface. The mode of vibration corresponds to this negative frequency is shown in Figure 10. This shows that at one end, two of the carbon atoms move towards each other and a new bond is formed whereas on the other end of the molecule, two carbon atoms move away from each other. This illustrated that the atoms are trying to move away in order to reduce repulsion and maintain stabilization of the structure.
The output file of this optimization can be view in the following link: DOI:10044/to-6147
The jmol structure can be viewed here:
Part C & D - Optimization of the Chair Transition State using the Frozen Coordinate Method
Another approach to determine the structure of the transition state is to employ the Frozen Coordinate Method in which the position of the terminal carbon atoms in the allyl fragment are frozen while the rest of the molecule is being optimized. This can be done by using the keyword Opt=ModRedundant. Once the optimization is complete, the co-ordinates will then be “unfrozen” and the whole structure can be re-optimized again to give the structure of the transition state. By using this approach, the whole set of force constant matrix will not need to be computed. Instead, the Hessian calculation is differentiated along the reaction coordinate. This approach reduces the computational cost for the calculation. The distance between the two terminal carbon atoms in the allyl fragment was first set to be 2.2Å. After the first optimization, the bonds that were fixed in the first part of the optimization were relaxed and optimized. The optimized geometry and result summary table is as shown in Figure 11.
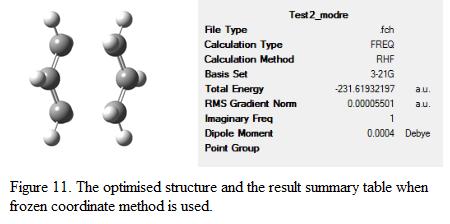
The length of the bond corresponding to bond forming and breaking is checked and compared to the results obtained in part b. This is as shown in Table 4.
| Level of theory used | Direct optimization using TS (Berny) | Optimization using frozen coordinate method (also TS Berny) |
| Energy /a.u | -231.69322 | -231.69322 |
| C-C Bond formation length /Å | 2.02 | 2.02 |
| C-C Bond breaking length /Å | 2.02 | 2.02 |
| Imaginary Frequency /cm-1 | -817.94 | -818.04 |
| File on D-space | DOI:10042/to-6147 | DOI:10042/to-6148 |
From the table, it can be seen that the total energy of the structure remains the same, so does the C-C bond making and breaking distance. There is only a slight difference between the imaginary frequencies. Therefore, it is expected both method would be able to generate the transition structure of 1, 5 hexadiene. However, there are limitations for both methods. For example, if the starting “guess” structure for the transition state is not close to the expect transition state, the structure being optimized may not have the correct geometry whereas by using frozen co-ordination method, a more accurate result can be generated. As it is a two-step optimization process, the time needed for running the calculation may increase. In this calculation, it is clear that the transition state bears a “chair” conformation such that the optimization process can be preformed efficiently by using both methods.
The jmol structure can be viewed here:
Part E – Optimization of the Boat Conformation
After optimizing the “chair” transition structure, the "boat" conformation is optimized using a different method known as QST2. The transition structure can be identified by inputting the co-ordinates and modeling the structure of the starting reactant and the product. To start off with, two allyl fragments (anti-2 obtained from previous exercise) is viewed simultaneously in the Gaussian window and the numbering of the atoms have been changes such that the numbering system of the atoms in molecule is the same. The numbering system of the fragments is as shown in Figure 12.
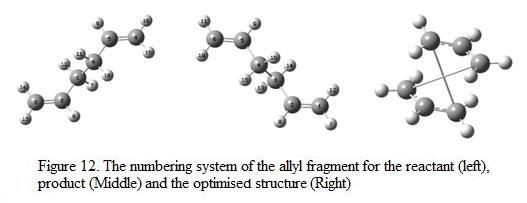
The optimization of this set of reactant and product is not successful and the structure obtained is shown in Figure 12. An error message appeared in the end of the log file. This is due to the fact that there is a significant difference between the geometry of the allyl fragments and the transition structure. In addition, the rotation occurs around the centre single bond is being omitted such that Gaussian is not able to deduce the transition structure.
In order to improve the efficiency of the calculation, the dihedral angle between the allyl fragments was changed from 180o to 0o and yet the bond angle between C2-C3-C4 and C3-C4-C5 was changed as well (to 100o). The numbering system and arrangement is shown in Figure 13. The structure is then re-optimized again using HF/3-21G level of theory.
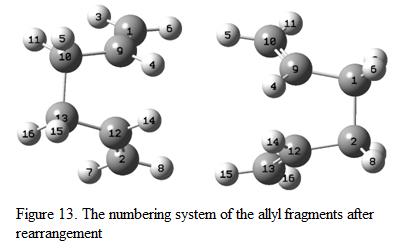
After changing the dihedral angle, the boat conformation is obtained. The optimized structure, its result summary table as well as its imaginary frequency mode is shown under Figure 14.
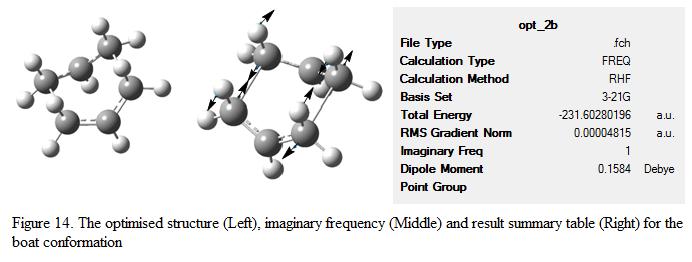
The energy of boat conformation was found to be -231.6028 a.u, which is 43.4 kJ mol-1 less stable compare to the chair conformation (n.b the total energy for the chair conformation is -231.6193 a.u). The imaginary frequency was found to be -840 cm-1, which is lower than one calculated for the chair structure (i.e -818 cm-1). This showed that the structure obtained is a transition state.
The output file of this calculation can be viewed here: DOI:10042/to-6131
The jmol of the structure can be viewed here:
Part F – IRC Calculation of the Chair Conformation
Once a transition state is formed during the reaction, a product will be produced that has a lower energy. However, the geometry of the final product cannot be predicted as there are many possible minima available along the potential energy surface (PES). In order to determine the geometry of the final product, it is intended to use the Intrinsic Reaction Coordinate (IRC) method. By using this method, the energy pathway going from the transition state down to its local minimum can be determined and the conformer that corresponds to this energy can be identified.
The IRC calculation was preformed for the chair conformation in the forward direction as the reaction co-ordinate is symmetric, while the force constant has set to be run once only (as this makes the calculation simpler). The number of points running along the IRC was set to be 50 such that to ensure the structure reaches the minimum energy. The result for this IRC calculation is shown in Figure 15.

From the figure, it can be seen that the calculation is not complete as the plateau is not shown on the graph and the RMS gradient is not close to zero. The geometry of the structure generated is as shown in Figure 16. The result summary table is checked and the total energy of the molecule is -231.6886 a.u and the point group is C2. Note that there is one imaginary frequency found in the calculation, this shows that the minimum geometry is not yet achieved.
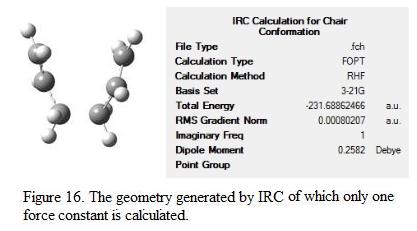
As the calculation has not yet finished and a minimum point is not generated yet, it was decided to run the calculation again. Instead of calculating the force constant for once only, the constant was calculated at every step of the calculation. Although this approach will make the calculation more expensive, it generates a much accurate and reliable result for the analysis. The RMS and total energy graph as well as the structure generated are shown under Figure 17 and 18 respectively.
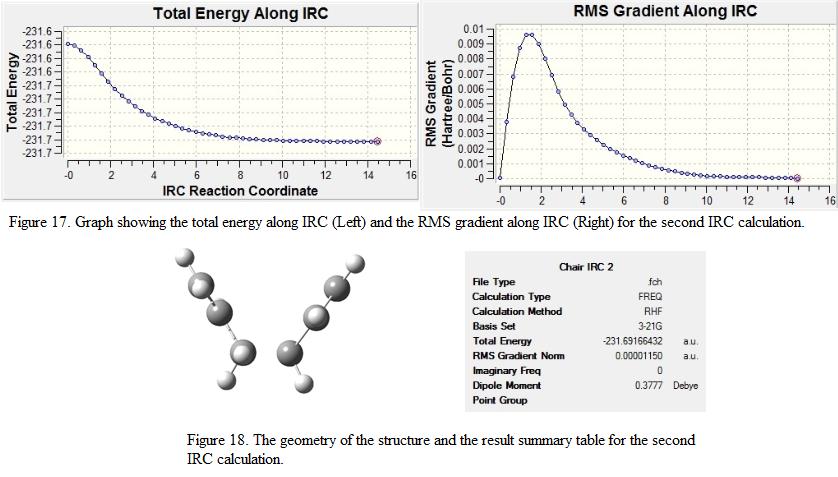
From the result summary table, it can be seen that no imaginary frequencies are found and the calculation is said to be completed. This can also be reflected by the plateau shown in the RMS gradient in Figure 17 where the points on the graph approach to zero. The total energy of the structure is found to be -231.69166, which is more stable compare to the energy obtained from the first IRC calculation (c.f -231.6886 a.u). The point group of the structure is found to be C2. From the point group and the energy obtained from the IRC calculation, it can be deduced that the chair conformation transition structure leads to the formation of the gauche-2 structure (N.B the energy of the stable conformations are shown under Table 1). The jmol structure as well as the output file for the calculations are shown as below:
Output file obtained from the first IRC calculation:DOI:10042/to-6149
Output file obtained from the second IRC calculation:DOI:10042/to-6150
Jmol structure for the first IRC calculation:
Jmol structure for the second IRC calculation:
Part G – Determination of Activation Energy
In order to determine the activation energy of the reaction, the structure of the boat and chair conformation was optimized re-optimized using B3LYP/6-31G(d) as the level of theory. It was then followed by a frequency analysis. The temperature of which the calculation was preformed was set to be 298.15 and 0K respectively. The thermochemistry data is obtained using the similar method as shown in previous section in the log files. These data are recorded and is shown under Table 5. Note that the energies are corrected to 5 decimal places.
Table 5. The thermochemistry data obtained for the chair, boat and the starting reactant using different level of theory.
| Level of theory used | HF/3-21G | HF/3-21G | HF/3-21G | B3LYP/6-31G(d) | B3LYP/6-31G(d) | B3LYP/6-31G(d) |
| Type of energy recorded /a.u | Electronic energy | Sum of electronic and zero-point energies at 0K | Sum of electronic and thermial energies at 298.15K | Electronic energy | Sum of electronic and zero-point energies at 0K | Sum of electronic and thermial energies at 298.15K |
| Chair Transition Structure | -231.6193 | -231.4667 | -231.4613 | -234.55698 | -234.41493 | -234.40901 |
| Boat Transition structure | -231.6028 | -231.4505 | -231.4453 | -234.54301 | -234.40190 | -234.39601 |
| Anti-2 (reactant) | -231.69254 | -231.53954 | -231.53257 | -234.61172 | -234.46920 | -234.46186 |
The structure obtained using HF/3-21G and B3LYP/6-31G(d) looks fairy similar. However, the total energy of the structure is found to be significantly different. This is due to the fact that B3LYP/6-31G(d) is a better method for running stimulation. As such, the total energy of the structure can be lowered further. The activation energy of the reaction can be calculated using the following equation:
Ea = Sum of electronic and zero-point energies of TS - Sum of electronic and zero-point energies of reactant
The activation energies for different reactions have been calculated and are compared with the experimental results. This is shown as below in Table 6.
| Level of theory used | HF/3-21G | HF/3-21G | B3LYP/6-31G(d) | B3LYP/6-31G(d) | Experimental results |
| Temperature of which the calculation was carried out | 0 | 298.15 | 0 | 298.15 | 0 |
| ΔE (Chair) /kcal mol-1 | 45.7 | 44.8 | 34.1 | 33.2 | 33.5+0.5 |
| ΔE (Boat) /kcal mol-1 | 56.2 | 54.8 | 42.2 | 41.3 | 44.7+2.0 |
The calculation shows that a higher energy is need to form a boat transition state than chair transition state during the reaction. This is because the chair conformation is more stable(this is proven in the previous section). By comparing with the experimental result at 0K, it was found that the experimental results are similar to the calculated results when B3LYP/6-31G(d) is used. Notice that the values obtained using B3LYP/6-31G(d) is closer to the experimental values compare to those obtained by HF/3-21G. This is because B3LYP/6-31G(d) is a better basis set which involved density function theory and the addition of d function into the heavy atoms. To conclude, by using computational method, the activation energy can be predicted. The accuracy of the prediction can be improved by using a better basis such as 6-311G(d) or 6-31G(d,p) in which more diffuse functions are added in the calculation. However, the computational cost will increase as well.
The Diels Alder Cycloaddition
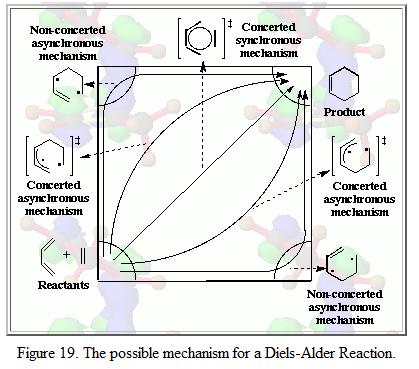
Dials Alder reaction is also known as Dials Alder Cycloaddition. This is because during the reaction, a diene interacts with a dieniphile (adds on to it) such that a cyclic compound is formed. There are number of ways to describe a Dials Alder reaction such as [4π + 2π ] (if referring to the number of π electrons in the system) or [3+2] addition (if referring to the number of atoms involved in the system). There are number of mechanisms proposed by the literature, it is mainly divided into two classes: (i) synchronous and concerted, multistage and (ii) multistage and asynchronous. Figure 19 illustrated these mechanisms:[4]
In this part of the exercise, it is intended to investigate the cycloaddition of butadiene and ethylene as well as reaction between 1,3-cyclohexadiene and maleic anhydride. By studying their MO and carry out electron count, it is possible to predict whether the reaction is allowed or forbidden.
Part A – Optimisation and Stimulation of MOs for Butadiene and Ethylene
When butadiene and ethylene is mixed together, the ethylene molecule will approach the butadiene molecule from above and a Diels Alder cycloaddition is observed. In this case, butadiene is the diene and ethylene is being the dienophile. This causes the interaction between the π orbitals of the diene and dienopile, leading to the formation of two new σ bonds. Hence, this is an example of [4π + 2π ] Diels Alder reaction. The reaction scheme of this reaction is shown in Figure 20.

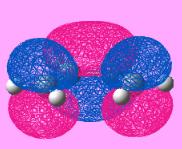
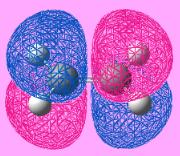
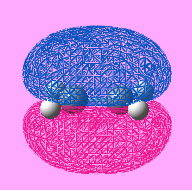
In order to study this reaction, the structure of butadiene and ethylene is modeled using Gaussian and is put through for optimization using semi-empirical molecular orbital method, AM1. The MO of the molecule is generated by adding the keyword pop=full into the input file. By evaluating the symmetry of the MO with respect to the reflection plane, the MO can be classified as symmetric or asymmetric. This is helpful for determining whether the reaction is allowed or forbidden. The HOMO-LUMO region of the molecules is identified and is shown under Table 7. Note that in the calculation, cis- butadiene is used.
| Item | HOMO of butadiene | LUMO of butadiene | HOMO of ethylene | LUMO of ethylene |
| Shape of the molcecule orbital | 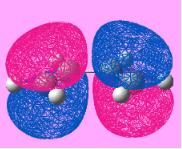 |
 |
 |
 |
| Symmetry of the MO | Anti-Symmetric | Symmetric | Symmetric | Anti-Symmetric |
| Energy of the MO/ a.u | -0.343 | +0.017 | +0.052 | -0.387 |
| Total energy of the molecule /a.u | 0.04879 | N/A | 0.02619 | N/A |
| Jmol | N/A | N/A | ||
| D-Space | DOI:10042/to-6165 | N/A | DOI:10042/to-6164 | N/A |
By investigating the symmetry of the MOs with respect to the reflection plane, the symmetry of the MO can be determined. From the table it can be seen that the HOMO of butadiene and the LUMO ethylene are having the same symmetry whereas the symmetry of the LUMO of butadiene and the HOMO ethylene. According to the rule of orbital interaction, the orbitals can only interact with each other when the symmetry of the orbitals is identical. As such, the HOMO from the butadiene will be able to interact with the LUMO of ethylene whereas the LUMO from the butadiene will be able to interact with the HOMO of ethylene.
The energy of the orbital is recorded and is found that the energy of the MO with the same symmetry will have a similar energy (i.e the anti-symmetric orbitals are closer in energy). This shows that they are likely to interact with each other. In addition, in this case, the LUMO is ethylene is more stable than the HOMO of butadiene. As such, it is able to act as an electron donor, donating electrons into a higher energy HOMO butadiene orbital.
Part B – Optimisation of the Transition State
The transition state of this Diels Alder reaction can be calculated by modeling the butadiene and ethylene fragment to form an envelope type structure. Several types of method can be used to calculate the transition structure(TS), for example, using QST2 to generate the TS by modeling the starting reactant and the product, TS Berny can also be used by modeling the two fragment such that it looks similar to the TS.
In this exercise, TS Berny is used to generate the TS by using HF/3-21G level of theory. This is because this is a well-known Diels Alder reaction and the TS structure can be easily modeled by placing the ethylene fragment over the butadiene. It is chosen to calculate the force constants once as this makes calculation much simpler. The optimized structure and the thermochemistry data obtained from the output file is shown under Figure 21. The name system of the structure is shown under Figure 22. In order to illustrate how the TS is formed, the bond lengths and the bond angles are measured and compared with the bond lengths for the starting material. These are shown under Table 8. The distance between the two terminal carbon atoms in the allyl fragment is first set to be 2.2Å.
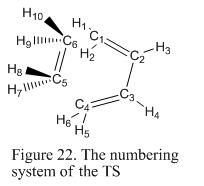
| Type of bond length being measured /Å | Starting geometry | Final geometry |
| C1-C6 Bond forming | 2.20 | 2.12 |
| C4-C5 Bond forming | 2.20 | 2.12 |
| C1=C2 | 1.34 | 1.38 |
| C2-C3 | 1.45 | 1.40 |
| C3=C4 | 1.34 | 1.38 |
| C5=C6 | 1.33 | 1.38 |
In order to describe the change in bond distance during the formation of TS, the literature value of a Csp3-Csp3 and Csp2-Csp2 bond length has to be defined. These two bond lengths are found to be 1.54 and 1.34Å respectively.[5] The Van der Waals radius of carbon is found to be 1.70Å. [6]
Considering the C1-C6 and C4-C5 bond forming distance, the distance decrease as the TS is formed, showing that the two fragments are approaching each other to form a new bond. However, comparing with the Csp2-Csp2 bond length (1.34 Å) and twice of the Van der Waal radius, it is found that there is a the calculated bond length is larger than the Csp2-Csp2 bond length but is shorter than the Van der Waal radius at the same time. This shows that the fragments are undergoing bond formation process such that the calculated bond length is half way between the two values.
The length of the C=C increases during the optimization (i.e from 1.34 to 1.38). This is because these double bonds will be broken during the reaction to form a single bond. As a C-C bond is longer than a C=C bond, therefore, the change in the C=C bond length is observed. On the other hand, the C-C single bond decreases during the formation of the product. This is because a C=C bond will be formed between C2 and C3 once the reaction is completed (refer back to Figure 20).
To ensure that the geometry obtained is a transition state, a frequency analysis has been preformed and the results shows that one imaginary frequency is found (at 956.2 cm-1). The lowest positive frequency is found at 147.2 cm-1. This confirmed that the structure obtained is indeed a transition state. These modes of vibrations are shown under Figure 23.
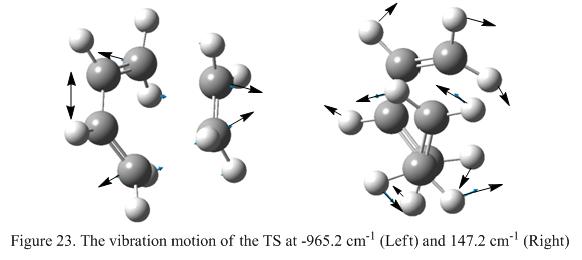
Figure 23 shows that when the vibrational frequency is negative (i.e -956.2cm-1), the two carbon atoms found on the ethylene fragment moves towards the butadiene fragment at the same time. The C2-C3 bond decreases in length as two carbon atoms on the ethylene approaches the butadiene fragment. From this analysis, it can be see that the formation of the σ-bonds in this reaction is indeed synchronous, showing that the mechanism of this reaction is concerted. However, considering the vibration mode found at 147.2cm-1, it shows a rocking motion. However, the motion is found to be in a asynchronous fashion.
The HOMO and LUMO of the TS is generated and is shown under Figure 24. Again, by inspecting the symmetry of the MO with respect to the reflection plane, the symmetry of the MO can be defined. The HOMO of the TS bears with an asymmetric symmetry. According to the rule of orbital overlapping and Table 7, it is found that this is formed when the HOMO of butadiene interacts with the LUMO of ethylene where as the LUMO of the TS is formed when LUMO of butadiene interacts with the HOMO of ethylene since the symmetry of the LUMO in TS is found to be symmetric.
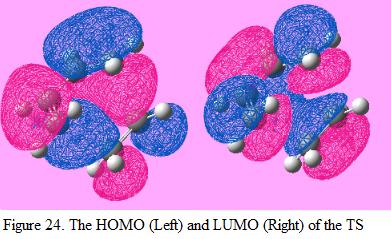
The energy of the orbitals found in the TS can be calculated by using the equation of ELUMO – EHOMO. By applying this equation, the orbital energy for the interaction between the HOMO of butadiene and LUMO of ethylene is found to be (0.052 – [-0.343]) = 0.395 a.u where as the orbital energy for the interaction between the LUMO of butadiene and HOMO of ethylene is (0.017 – [-0.387]) = 0.404 a.u. From this calculation, it can be seen that by overlapping the HOMO of butadiene with the LUMO of ethylene, the orbital energy will be lowered. Hence, this is can be used to explained why this reaction is allowed.
The output file of thsi calculation can be viewed here: DOI:10042/to-6166
The jmol of the TS can be viewed here:
Part C – The Study of the Region-selectivity of the Diels Alder Reaction
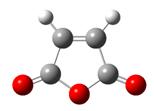
In this exercise, the reaction between cyclohexa-1,3-diene and maleic anhydride is studied. There are two possible products for this reaction; endo and exo). If the reaction is under kinetic control, the endo conformer will become the major product as it has a lower energy transition state. In the other words, kinetically control reaction would result in the formation of the high energy exo- transition state. The reaction scheme is as shown under Figure 25. In this exercise, it is aimed to investigate the transition structure which would lead to the formation of the endo and exo product. The level of theory used will be HF/3-21G and the transition structure is predicted using TS(Berny) method.

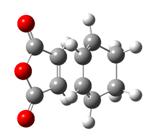
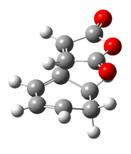
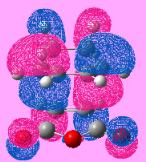
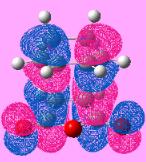
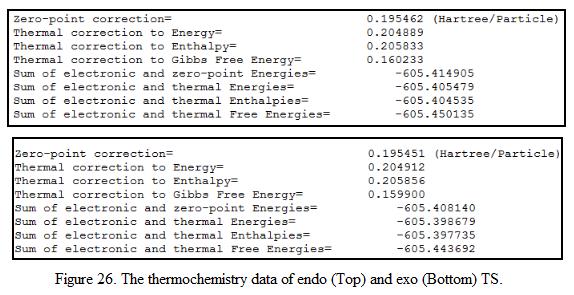
In order to obtained the TS in this reaction, it is essential to optimize the structure of the two reacting fragment first (i.e cyclohexadiene and maleic anhydride). The HOMO-LUMO region of the molecule was studied such that the orbitals involved in this reaction could be visualized easily. When the fragments were optimized, the maleic anhydride fragment was placed above the cyclohexadiene fragment. The structure of the “guess” transition was then adjusted manually such it looked similar to the exo and endo TS. The structure was further optimized the level of theory (HF/3-21G) with TS Berny method such that the TS structure was obtained. The HOMO-LUMO of starting material and the product was visualized and the energy of the orbital was recorded. In addition, to confirm that the TS is obtained from the calculation, frequency analysis has been carried out and the negative frequency of the vibration was investigated. This is shown under Table 9. A copy of thermochemistry data is obtained from the output file. This is shown under Figure 26.
| Type of fragment | Cyclohexadiene | Maleic anhydride | Endo TS | Exo TS |
| Optimized structure | 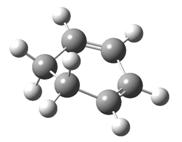 |
 |
 |
 |
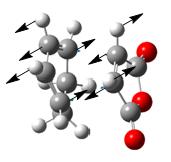
| Negative frequency in frequency analysis (if any) /cm-1</sip> | N/A | N/A | -643.7 | -647.4 |
| Figure showing vibration mode | N/A | N/A | 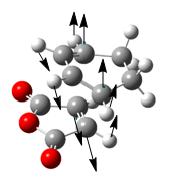 |
 |
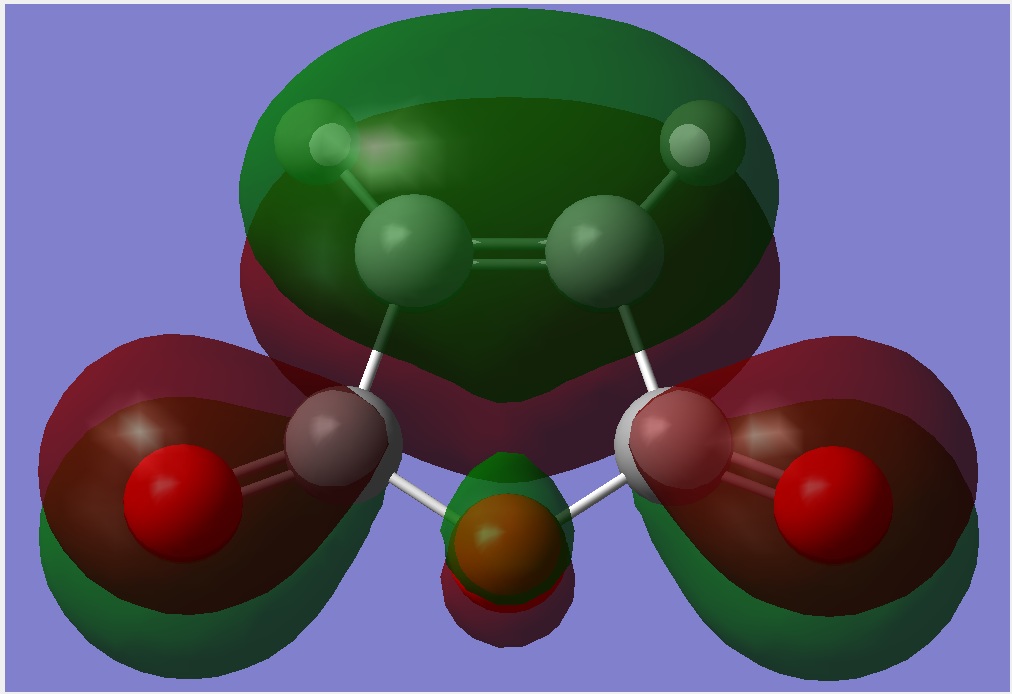
| HOMO | 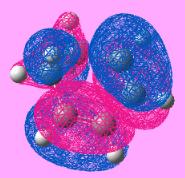 |
 |
 |
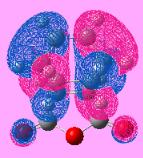 |
| Symmetry of HOMO | Anti-symmetric | symmetric | Anti-symmetric | Anti-symmetric |
| Energy of the HOMO/ a.u | -0.302 | -0.447 | -0.324 | -0.323 |
| LUMO | 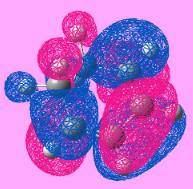 |
 |
 |
 |
| Symmetry of LUMO | symmetric | Anti-symmetric | Anti-symmetric | Anti-symmetric |
| Energy of the LUMO /a.u | 0.136 | 0.025 | 0.073 | 0.058 |
| Total Energy of the fragment/TS | -230.54323 | -375.10351 | -605.61037 | -605.60359 |
| D-Space | DOI:10042/to-6159 | DOI:10042/to-6157 | DOI:10042/to-6160 | DOI:10042/to-6161 |
| Jmol |
From the table, it can be seen that the TS calculated is indeed a TS due to the presence of the negative imaginary frequency (i.e at 643.7 and 647.4cm-1 respectively. At these frequencies, the C=C bond from maleic anhydride approaches to the two of the sp2 carbon atoms in the cyclohexadiene, causes the formation of the bridgehead in the product.
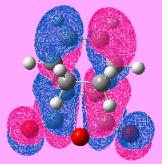
Table 9 also shows that the endo TS has a lower energy when comparing to the exo TS (i.e energy difference is found to be 17.8 kJ mol-1), indicating that the endo TS is more stable and will be formed if the reaction is under kinetic control. From symmetry analysis, it can be seen that the TS has an anti-symmetric symmetry. According to the rule for orbital overlapping, it can be deduced that the TS is formed by overlapping the HOMO of cyclohexadiene and the LUMO of maleic anhydride.
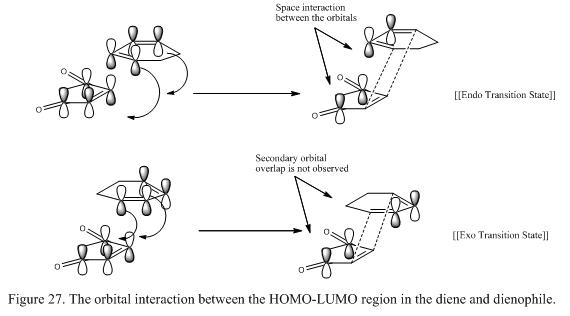
Consider the structure of both the endo and exo TS, it is found that in the exo TS, steric effect is presented between the -(C=O)-O-(C=O)- fragment from maleic anhydride and the bridgehead formed from cyclohexadiene. As a result, the overall energy will increase and the structure is destabilized. However, in the endo product, this steric effect is slightly smaller as the -(C=O)-O-(C=O)- fragment is placin away from the CH2-CH2 bridgehead. This stabilization effect can also be explained using secondary orbital theory. In this case, in the endo TS, the πC=O orbital of maleic anhydride interact with the πC=C orbital from cyclohexadiene and stabilizing the structure. Although a bond is not formed, this contribution to the stabilization effect is significant. However, this effect is not observed in the exo TS as the πC=O orbital from maleic anhydride is facing away from the πC=C orbital of cyclohexadiene such that interaction is not favourable. This effect is illustrated in Figure 27.
Conclusion
By using TS(Berny) and TS(QST2) optimization together with frequency analysis, the transition structure and its vibrating motion can be investigated. Hence, the reaction mechanism will be able to define. In addition, by stimulating the HOMO and LUMO of the reactant, one can predict the types of orbital involved in the reaction. This is a very useful technique as the transition state may have a very short life time and cannot be studied. In order to improve the computational results (i.e making the results more accurate compared to the experimental ones), it is suggested that to use a better basis set, for example B3LYP 6-311G (d,p).
Reference
- ↑ Arthur C. Cope; et al. J. Am. Chem. Soc. 1940, 62, 441.
- ↑ Keiji. Morokuma, J. Am. Chem. Soc., 1988, 110 (13), 4474–4475 DOI:10.1021/ja00221a092
- ↑ http://en.wikipedia.org/wiki/Bond_length
- ↑ http://www.ch.ic.ac.uk/motm/porphyrins/introDA.html
- ↑ M. J. S. Dewar, Tetrahedron, 1960, 11, DOI:10.1016/0040-4020(60)89012-6
- ↑ A. Bondi, J. Phys. Chem., 1964, 68, 441DOI:10.1021/j100785a001

