Rep:Mod:ks4817inorganic2
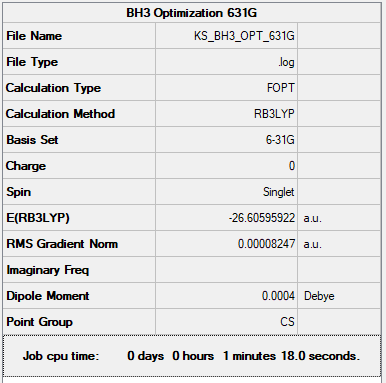
BH3
General Info
B3LYP/631G
         Item               Value     Threshold  Converged?
 Maximum Force            0.000204     0.000450     YES
 RMS     Force            0.000099     0.000300     YES
 Maximum Displacement     0.000874     0.001800     YES
 RMS     Displacement     0.000421     0.001200     YES
 Low frequencies ---   -0.2098   -0.0208   -0.0046   47.4912   48.2380   48.2384
 Low frequencies --- 1153.2234 1209.9312 1209.9336
BH3 |
Frequency Analysis
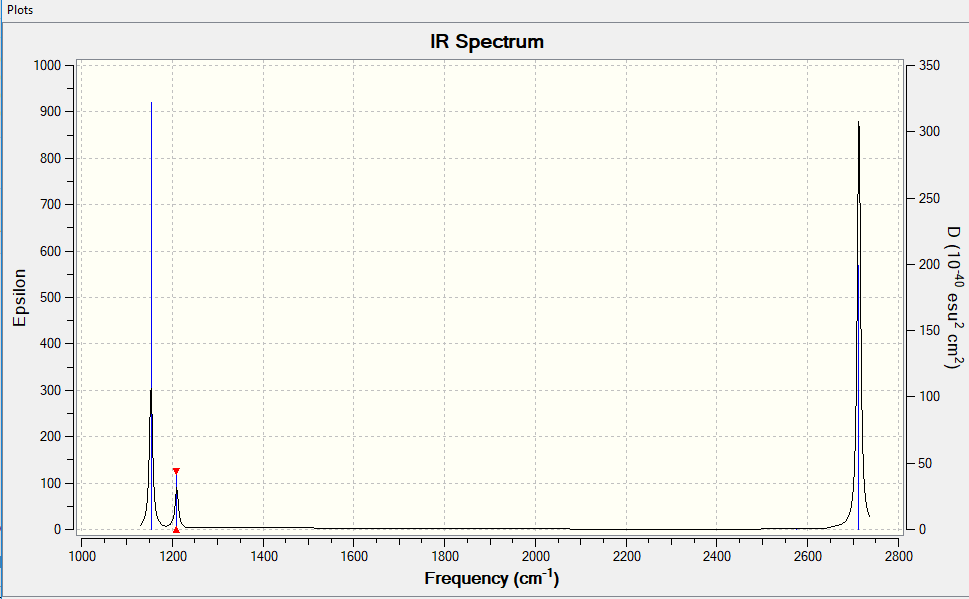
Vibrational spectrum for NH3
| Wavenumber (cm-1) | Intensity (arbitrary units) | Symmetry | IR active? | Type |
| 1153 | 93 | A2' ' | yes | out-of-plane bend |
| 1210 | 13 | E' | very slight | bend |
| 1210 | 13 | E' | very slight | bend |
| 2575 | 0 | E' | no | symmetric stretch |
| 2713 | 136 | E' | yes | asymmetric stretch |
| 2713 | 136 | E' | yes | asymmetric stretch |
There are only 3 peaks in the IR spectrum, this is because there are two sets of degenerate frequencies (1210 cm-1 and 2713 cm-1) which mean the frequency bands on the IR overlap and one frequency band is non IR active (2475 cm-1) therefore it doesn't appear, so we only see 3 peaks.
You've identified the correct reasons for why there are only 3 visible peaks and given good information in the table. However, your BH3 molecule is the wrong symmetry leading to incorrect symmetries for vibrational modes. Smf115 (talk) 09:12, 22 May 2019 (BST)
MO Analysis
The MO diagram with the LCAO and visualised orbitals of BH3 can be seen bellow:
There are no significant differences between the LCAO MOs and generated MOs (except that the generated MOs show the electron density already combined). This shows the significance in chemistry of using computational chemistry techniques to visualize MOs as they are accurate and this saves time and the difficulty of visualising orbitals in 3D.
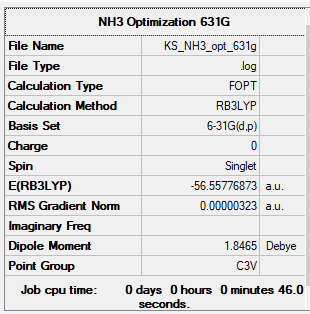
NH3
General Info
B3LYP/631G(d,p)
         Item               Value     Threshold  Converged?
 Maximum Force            0.000006     0.000450     YES
 RMS     Force            0.000004     0.000300     YES
 Maximum Displacement     0.000012     0.001800     YES
 RMS     Displacement     0.000008     0.001200     YES
Low frequencies ---   -8.5646   -8.5588   -0.0047    0.0454    0.1784   26.4183
Low frequencies --- 1089.7603 1694.1865 1694.1865
NH3 |
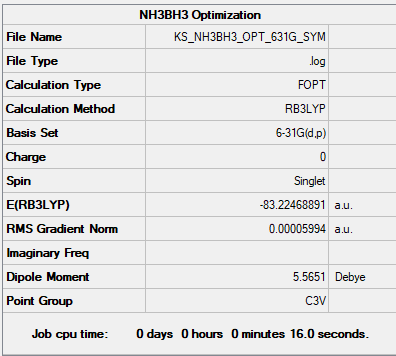
NH3BH3
General Info
B3LYP/631G(d,p)
Item               Value     Threshold  Converged?
 Maximum Force            0.000122     0.000450     YES
 RMS     Force            0.000058     0.000300     YES
 Maximum Displacement     0.000531     0.001800     YES
 RMS     Displacement     0.000296     0.001200     YES
 Low frequencies ---   -0.0573   -0.0499   -0.0074   21.6972   21.7073   40.5564
 Low frequencies ---  266.0216  632.3607  640.1371
NH3BH3 |
Energy Calculations
A summary of the estimated energies in a.u. can be seen bellow:
| BH3 | NH3 | NH3BH3 |
| (-26.606) a.u. | (-56.558) a.u. | (-83.225) a.u. |
Correct structures calculated and corresponding energies, but note that the summary tables asked for were for the frequency calculations, not optimisations. At the start, your BH3 molecule is also of the wrong symmetry. Smf115 (talk) 21:24, 17 May 2019 (BST)
Energy Association Calculation
ΔE=E(NH3BH3)-[E(NH3)+E(BH3)]
ΔE=(-83.225)-[(-56.558)+(-26.606)]
ΔE= -0.061 a.u. = -160.156 kJ mol-1
The bond strength of the dative BH3 bond in the NH3BH3 molecule is weak because when you compare it to a C-C bond the associative energy is 347 kJ mol-1.
You've done the correct calculation for the association energy, however, the energy values of the molecules were rounded too early resulting in an incorrect answer. Your comparison to the C-C bond is a decent comparison but you should always give a reference for any literature value, and to improve you could have considered some other comparison bond strengths. Smf115 (talk) 21:24, 17 May 2019 (BST)
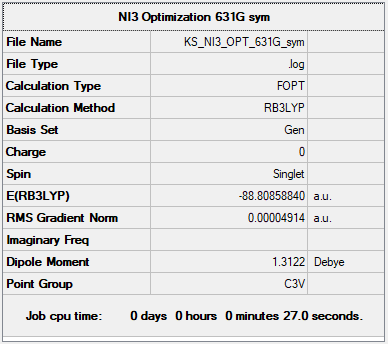
NI3
General Info
B3LYP/GEN
         Item               Value     Threshold  Converged?
 Maximum Force            0.000139     0.000450     YES
 RMS     Force            0.000090     0.000300     YES
 Maximum Displacement     0.001129     0.001800     YES
 RMS     Displacement     0.000796     0.001200     YES
Low frequencies ---  -12.6128  -12.6065   -5.8336   -0.0040    0.0189    0.0683
Low frequencies ---  100.9317  100.9325  147.2778
NI3 |
Optimised Bond Distance: 2.184 Å
Correct implementation of the pseudopotential, overall your structure information is good, the only improvement would be that we wanted the summary frequency tables (confirms that you're at the minimum structure) and not the optimisation ones (same for section 2). Smf115 (talk) 09:10, 22 May 2019 (BST)
Metal Carbonyls
Predictions
The Transition Metal complexes chosen to analyse are: [Ti(CO)6]-2, [V(CO)6]-1 and [Cr(CO)6]. They have a number of things in common:
- They are all octahedral
- They all are d6
- They are all in the low spin singlet state
- The metals are all from the 3rd period of the periodic table
- They all have the same high field ligand CO
- They all belong to the Oh point group
However there are a number of things that may differ by changing the metal centre.
Energies
The TM complexes as you go along the period should decrease in energy. They have the same number of electrons however the oxidation state of the central metal atom increases - this makes the central metal atom more electro-positive and spatially should have a better orbital overlap which would lower energies.
Bond Lengths
The bond length should also decrease as we go across the period due to a higher oxidation number on the central metal atom and there being no increase in electron shielding because the molecules have the same number of electrons. This increased attraction with the electron density would make the bond length shorter.
Good introduction but your property selection here could be improved. Energies are not comparable between the complexes, because they might have the same number of electrons but they are different TMs. Energy differences are comparable so you could have looked at the ligand-TM bond strength for example. The bond distance is a better choice of property but which bond distance are you looking at, TM-C or C-O? Smf115 (talk) 09:37, 22 May 2019 (BST)
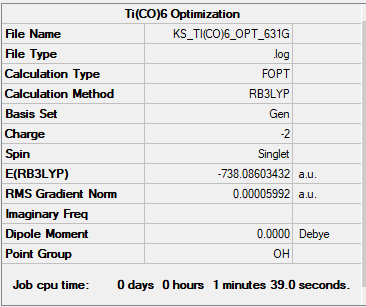
[Ti(CO)6]-2
B3LYP/GEN
Item               Value     Threshold  Converged?
 Maximum Force            0.000118     0.000450     YES
 RMS     Force            0.000042     0.000300     YES
 Maximum Displacement     0.000263     0.001800     YES
 RMS     Displacement     0.000101     0.001200     YES
Low frequencies ---   -0.0015   -0.0014   -0.0010   14.2276   14.2276   14.2276
Low frequencies ---   30.7523   30.7523   30.7523
[Ti(CO)6]-2 |
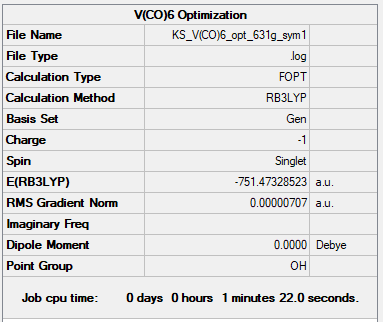
[V(CO)6]-1
B3LYP/GEN
Item               Value     Threshold  Converged?
 Maximum Force            0.000014     0.000450     YES
 RMS     Force            0.000005     0.000300     YES
 Maximum Displacement     0.000032     0.001800     YES
 RMS     Displacement     0.000013     0.001200     YES
Low frequencies ---    0.0008    0.0010    0.0011   12.9805   12.9805   12.9805
Low frequencies ---   52.6449   52.6449   52.6449
[V(CO)6]-1 |
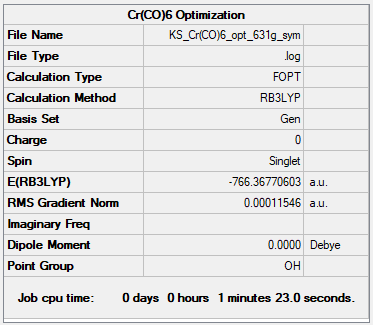
[Cr(CO)6]
B3LYP/GEN
Item               Value     Threshold  Converged?
 Maximum Force            0.000263     0.000450     YES
 RMS     Force            0.000102     0.000300     YES
 Maximum Displacement     0.001211     0.001800     YES
 RMS     Displacement     0.000544     0.001200     YES
Low frequencies ---   -0.0010   -0.0004    0.0008    9.3115    9.3115    9.3115
Low frequencies ---   66.1930   66.1930   66.1930
[Cr(CO)6] |
Great calculations, including the correct charges and pseudopotential and clearly presented section! An improvement would be to actually include the details of the pseudopotential: B3LYP/Lan2DLZ and not 'GEN' which is just the Gaussian keyword. Smf115 (talk) 09:07, 22 May 2019 (BST)
Analysing calculated properties
Energies
| [Ti(CO)6]-2 | [V(CO)6]-1 | [Cr(CO)6] |
| (-738.086) a.u. | (-751.473) a.u. | (-766.368) a.u. |
The prediction was correct and the energies are decreasing as the oxidation state increases along the group.
Bond Lengths
| [Ti(CO)6]-2 | [V(CO)6]-1 | [Cr(CO)6] |
| 2.047 Å | 1.954 Å | 1.915 Å |
The prediction was correct - as we can see in the table the bond lengths decrease as you increase the metal oxidation in the TM complex.
Correct bond distances for the M-C bond. However, your explanation/analysis (including the prediction section above) isn't correct and you want may want to consider the effect of the metal charge on back bonding and maybe changes to other properties, such as Δoct. A plot of the data would have also been nice. Smf115 (talk) 09:57, 22 May 2019 (BST)
Totally Symmetric CO stretches
All the molecules contain 13 atoms, therefore there should be (and are) 33 vibration frequencies according to the rule for degrees of freedom for a non linear molecule: 3N-6. However due to the fact that octahedral complexes are highly symmetrical many of these vibrations will create no net dipole and therefore they would not be seen on the IR. Totally symmetric CO stretches are stretches where only the bond between the CO atoms vibrates and not the ligands themselves and all the COs stretch outwards at the same time (and vice versa). They are expected to have the highest frequency as the triple bond in CO bond strength is the highest compared to the ligands. Nevertheless, they would not normally show a frequency band on the IR taken of this molecule because there is no net dipole when the stretches are symmetric. However, this software does predict values of vibration frequencies for totally symmetric stretches which shows the power of computational chemistry as a method of analysis. In the table bellow the highest vibration frequency for each TM complex is seen:
| [Ti(CO)6]-2 | [V(CO)6]-1 | [Cr(CO)6] |
| 1990 cm-1 | 2096 cm-1 | 2190 cm-1 |
The frequencies increase as the oxidation increases implying the metal atom affects these vibrations, the increase in oxidation level could mean that the vibration of the electron density is more difficult hence the higher frequency required to create a stretch.
MOs of [Cr(CO)6]
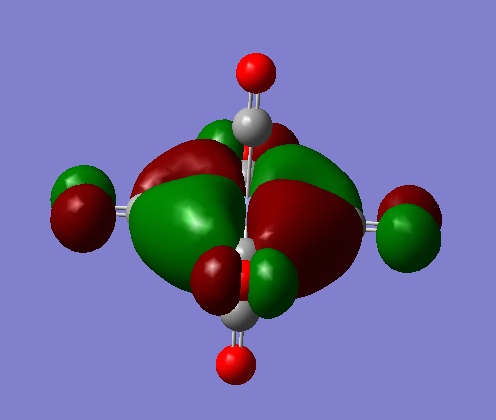
There are 3 occupied valence MOs in the Cr complex these correspond to the t2g symmetry, these are all degenerate. Then from the 5 lowest non occupied orbitals there are 3 degenerate levels which have t1u symmetry and two degenerate levels which have t2u symmmetry. The order in increasing energy (more positive) of these orbitals is:
t2g (occupied valence) < t1u < t2u
t2g
The visualised pictures are shown bellow (they only differ in orientation in space as they are degenerate):
These occur due to the dxy (or dyz or dxz) orbitals on the metal combining with the π* antibonding orbitals of the CO bond of the ligands that lie in plane to the d orbitals. The overall MO is bonding.
The LCAO MO diagram can be seen bellow:
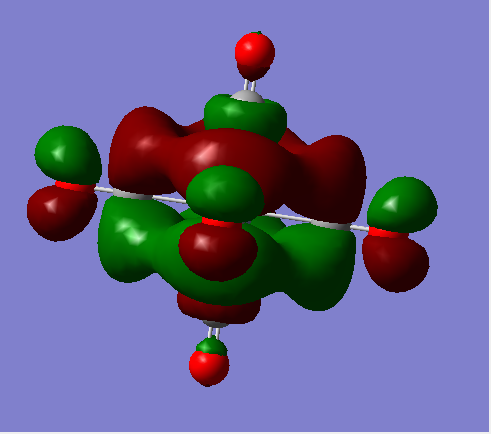
t1u
The visualised orbitals are shown bellow (they only differ in orientation in space as they are degenerate):
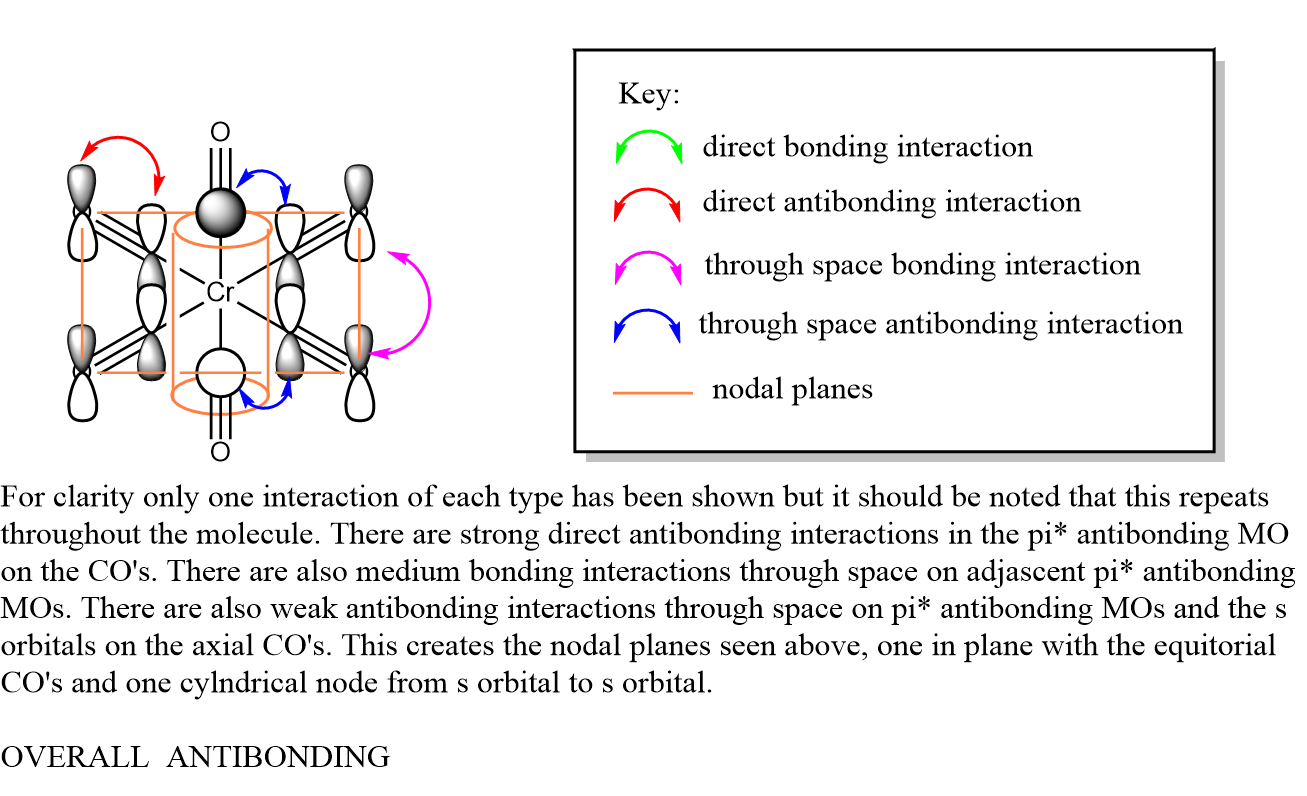
These occur due to the s orbitals of the C in the axial CO ligands combining with the π* antibonding orbitals in the CO bonds of the equitorial CO ligands. It is interesting to consider that the metal orbitals play no part in creating this MO. The overall MO is antibonding.
The LCAO MO diagram can be seen bellow:
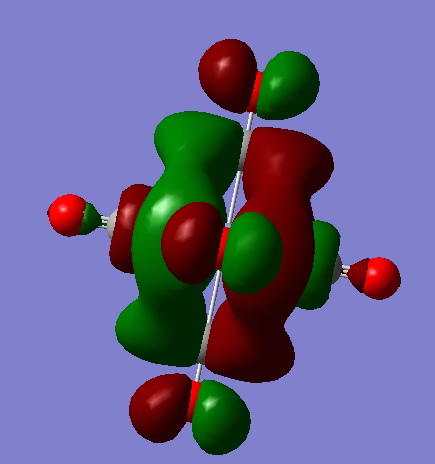
t2u
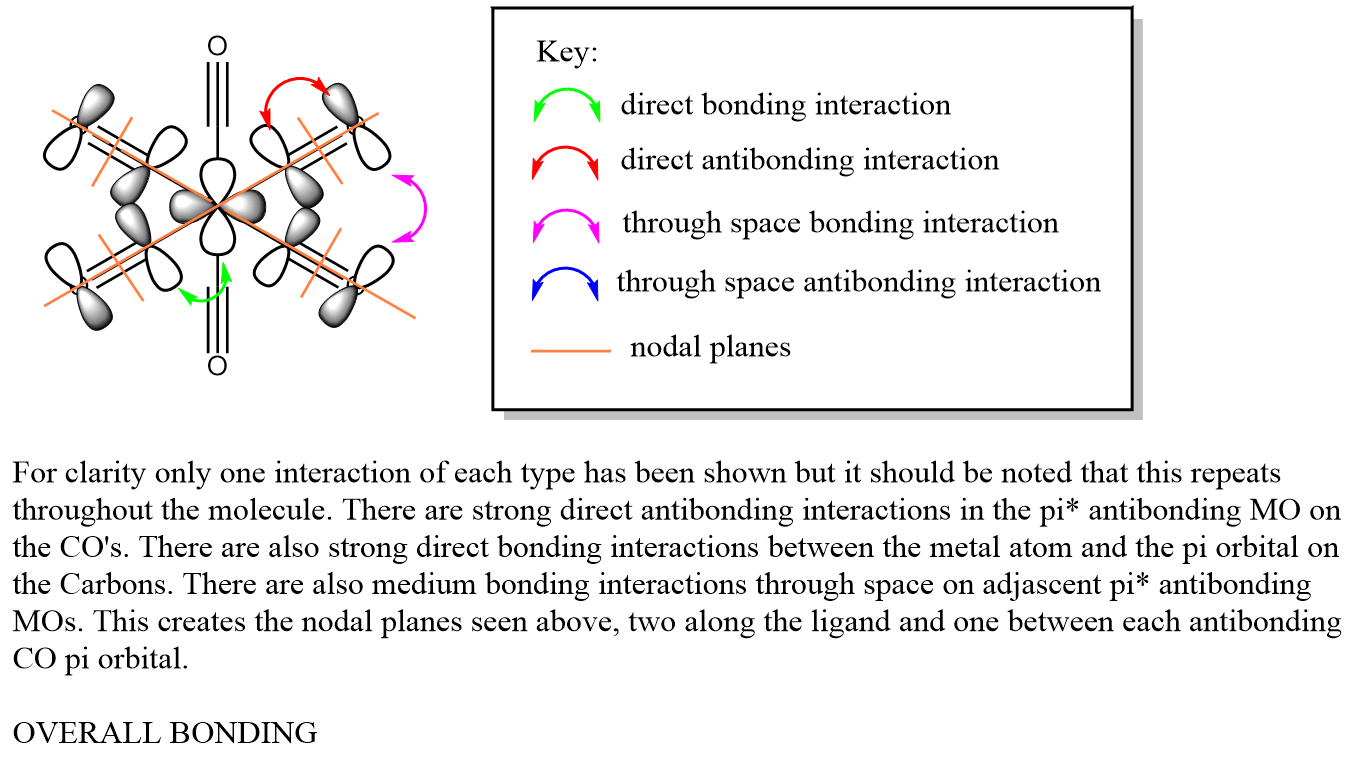
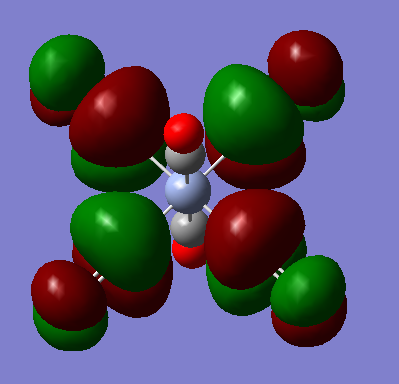
The visualised orbitals are shown bellow (they only differ in orientation in space as they are degenerate):
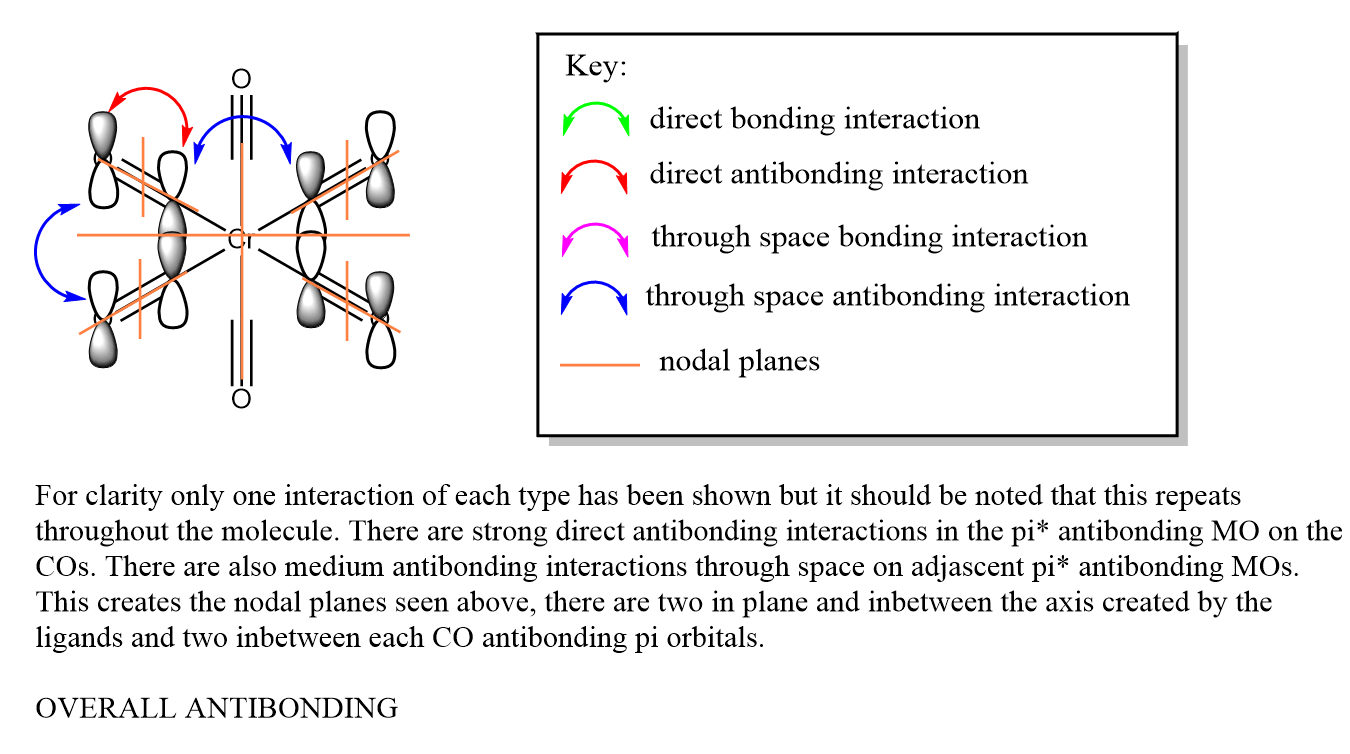
These occur just due to the combination of π* antibonding orbitals in the CO bond of four of the ligands. It is interesting to consider that not all of the ligands need to be involved to create an MO as well. The MO is overall antibonding.
The LCAO Mo diagram can be seen bellow:
Good selection of MOs and clearly identifying the degeneracy and symmetries which is great! You've had a good attempt at constructing the LCAOs but your discussion of the interactions isn't always correct. Considering the middle t1u MOs for example, you don't label the main bonding interaction of the 4 COs which dominates the MO character and the antibonding interaction with the other two CO ligands aren't particularly clear. In general, the end O's are too distant for there to be any interaction between them. Smf115 (talk) 10:14, 22 May 2019 (BST)
Overall a good report and an ok effort at the project section. Smf115 (talk) 10:14, 22 May 2019 (BST)

