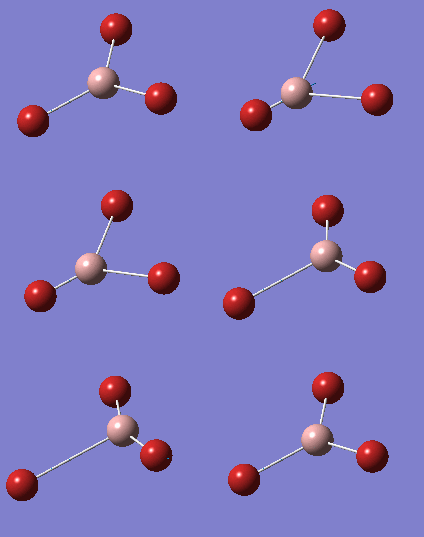
Rep:Mod:knt11
Third year Inorganic Computational Laboratory
Name: Kai Ni Teh
CID: 00697229
Optimisation Analysis
Data
Optimisation jobs were carried out for BH3, BH3, GaBr3 and BBr3 using the method RB3LYP and different basis sets. The data are shown in Table 1. The 6-31G(d,p) basis set is a better and more accurate one compared to 3-21G. LanL2DZ is a medium level basis set and it includes the use of pseudo potentials on heavier elements, such as gallium and bromine. For BBr3, the Gen basis set is used and that includes a 6-31G(d,p) basis set for boron and the LanL2DZ basis set for the heavier bromine atom.
| BH3 (3-21G) | BH3 (6-31G;d,p) | GaBr3 (LanL2DZ) | BBr3 (Gen) | |
| File | KNT BH3 optimisation (3-21G) | KNT BH3 optimisation (6-31G;d,p) | KNT GaBr3 optimisation (LanL2DZ) | KNT BBr3 optimisation (Gen) |
| File type | .log | .log | .log | .log |
| Calculation type | FOPT | FOPT | FOPT | FOPT |
| Calculation method | RB3LYP | RB3LYP | RB3LYP | RB3LYP |
| Basis set | 3-21G | 6-31G(d,p) | LanL2DZ | Gen |
| Charge | 0 | 0 | 0 | 0 |
| Spin | Singlet | Singlet | Singlet | Singlet |
| Final energy /au | -26.4622634 | -26.6153236 | -41.7008278 | -64.4364530 |
| RMS Gradient /au | 0.00020672 | 0.00000235 | 0.00000016 | 0.00000382 |
| Dipole moment /D | 0.00 | 0.00 | 0.00 | 0.00 |
| Point group | D3h | D3h | D3h | D3h |
| Calculation time | 1 minute 0.0 seconds | 44.0 seconds | 27.7 seconds | 36.9 seconds |
| Bond distance /Å | 1.19 | 1.19 | 2.35 | 1.93 |
| Bond angle /° | 120.0 | 120.0 | 120.0 | 120.0 |
Table 1. Optimisation data for various compounds.
The optimisation jobs are complete as the RMS gradient obtained in each case is less than 0.001 and close to 0. The final energies obtained are also listed.
The B-H bond distance of 1.19 Å is very close to literature value of 1.206[1], indicating the accuracy of the computation.
BH3 optimisation (3-21G)
 Item                     Value        Threshold    Converged?
 Maximum Force            0.000413     0.000450     YES
 RMS     Force            0.000271     0.000300     YES
 Maximum Displacement     0.001610     0.001800     YES
 RMS     Displacement     0.001054     0.001200     YES
 Predicted change in Energy=-1.071764D-06
 Optimization completed.
    -- Stationary point found.
BH3 optimisation (6-31G;d,p)
 Item                     Value        Threshold    Converged?
 Maximum Force            0.000005     0.000450     YES
 RMS     Force            0.000003     0.000300     YES
 Maximum Displacement     0.000019     0.001800     YES
 RMS     Displacement     0.000012     0.001200     YES
 Predicted change in Energy=-1.305135D-10
 Optimization completed.
    -- Stationary point found.
GaBr3 optimisation (LanL2DZ)
 Item                     Value        Threshold    Converged?
 Maximum Force            0.000000     0.000450     YES
 RMS     Force            0.000000     0.000300     YES
 Maximum Displacement     0.000003     0.001800     YES
 RMS     Displacement     0.000002     0.001200     YES
 Predicted change in Energy=-1.282681D-12
 Optimization completed.
    -- Stationary point found.
BBr3 optimisation (Gen)
 Item                     Value        Threshold    Converged?
 Maximum Force            0.000008     0.000450     YES
 RMS     Force            0.000005     0.000300     YES
 Maximum Displacement     0.000036     0.001800     YES
 RMS     Displacement     0.000023     0.001200     YES
 Predicted change in Energy=-4.026916D-10
 Optimization completed.
    -- Stationary point found.
For each compound, the optimisation is shown to converge. The force and displacement values are within the threshold.
Analysis: Comparison of bond distances
| Compounds | Computed bond distances /Å | Literature values for bond distances /Å | |
| DFT/6-31G(d;p) | Various methods and basis sets | ||
| BH3 | 1.19 | 1.190 01 (1)[2] "from the ground state rotational constant B0" | |
| BBr3 | 1.93 | 1.916[3] (BP86/def-TZVPP) | |
| GaBr3 | 2.35 | 2.277[4] using the CAS-MCSCF technique | |
Table 2. Bond distances for various compounds.
Bond distance is dependent on bond strength which is in turn dependent on size of atoms, extent of orbital overlap between atoms, electronegativity and polarity difference between atoms.
From Table 2, as the size of the ligand increased, the bond distance increased. This is due to a large extent of increase in electron-electron repulsion when hydrogen was replaced by bromine as bromine has a much larger number of electrons as compared to hydrogen, which only has one. Also, boron is electropositive whereas hydrogen is electronegative; this leads to a strong attraction between the two atoms, resulting in a stronger and shorter bond. Hydrogen and bromine atoms are similar in that they are both atoms which contribute electrons based on their valence shell electron count; however, the large increase in number of electrons produced a large effect, hence leading to the large increase in B-Br bond distance.
Upon changing the atom from hydrogen to bromine, the nature of the bond also changes. Theory suggests that there are different types of bonding, such as ionic and covalent bonding, as mentioned above. However, in real life, the nature of bonding for many molecules is not so straightforward. For instance, the interaction between B and H or Ga and Br is not a pure covalent bond. Due to higher polarising power of boron and high polarisability of electron cloud of bromine, there are different extents of ionic character in the covalent bonds. As bromine is much larger in size than hydrogen, in comparison, the effect of the larger polarisability of electron cloud of bromine is larger than that of the polarising power of boron in comparing the B-H and B-Br bond lengths. Thus, there should be a larger degree of ionic character in the Ga-Br bond than in the B-H bond.
As the central element was changed from boron to gallium, an expected increase in bond distance was observed. This is due to the above mentioned reason where a larger atom has a larger number of electrons, and hence a larger electronic repulsion and bond distance. Gallium is the element below boron in the periodic table of elements and hence is less electropositive than boron due to its larger size and more diffuse nuclear charge. This means a smaller force of attraction between gallium and bromine, and hence a longer bond. Also, gallium and bromine atoms are larger than boron and hydrogen respectively; this means that their orbitals are more diffuse and the Ga-Br orbital overlap will be poorer. This leads to a weaker bond strength and longer bond. Even though boron and gallium are in the same group in the periodic table of elements and they both have 3 valence electrons each to bond with 3 one-electron donor ligands, it was the increase in number of electrons and poorer orbital overlap of the atoms that led to the increase in bond distance.
A comparison of the computed and literature values for the various bond distances revealed an agreement between the values and the accuracy of the computation. However, as the method and basis set used were different for this and others' computations, no more attempt at comparison could and should be made, apart from noting that they are sufficiently similar.
What is a bond?
A bond is an interaction formed between two atoms which hold them together in place. Depending on the nature of the atoms, there can be various types of bond, for instance, ionic bond, covalent bond, metallic bond and agostic bonding. The strength of a bond is usually dependent on the extent or strength of electrostatic force of attraction between the two atoms. For example, a pure ionic bond is strong as the ions are oppositely charged, leading to a large electrostatic force of attraction. As a result of bonding, there is a net lowering of potential energy of molecules compared to individual atoms; this is the driving force of bond formation.
In the computational software used, Gaussview, some bonds are not drawn where we expect. However, this does not mean that there is no bond. Instead, the bond distance exceeds a pre-defined value and therefore, it cannot be shown or drawn in Gaussview. In Gaussview, textbooks and journals, chemical bonds are usually depicted with a line draw between atoms. However, in real life, there is no line or actual bond that connects atoms. Instead, the atoms are attracted to each other via interactions between electrons and electron cloud.
Frequency Data and Analysis
Frequency computations were carried out for BH3 and GaBr3. The data and analysis are presented in the following sections.
BH3 frequency (6-31G;d,p)
Data
| BH3 (6-31G;d,p) | |
| File | KNT BH3 frequency (6-31G;d,p) |
| File type | .log |
| Calculation type | FREQ |
| Calculation method | RB3LYP |
| Basis set | 6-31G(d,p) |
| Charge | 0 |
| Spin | Singlet |
| Final energy /au | -26.6153236 |
| RMS Gradient /au | 0.00000237 |
| Dipole moment /D | 0.00 |
| Point group | D3h |
| Calculation time | 13.0 seconds |
| Bond distance /Å | 1.19 |
| Bond angle /° | 120.0 |
Table 3. Optimisation (6-31G;d,p) data for BH3
The frequency job is complete as the RMS gradient obtained is 0.00000237, which is less than 0.001 and close to 0; it is also very close to that obtained from the optimisation job. The final energy obtained is -26.6153236 au, which is identical to the value obtained from the optimisation job. The dipole moment of 0.00 D is also identical to that obtained from the optimisation job.
 Item                     Value        Threshold    Converged?
 Maximum Force            0.000005     0.000450     YES
 RMS     Force            0.000002     0.000300     YES
 Maximum Displacement     0.000019     0.001800     YES
 RMS     Displacement     0.000009     0.001200     YES
 Predicted change in Energy=-1.323376D-10
 Optimization completed.
    -- Stationary point found.
The computation is shown to converge with force and displacement values within the threshold.
3N-6 vibrational frequencies
Low frequencies ---   -0.9033   -0.7343   -0.0055    6.7375   12.2491   12.2824
Low frequencies --- 1163.0003 1213.1853 1213.1880
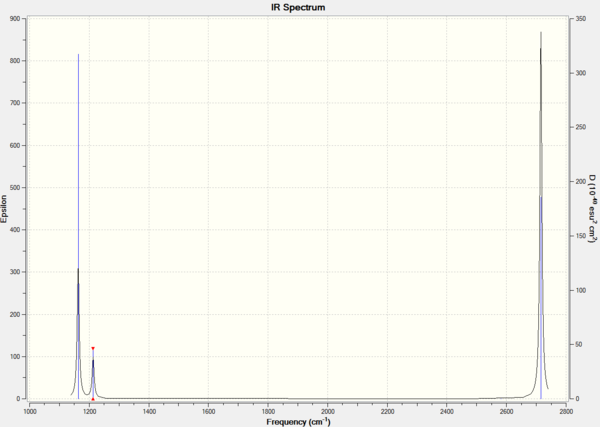
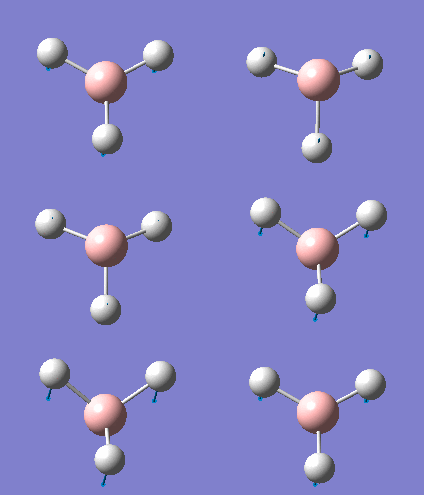
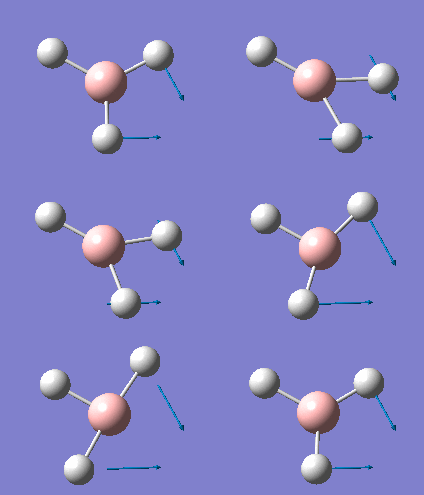
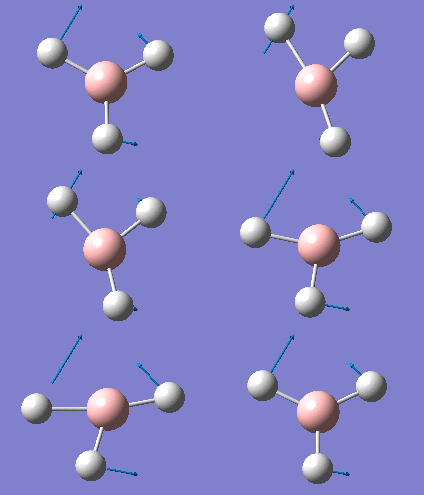
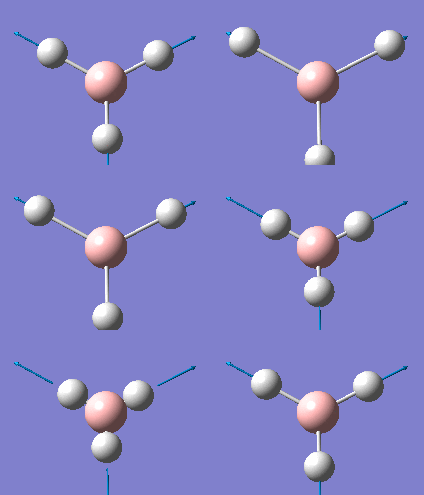
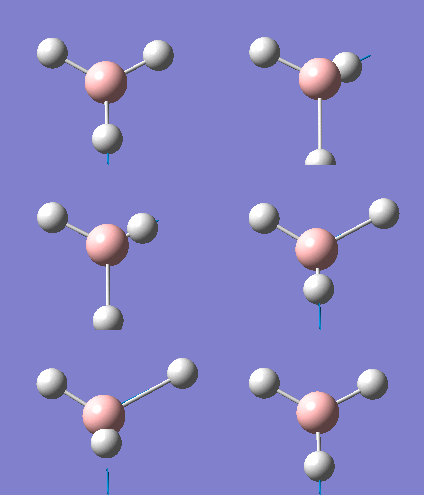
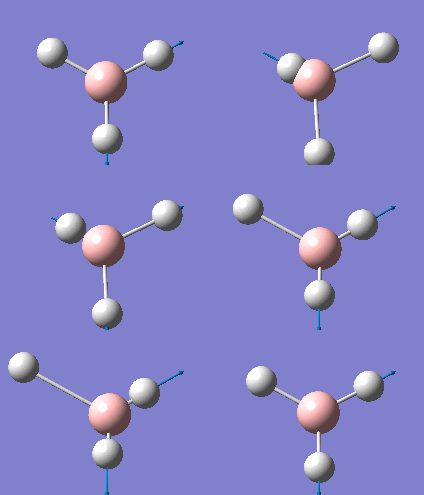
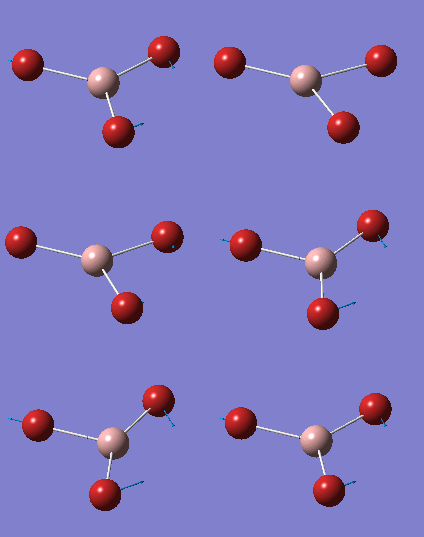
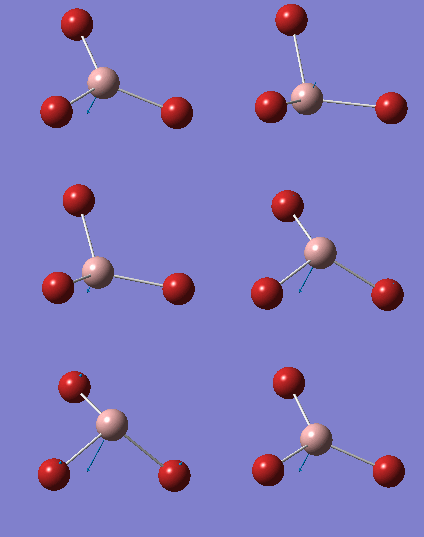
Every molecule has 3N-6 modes of vibration where N is the number of atoms in the molecule. For BH3, there are 6 modes of vibration as N is 4. The first line of "low frequencies" shows the 6 frequencies that are removed from the 3N-6 operation. They correspond to the motion of the center of the mass of the molecule and the values should be much smaller than the second line of "low frequencies". The second line shows only three of the six remaining vibrational frequencies. Out of the 6 vibrational modes, only 5 produce a change in dipole moment upon vibration and this is reflected in the IR spectrum, which will be explained later.
The first line of "low frequencies" are low and close to zero and the second line of "low frequencies" are positive. There are also no negative frequencies. It is usually acceptable for the first line of "low frequencies" to have a range within 15 cm-1 and the second line of "low frequencies" to differ from the first by about an order of magnitude. The frequency data fits the requirement and is hence a good computation.
In this case, the lowest normal mode of vibration is at 1163 cm-1.
IR vibrational frequencies
Table 4. IR data for BH3.
Six vibrational frequencies are computed, meaning that six peaks should be observed in the IR spectrum. However, only 3 peaks are observed in Figure 1. This is because the symmetric stretch at 2582 cm-1 leads to no change in dipole moment upon vibration; hence, this peak is not IR active and has an intensity of 0. Furthermore, vibrational modes 2 and 3 at 1213 cm-1 and 5 and 6 at 2715 cm-1 are degenerate and produce peaks at the same frequency; therefore, for each of 2 and 3, and 5 and 6 degenerate vibrational modes, only one peak is observed. Vibrational frequencies having a higher intensity have a larger change in dipole moment upon vibrations compared to those with lower intensity.
GaBr3 frequency (LanL2DZ)
Data
| GaBr3 (LanL2DZ) | |
| File | KNT GaBr3 frequency (LanL2DZ) |
| File type | .log |
| Calculation type | FREQ |
| Calculation method | RB3LYP |
| Basis set | LanL2DZ |
| Charge | 0 |
| Spin | Singlet |
| Final energy /au | -41.7008278 |
| RMS Gradient /au | 0.00000011 |
| Dipole moment /D | 0.00 |
| Point group | D3h |
| Calculation time | 16.4 seconds |
| Bond distance /Å | 2.35 |
| Bond angle /° | 120.0 |
Table 5. Frequency (LanL2DZ) data for GaBr3.
The frequency job is complete as the RMS gradient obtained is 0.00000011, which is less than 0.001 and close to 0; it is also very close to that obtained from the optimisation job. The final energy obtained is -41.7008278 au, which is identical to the value obtained from the optimisation job. The dipole moment of 0.00 D is also identical to that obtained from the optimisation job.
 Item               Value     Threshold  Converged?
 Maximum Force            0.000000     0.000450     YES
 RMS     Force            0.000000     0.000300     YES
 Maximum Displacement     0.000002     0.001800     YES
 RMS     Displacement     0.000001     0.001200     YES
 Predicted change in Energy=-6.142862D-13
 Optimization completed.
    -- Stationary point found.
The computation is shown to converge with force and displacement values within the threshold.
3N-6 vibrational frequencies
Low frequencies ---   -0.5252   -0.5247   -0.0024   -0.0010    0.0235    1.2010
Low frequencies ---   76.3744   76.3753   99.6982
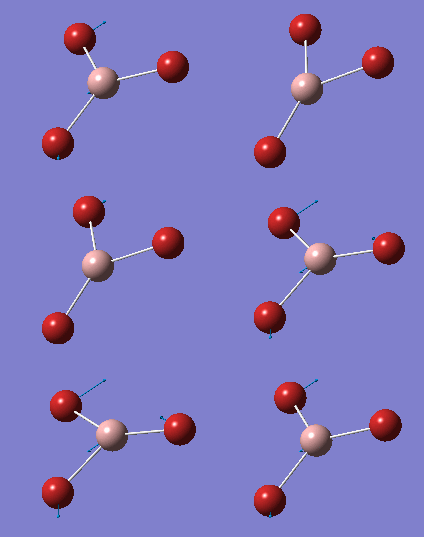
The GaBr3 frequency data prove that this computation is good as the "low frequencies" data are acceptable. This means that the frequencies are low, close to zero and within the range of ± 15 cm-1, the second line of frequencies has positive values, and there are no negative frequencies.
In this case, the lowest normal mode of vibration is at 76 cm-1.
IR vibrational frequencies
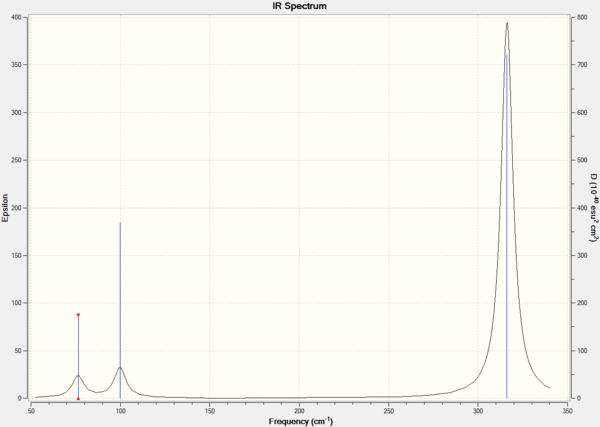
Figure 2. IR spectrum of GaBr3.
Table 6. IR data for GaBr3.
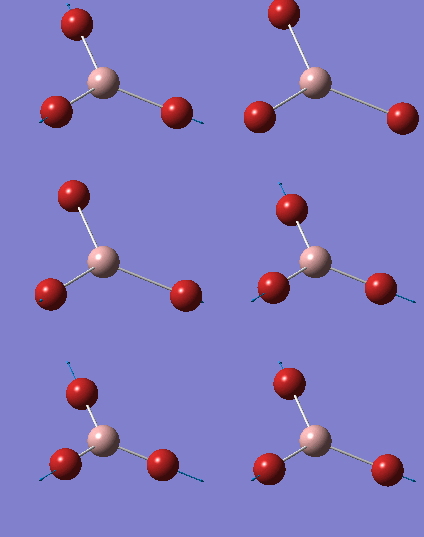
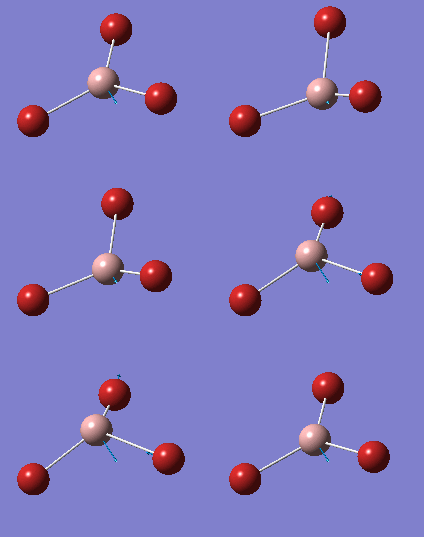
Only 3 peaks are observed as vibrational mode 4 is a symmetric stretch, which is IR-inactive. Vibrational modes 1 and 2, and 5 and 6 produce peaks are degenerate and hence, produce one peak for each group. Vibrational frequencies having a higher intensity have a larger change in dipole moment upon vibrations compared to those with lower intensity.
Analysis of Vibrational Frequencies
The vibrational frequencies of BH3 and GaBr3 are analysed and compared in the following section.
| Compounds | Vibrational frequencies /cm-1 (Symmetry label) | |||||
| BH3 | 1163 (A2") | 1213 (E') | 2582 (A1') | 2715 (E') | ||
| GaBr3 | 76 (E') | 100 (A2") | 197 (A1') | 316 (E') | ||
Table 7. Comparison of vibrational frequencies.
A frequency analysis is the second derivative of the potential energy surface and the sign of frequencies obtained shows the nature of the optimised structure, whether it is at ground state, a transition state or it shows the fact that the optimisation is unsuccessful. If the frequencies obtained are positive, the structure is at ground state. If one negative frequency is obtained, the structure is a transition state. If there is more than one negative frequency, the optimisation has failed. In all cases in this experiment, the frequencies obtained are all positive, indicating that the optimisations were successful as all optimised structures were at ground state, and hence most stable.
The same method and basis set for both optimisation and frequency analysis calculations have to be used as each method and basis set will lead to a different result. For instance, when a more complicated basis set for optimisation is used, the final energy of the molecule is obtained and more accurate; however, if the basis set is then changed to a simpler one for frequency analysis calculation, the energy obtained will be different from that of the optimisation as the basis set determines the accuracy of the computation.
Vibrational frequencies are proportional to force constant and inversely proportional to the reduced mass of the molecule. The Ga-Br bond is weaker than the B-H bond as the former consists of larger atoms with more diffuse orbitals, leading to poorer overlap and weaker bond. Furthermore, Ga and Br atoms are certainly heavier than B and H atoms, leading to a larger reduced mass. As a result, BH3 will produce vibrations at larger frequencies compared to GaBr3. This is also shown in the computation summarised in Table 7.
The BH3 and GaBr3 IR spectra both produce 3 peaks. They are similar in that the mode of vibration labelled with a1' symmetry is due to symmetric stretch and hence does not result in a net change in dipole moment and does not show a peak in the IR spectrum. In each set of data, there are two groups of degenerate peaks and an additional non-degenerate peak. However, the peak intensities of BH3 are in general much higher than those of GaBr3. This is due to a larger change in dipole moment upon vibrations about the B-H bonds.
There has been a reordering of modes as the order of A2" and E' vibrational modes are different in BH3 and GaBr3. This is possibly due to a larger energy required to move atoms up and down for GaBr3 due to the proximity of the bond and electron pairs due to much larger gallium and bromine atoms.
The A2" and E' modes lie closely together, whereas the A1' and E' modes also lie closely together but higher in energy. This is because the latter involves stretching modes of vibration that require more energy than simply moving up and down or in a scissoring fashion. Compared to an equilibrium bond distance, when the bond is stretched inwards, the electrons of different atoms approach each other, resulting in an increase in repulsion energy. In contrast, when the bond is stretched outwards, there is a decrease in repulsion energy, which is favourable. However, at the same time, the attraction between atoms are also reduced. This means that a larger amount of energy needs to be supplied in order for stretching vibrations to take place.
Molecular Orbitals (MOs) of BH3
A population analysis was carried out for BH3 and the data shown below.
| File | KNT BH3 MOs |
| File type | .log |
| Calculation type | SP |
| Calculation method | RB3LYP |
| Basis set | 6-31G(d,p) |
| Charge | 0 |
| Spin | Singlet |
| Final energy /au | -26.6153236 |
| RMS Gradient /au | - |
| Dipole moment /D | 0.00 |
| Point group | D3h |
| Calculation time | 3.0 seconds |
Table 8. Population analysis data for BH3.
MO diagram
The MO diagram of BH3 is shown below.
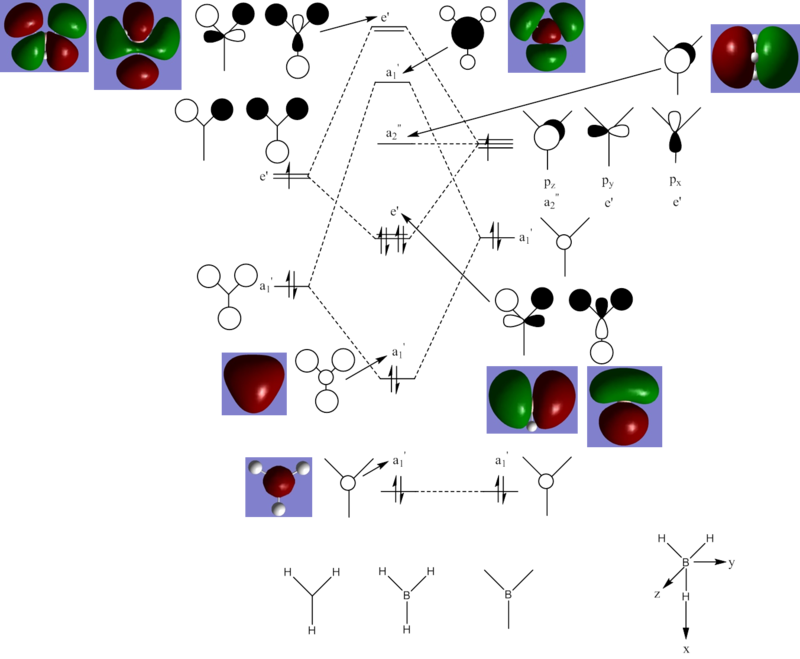
Figure 3. MO diagram of BH3. (The lowest a1' energy level is much deeper down in energy compared to the other energy levels.)
There are no significant differences between the real and LCAO MOs as they look highly similar in terms of shape, size and polarity. While this is especially true for the first 6 real MOs, the 7th and 8th real MOs look a little different and more diffuse from the predicted ones. This might be due to the limitation of LCAO in predicting the exact shape and size of real MOs or the lower precision of the Gaussian software in predicting the nature of bonding and structure of unoccupied MOs.
Overall, this means that the qualitative MO theory is sufficiently useful and accurate in this instance. It is a very useful tool to easily describe and explain MOs qualitatively. However, it is only useful for prediction of interaction between atoms, and subsequently MOs, of simpler molecules. As the molecule gets more complicated, coupled with various effects such as mixing, computational methods will be required to predict the form of interaction between atoms and the real MOs.
Analysis of NH3
Optimisation, frequency, population and NBO analysis were carried out for NH3 and the data shown and explained in the following sections.
NH3 optimisation (6-31G;d,p)
Data
| File | KNT NH3 optimisation (6-31G;d,p) |
| File type | .log |
| Calculation type | FOPT |
| Calculation method | RB3LYP |
| Basis set | 6-31G(d,p) |
| Charge | 0 |
| Spin | Singlet |
| Final energy /au | -56.5577686 |
| RMS Gradient /au | 0.00000289 |
| Dipole moment /D | 1.85 |
| Point group | C3v |
| Calculation time | 9.0 seconds |
| Bond distance /Å | 1.02 |
| Bond angle /° | 105.7 |
Table 9. Optimisation data of NH3.
The optimisation job is complete as the RMS gradient obtained is 0.00000289, which is less than 0.001 and close to 0. The final energy obtained is -56.5577686 au.
The N-H bond distance of 1.02 Å is very close to literature value of 1.024[1], indicating the accuracy of the computation.
 Item               Value     Threshold  Converged?
 Maximum Force            0.000005     0.000450     YES
 RMS     Force            0.000003     0.000300     YES
 Maximum Displacement     0.000010     0.001800     YES
 RMS     Displacement     0.000007     0.001200     YES
 Predicted change in Energy=-7.830081D-11
 Optimization completed.
    -- Stationary point found.
For NH3, the optimisation is shown to converge. The force and displacement values are within the threshold.
NH3 frequency
Data
| File | KNT NH3 frequency (6-31G;d,p) |
| File type | .log |
| Calculation type | FREQ |
| Calculation method | RB3LYP |
| Basis set | 6-31G(d,p) |
| Charge | 0 |
| Spin | Singlet |
| Final energy /au | -56.5577686 |
| RMS Gradient /au | 0.00000281 |
| Dipole moment /D | 1.85 |
| Point group | C3v |
| Calculation time | 4.0 seconds |
| Bond distance /Å | 1.02 |
| Bond angle /° | 105.7 |
Table 10. Frequency data of NH3.
The frequency job is complete as the RMS gradient obtained is 0.00000281, which is less than 0.001 and close to 0; it is also very close to that obtained from the optimisation job. The final energy obtained is -56.5577686 au, which is identical to the value obtained from the optimisation job. The dipole moment of 1.85 D is also identical to that obtained from the optimisation job.
 Item               Value     Threshold  Converged?
 Maximum Force            0.000005     0.000450     YES
 RMS     Force            0.000003     0.000300     YES
 Maximum Displacement     0.000011     0.001800     YES
 RMS     Displacement     0.000006     0.001200     YES
 Predicted change in Energy=-8.407566D-11
 Optimization completed.
    -- Stationary point found.
The computation is shown to converge with force and displacement values within the threshold.
3N-6 vibrational frequencies
Low frequencies ---  -11.6223  -11.5869   -0.0032    0.0244    0.1403   25.5604
Low frequencies --- 1089.6629 1694.1734 1694.1737
The first line of "low frequencies" shows that the vibrational frequencies differed with a range larger than ± 15 cm-1, and this means that the computational method and basis set used were insufficient. If an improved method was used, for example as suggested by the demonstrator to include "int=ultrafine scf=conver=9" as additional keywords and to tick the option "use tight convergence criteria", the first line of "low frequencies" should vary within the acceptable range of 15 cm-1. However, there was no need to re-perform the calculation as the demonstrator said so.
However, the second line of frequencies has positive values, and there are no negative frequencies.
Population analysis of NH3
Data
| File | KNT NH3 MOs |
| File type | .log |
| Calculation type | SP |
| Calculation method | RB3LYP |
| Basis set | 6-31G(d,p) |
| Charge | 0 |
| Spin | Singlet |
| Final energy /au | -56.5577686 |
| RMS Gradient /au | - |
| Dipole moment /D | 1.85 |
| Point group | C3v |
| Calculation time | 3.0 seconds |
Table 11. Population analysis data of NH3.
Charge Distribution
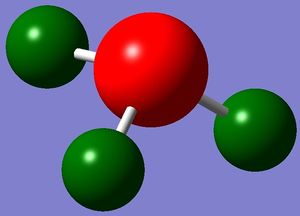
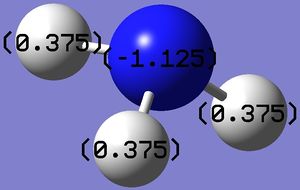
Figure 4: Charge range: -1.000 to 1.000; Figure 5: Charge on Nitrogen: -1.125, Charge on (each) Hydrogen: 0.375
Figure 4 shows the charge on each atom by showing either red or green colour for each atom. While red indicates a negative charge, green indicates a positive charge. Figure 5 shows the exact charge on each atom. The computation is good as it is commonly known that nitrogen, being an electronegative atom, possesses a negative charge. As the hydrogen atoms are directly attached to nitrogen, they are in turn electropositive and hence each possesses a positive charge. However, the exact charge on nitrogen exceeds the charge range, this could be due to the presence of lone pair that increases the negativity of the nitrogen atom. Additionally, it is known that the total charge of a neutral compound is zero. The computation shows this as a value of zero is obtained after adding up charges on each atom.
Analysis of NH3BH3
NH3BH3 was included in this exercise to determine the reaction energy for a reaction between NH3 and BH3. Optimisation, frequency, population and NBO analysis of NH3BH3 were carried out and the data shown and explained in the following sections.
NH3BH3 optimisation (6-31G;d,p)
Data
| File | KNT NH3BH3 optimisation (6-31G;d,p) |
| File type | .log |
| Calculation type | FOPT |
| Calculation method | RB3LYP |
| Basis set | 6-31G(d,p) |
| Charge | 0 |
| Spin | Singlet |
| Final energy /au | -83.2246901 |
| RMS Gradient /au | 0.00006839 |
| Dipole moment /D | 5.57 |
| Point group | C1 |
| Calculation time | 24.0 seconds |
Table 12. Optimisation data of NH3BH3.
The optimisation job is complete as the RMS gradient obtained is 0.00006839, which is less than 0.001 and close to 0. The final energy obtained is -83.2246901 au.
 Item                     Value        Threshold    Converged?
 Maximum Force            0.000139     0.000450     YES
 RMS     Force            0.000063     0.000300     YES
 Maximum Displacement     0.000771     0.001800     YES
 RMS     Displacement     0.000338     0.001200     YES
 Predicted change in Energy=-2.028054D-07
 Optimization completed.
    -- Stationary point found.
The optimisation is shown to converge with force and displacement values within the threshold.
A C1 point group is revealed through the computation.
Comparison of bond angles and bond distances
| Computed values | Literature values | ||
| DFT RB3LYP/6-31G(d;p) |
HF/6-31G[5] | DFT/NLSD[1] | |
| B-N bond distance /Å | 1.67 | 1.694 | 1.689 |
| N-H bond distance /Å | 1.02 | 1.028 | 1.004 |
| B-H bond distance /Å | 1.21 | 1.219 | 1.209 |
| H-N-B bond angle /° | 111.0 | 110.9 | 110.9 |
| H-B-N bond angle /° | 104.6 | 104.6 | 104.3 |
| H-N-H bond angle /° | 107.9 | - | - |
| H-B-H bond angle /° | 113.9 | - | - |
Table 13. Comparison of bond angles and bond distances with literature values.
From Table 13, it is clear that regardless of method and basis set used, the bond distances and bond angles are very similar to those from previous work done. This means that the computation was good and accurate.
NH3BH3 frequency
Data
| File | KNT NH3BH3 frequency (6-31G;d,p) |
| File type | .log |
| Calculation type | FREQ |
| Calculation method | RB3LYP |
| Basis set | 6-31G(d,p) |
| Charge | 0 |
| Spin | Singlet |
| Final energy /au | -83.2246900 |
| RMS Gradient /au | 0.00006831 |
| Dipole moment /D | 5.57 |
| Point group | C1 |
| Calculation time | 14.0 seconds |
Table 14. Frequency data of NH3BH3.
The frequency job is complete as the RMS gradient obtained is 0.00006831, which is less than 0.001 and close to 0; it is also very close to that obtained from the optimisation job. The final energy obtained is -83.2246900 au, which is very close to the value obtained from the optimisation job. The dipole moment of 5.57 D is also identical to that obtained from the optimisation job.
 Item                     Value        Threshold    Converged?
 Maximum Force            0.000127     0.000450     YES
 RMS     Force            0.000068     0.000300     YES
 Maximum Displacement     0.000828     0.001800     YES
 RMS     Displacement     0.000544     0.001200     YES
 Predicted change in Energy=-2.130705D-07
 Optimization completed.
    -- Stationary point found.
The computation is shown to converge with force and displacement values within the threshold.
3N-6 vibrational frequencies
Low frequencies ---   -0.0007   -0.0007   -0.0006   19.0166   23.6650   42.9730
Low frequencies ---  266.5856  632.3785  639.4477
The first line of "low frequencies" again varies with a larger than expected range. To improve the result, a better method and basis should be used as outlined above.
Association and dissociation energies of NH3BH3
The association energy is the energy released when a bond between NH3 and BH3 is formed to obtain NH3BH3. It is determined by manipulating the final energies of NH3BH3, NH3 and BH3 as shown below. The dissociation energy is the opposite of association energy when the B-N bond in NH3BH3 breaks to give NH3 and BH3.
Association energy
E(NH3) = -56.5577686 au
E(BH3) = -26.6153236 au
E(NH3BH3) = -83.2246901 au
ΔE = E(NH3BH3) - [E(NH3) + E(BH3)] = -83.2246901 + 56.5577686 + 26.6153236 = -0.0515979 au = -135.47 kJmol-1
Dissociation energy
ΔE = 135.47 kJmol-1
Comparison with literature values
The final and association energies are compared with literature values below.
| Compound | Computed final energies /au |
Literature values of final energies /au |
Calculated association energy /kJmol-1 |
Literature values of association energy /kJmol-1 | ||
| DFT RB3LYP/6-31G(d;p) | HF/6-31G[5] | DFT/NLSD[1] | DFT/6-31G(d;p) | HF/6-31G[5] | DFT/NLSD[1] | |
| NH3 | -56.5577686 | -56.18436 | -56.628757 | - | - | - |
| BH3 | -26.6153236 | -26.39001 | -26.643 585 | - | - | - |
| NH3BH3 | -83.2246901 | -82.61182 | -83.331114 | -135.47 | -98.32 | -154.39 |
Table 15. Comparison of energies of various compounds.
From Table 15, it is clear that the final energies of optimised structures of NH3, BH3 and NH3BH3 are highly similar in the au unit but not so in the kJmol-1 unit to literature values regardless of the method and basis set used. This is because different methods and basis sets will lead to results with different approximations used and different levels of accuracy. As a result, the calculated association energy is quite different from the literature values.
Conclusion
The computations were all successful with the data and analysis presented above. Values obtained from the computations agree well with literature values when a comparison was made. It is essential to use the same method and basis set for optimisation, frequency, population, NBO analysis and subsequent computations to ensure that the jobs were conducted on the same molecule with same structures, energies and dipole moments.
References
- ↑ 1.0 1.1 1.2 1.3 1.4 M. Leboeuf , N. Russo , D. R. Salahub , M. Toscano , "A density functional study of borane and alane monoammoniate (BH3NH3,AlH3NH3)", J. Chem. Phys., 1995, 103, 7408-7413. DOI:10.1063/1.470312
- ↑ K. Kawaguchi , "Fourier transform infrared spectroscopy of the BH3 ν3 band", J. Chem. Phys., 1992, 96, 3411.DOI:10.1063/1.461942
- ↑ G. Santiso-Quiñones , I. Krossing , "Reference Values for the B-X Bond Lengths of BI3 and BBr3", Z. Anorg. Allg. Chem., 2008, 634, 704-707.DOI:10.1002/zaac.200700510
- ↑ D. Dai , K. Balasubramanian , "Geometries and potential energies of electronic states of GaX2 and GaX3 (X=Cl, Br, and I)", J. Chem. Phys., 1993, 99, 293.DOI:10.1063/1.465807
- ↑ 5.0 5.1 5.2 J. S. Binkley , L. R. Thorne , "A theoretical study of the properties of BH3NH3@fa@f", J. Chem. Phys., 1983, 79, 2932-2940. DOI:10.1063/1.446117

