
Rep:Mod:kn812inorg
Inorganic Computational Lab
Outline
The study of chemistry involves a great deal of analysis into the parameters of different atoms and molecules. While traditional laboratory techniques and spectroscopic analysis has yielded a great deal of knowledge, computational programs can also be used to model different chemical systems and investigate systems that might be more complex to study in a lab. For instance, computational chemistry can be used to elucidate properties of theoretical or undiscovered compounds, and give chemists new information on how to synthesize such molecules.
There are two main components to the computational lab. The first comprises a brief introduction to the computational program utilised and is meant to gain some familiarity with using basis sets and pseudo potentials as well as performing frequency and population analysis. It also gives some understanding to the theoretical basis behind Gaussian and computational chemistry. For populational analysis, a comparison between the computed Molecular orbitals will be made to the traditional linear combination of atomic orbitals(LCAO) approach, to assess the accuracy behind this simple method. The final segment involves a mini-project to examine the structure and molecular orbitals of benzene, and give some insights into aromaticity. The effects of substituting one or more carbons in the cyclic backbone of benzene would also be examined through computational chemistry.
Introduction
Computational chemistry involves, in part, utilising quantum mechanical models and algorithms. For this project, the Gaussian program was utilised to optimise a range of structures, analyse frequencies and vibrational spectra, and compute molecular orbitals. Different basis sets and pseudo-potentials are utilised to attain the minimised energy of different conformers of a particular molecule of interest. After submitting a molecule of interest and specifying the computing method, Gaussian inteprets the atoms and coordinates given and solves the Schrödinger equation for the electron density at each configuration. The nuclei position is adjusted and the density re-computed, and the minimum energy found by studying the Potential Energy Surface (PES) to locate the energy minimum. Initially, the derivative of the energy function is solved and the stationary points located. This is where basis sets are important - higher basis sets would be more accurate, but takes longer due to greater number of calculations.
Performing a frequency analysis solves the second derivative with respect to nuclear position, and identifies points where the first derivative is zero and second derivative is positive. This ensures that the stationary points in the PES are indeed minimum points. This allows the most stable conformer to be determined. Finding the second derivative also solves for the force constants of the bonds, which allows for the vibrational energy and infra-red (IR) spectra to be computed. Performing a population analysis computes the energy and charge distribution of the molecule, allowing for the molecular orbitals to be visualised.
Inorganic Computational Lab, Part 1
Creating a Molecule
BH3 Molecule
Creation of a BH3 molecule in GaussianView.
The first step of the computational lab involved creation of a BH3 molecule in Gaussian.
BH3 with equidistant bonds |
The next step involved manipulating the bond lengths of the molecule, which was done so as shown here.
Optimising a Molecule
The bond lengths were then optimised using a basic STO-3-21G basis set, which is a relatively simple basis set. The key information for BH3, as obtained from Gaussian, are as such:
BH3 - B3LYP / 3-21G Level
| Summary Data | Convergence | Jmol | |||
|---|---|---|---|---|---|

|
Item Value Threshold Converged? Maximum Force 0.000217 0.000450 YES RMS Force 0.000105 0.000300 YES Maximum Displacement 0.000692 0.001800 YES RMS Displacement 0.000441 0.001200 YES |
| |||
| Bond Length | |||||
| 1.19 | |||||
| Bond Angle | |||||
| 120.0 | |||||
Better Basis Sets
Following the instructions given, the optimisation was run again using 6-31G as the basis set. The result was checked to be optimised and the following obtained:
| Summary Data | Convergence | Jmol | |||
|---|---|---|---|---|---|

|
Item Value Threshold Converged? Maximum Force 0.000012 0.000450 YES RMS Force 0.000008 0.000300 YES Maximum Displacement 0.000062 0.001800 YES RMS Displacement 0.000038 0.001200 YES |
| |||
| Optimisation log file here | |||||
| Bond Length | |||||
| 1.19 | |||||
| Bond Angle | |||||
| 120.0 | |||||
The total energy of BH3 obtained using the 3-21G basis set was -26.46225927au while that using the 6-31G was -26.61532313 a.u, similar to the values provided on the laboratory reference website. The bond length obtained was 1.19Å and the theoretical bond angle computed to be 120o, same as the value found in literature both for computational chemistry[1] and experimental analysis[2]thus the optimisation was deemed to be correctly performed. Further analysis will be given below in comparison to the other trigonal molecules built during the first week.
Basis Sets and Pseudopotentials
Optimisation of GaBr3 using Pseudopotentials
| Summary Data | Convergence Check | Low modes | |||
|---|---|---|---|---|---|

|
Item Value Threshold Converged? Maximum Force 0.000000 0.000450 YES RMS Force 0.000000 0.000300 YES Maximum Displacement 0.000003 0.001800 YES RMS Displacement 0.000002 0.001200 YES |
| |||
| Optimisation log file here: DOI:10042/31120 | |||||
| Bond Length | |||||
| 2.39 | |||||
| Bond Angle | |||||
| 120.0o | |||||
Optimisation of BBr3 using Pseudopotentials
| Summary Data | Convergence | Jmol | |||
|---|---|---|---|---|---|

|
Item Value Threshold Converged? Maximum Force 0.000034 0.000450 YES RMS Force 0.000018 0.000300 YES Maximum Displacement 0.000146 0.001800 YES RMS Displacement 0.000096 0.001200 YES |
| |||
| Optimisation log file here: DOI:10042/31197 | |||||
| Bond Length | |||||
| 1.93 | |||||
| Bond Angle 1 | |||||
| 120.0o | |||||
Analysis of Results
Comparison of Bond Length Data
The following table summarises the parameters computed using Gaussian, including the literature value and the percentage difference.
| Molecule | Computed Bond Length (Å) | Literature Value (Å) | Percentage Difference (%) |
|---|---|---|---|
| BH3 | 1.19 | 1.19 [1][2] | 0 |
| BBr3 | 1.93 | 1.896 [3] | 1.76 |
| GaBr3 | 2.39 | 2.239 [4] | 6.32 |
The computed values of bond length are close to the values found in literature. Thus, using the basic basis sets, it is possible to get reasonably close calculations of bond length. The percentage differences do increase from BH3 to GaBr3, which is to be expected. These molecules contain increased number of electrons, which would result in increased complexity and would require a more complex basis set for better calculation.
For bond angles, all optimised bond angles are 120o. This is to be expected for a D3H molecule as the ligands would want to obtain maximum separation in order to minimise electronic repulsion. This would then allow an energy minimum to be achieved and this is regardless of the central atom or ligand in question. Bond lengths, however, are less simple. Bond lengths are dependent on many factors and, consequently, are a measure of different properties of a bond. For example, bond length is related to bond order, and a shorter bond is often an indicator of greater bond strength. However, an increased bond length might also be simply because the Van Der Waal's radius of the atoms in the bond are bigger.
Comparing borane and boron tribromide, it can be observed that the B - X (X=ligand) bond length increases significantly from H to Br. Bromine has an increased number of electrons compared to Hydrogen, and the valence electrons in Br occupy the more diffuse 4s and 4p orbitals while the valence electrons in H occupy the considerably smaller s orbitals. Since we approximate bonding to be the interaction between valence electrons, we naturally expect the B-Br bond to be longer. However, while this may be the case, bond length is not as trivial a matter of comparing atomic sizes. Br is approximately 4.6 the size of H, however, the length of the B-Br bond is only 74% longer than the B-H bond. This might be due to effects of polarity - Bromine is more electronegative than Hydrogen, thus making the B-Br bond more polar than the B-H bond and would contribute to increased bond strength. Additionally, as covered in 2nd year, Br has filled p-orbitals which are capable of back donation into the empty p-orbitals on B. This is not possible for H due to the lack of filled p-orbitals. Thus, the B-Br bond would have higher bond strength than expected, which contributes to the smaller increase in length compared to the B-H bond.
Comparing boron tribromide and gallium tribromide, there is an increase in bond length from 1.93Å to 2.39Å. Looking at atomic radius, this is expected - both Ga and Br are in the same group while Ga is further down the group due to the increased number of electrons. The valence electrons in Ga thus occupies the more diffuse 4s and 4p orbitals compared to the 2s and 2p orbitals for B and thus possesses a larger atomic radius (130Å vs 95Å). Hence, one would expect Ga-X bonds to be longer than B-X bond. However, as mentioned before this does not necessarily mean that the Ga-Br bond is weaker. The literature value for the bond dissociation energy of Ga-Br is 402 kJ/mol compared to 390 for B-Br. This difference can be due to the fact that the 4p orbitals of Br are better to overlap with the 4p orbitals of Ga than the 2p orbitals of B, which leads to a stronger interaction.
A chemical bond is generally agreed to be interactions between the subatomic particles of atoms and molecules which result in lowering of stability. While these interactions were originally thought to be simply electrostatic interactions between subatomic particles of unlike charge, developments in quantum mechanics and our understanding of atomic structure have led to a more sophisticated view of bonding involving orbital interactions.
Bond strength can be informally classified into strong, medium and weak. Covalent bonds, for example, are examples of very strong bonds. The N-N bond strength in N2, which has very high bond order, is 944.84 ± 0.10 kJ/mol[5] and is an example of a strong bond. A weak bond would be bonds such as hydrogen bonds, which only have weak molecular interactions and have a bond dissociation energy of 0.2-40kJ/mol[6] As mentioned, in some cases bond length can give an indication of bond strength. In some structures there is no bond rendered in GaussView, this means that the bond is longer than what Gaussian determines to be a bond. However, this does not indicate that there is no molecular interaction between the atoms in question. A shorter bond would naturally allow greater orbital interaction and would lead to a stronger bond. As in the above case involving GaBr3 and BBr3, a longer bond can be stronger than the a shorter bond.
Frequency Analysis
The frequency analysis was run using Gaussian and the following obtained:
BH3:B3LYP/6-31G(d,p) Frequency file: here
| summary data | Convergence Check | Low modes |
|---|---|---|

|
Item Value Threshold Converged? Maximum Force 0.000006 0.000450 YES RMS Force 0.000003 0.000300 YES Maximum Displacement 0.000024 0.001800 YES RMS Displacement 0.000012 0.001200 YES |
Low frequencies --- -0.9518 -0.8950 -0.0054 5.5279 11.6171 11.6560 Low frequencies --- 1162.9955 1213.1821 1213.1848 |
| No. | Screencap | Wavenumber | Intensity | Description | Symmetry |
| 1 | 
|
1163 | 93 | Wagging motion with 3Hs moving together in unison in the z direction while B moves slightly in the opposite direction. Bond bending, IR active | A2" |
| 2 | 
|
1213 | 14 | Rocking motion of two Hs while the third H bends with a larger magnitude. Bond bending, very slight IR active | E' |
| 3 | 
|
1213 | 14 | Scissoring motion of two Hs while the Boron and third H moves slightly to ensure no change in mass. Bond bending, slight IR active | E' |
| 4 | 
|
2582 | 0 | Symmetric stretching of 3 Hs as the boron atom remains stationary.Bond stretching, not IR active | A1' |
| 5 | 
|
2715 | 126 | Asymmetric stretching of 2Hs in opposite directions, and the Boron is displaced to ensure that the center of mass is balanced. Bond stretching, IR active | E' |
| 6 | 
|
2715 | 126 | Assymmetric stretching where two Hs stretch in unison while the third H stretches in the opposite direction with a greater magnitude to retain the centre of massBond stretching, IR active | E' |
|
The IR spectrum obtained from Gaussian shows three peaks at 2716, 1213 and 1163 cm-1 instead of the six values obtained. This is because there are two degenerate frequencies, thus vibrations 2 and 3 overlap, as do vibrations 5 and 6, resulting in only 2 peaks for 4 vibrational modes. Also, vibration 4 is a symmetric and causes no change in overall dipole moment, hence is IR inactive.
Frequency Analysis for GaBr3
The frequency analysis for Gallium tribromide was run using Gaussian and the following obtained:
GaBr3:B3LYP/6-31G(d,p) Frequency file: here DOI link: DOI:10042/31163
| summary data | Convergence Check | Low modes |
|---|---|---|

|
Item Value Threshold Converged? Maximum Force 0.000000 0.000450 YES RMS Force 0.000000 0.000300 YES Maximum Displacement 0.000002 0.001800 YES RMS Displacement 0.000001 0.001200 YES |
Low frequencies --- -0.5252 -0.5247 -0.0024 -0.0010 0.0235 1.2010 Low frequencies --- 76.3744 76.3753 99.6982 |
Vibrational spectrum for GaBr3
| No. | Screencap | Wavenumber | Intensity | Description | Symmetry |
| 1 | 
|
76 | 3 | Two Brs rocking while the third Br bends, with slight Ga movement to preserve the centre of mass. IR Active, bend | E' |
| 2 | 
|
76 | 3 | Scissoring motion of 2 Brs while the last Br and Ga moves slightly to preserve CoM. very slight IR active, bend | E' |
| 3 | 
|
100 | 9 | Wagging motion of the Bromines while the Ga is displaced in the opposite direction. very slight IR active, bend | A2" |
| 4 | 
|
197 | 0 | Symmetric stretch of 3 Brs while Ga remains stationary. No change in dipole momentnot IR active, stretch | A1' |
| 5 | 
|
316 | 57 | Asymmetric stretch of 2 Brs while the 3rd Br remains stationary. Slight movement of Ga to preserve CoM. IR active, stretch | E' |
| 6 | 
|
316 | 57 | Assymmetric stretch of Brs where 2 bromines stretch in unison while the 3rd stretches in the opposite direction. IR active, stretch | E' |
|
Comparison between modes
| Vibrational Mode | BH3 | GaBr3 |
|---|---|---|
| A2" | 1163 | 100 |
| E' | 1213 | 76 |
| E' | 1213 | 76 |
| A1' | 2583 | 197 |
| E' | 2716 | 316 |
| E' | 2716 | 316 |
For the same vibrational modes, the frequencies for GaBr3 are all lower compared to BH3. This is to be expected, since both the ligand atoms and central atoms have been substituted with atoms of increased mass. A commonly adopted approach is to view a chemical bond as a spring with a point mass attached on either end. This allows the bond to be approximated as a harmonic oscillator, where frequency , where is the reduced mass of the system. With an increase in mass of both the ligand and central atoms, the reduced mass of the system increases, resulting in a decrease in vibrational frequency. Thus, it makes sense that the frequencies for GaBr3 is lower than BH3.
Comparing the two molecules, the low frequencies have the same ordering while for the higher frequencies, the A2 mode in BH3 has the lowest frequency. This is unlike in GaBr3, where the A2 mode has the 3rd lowest frequency. The intensity in the vibrational modes with umbrella motions also differ greatly, with 93 for BH3 compared to 9 for GaBr3. The frequency of the umbrella motions also differ, with 1193 for BH3 compared to 100 for GaBr3. The displacement vectors in GuassView shows that the central Ga atom in GaBr3 has the largest displacement while the hydrogen ligands in BH3 have the greatest displacement vector. This can be attributed to the difference in reduced mass of the two systems. It is easier for a smaller molecule to wag compared to a bigger one, thus the wagging motion in GaBr3 (A2") corresponds to a higher energy vibration.
The same method and basis set for optimisation and frequency analysis must be used to ensure that the molecule can be suitably compared. A simpler basis set would have less approximations and have different results compared to a more complex basis set, and thus it does not make sense that a frequency analysis be computed with a simpler basis set while the optimisation be done with a more complex basis set. Using different basis sets to perform calculations leads to different overall energies, which makes it unsuitable for comparison. The entire purpose of the frequency analysis is to ensure that the molecule has been suitably optimised using the basis set chosen, and so the same sets should be used.
In the calculation, Gaussian uses calculus to locate the minimum point in the potential energy surface of the molecule investigated. A frequency analysis is done to ensure that a minimum point has been adequately chosen instead of a maximum or saddle point where the derivative is also 0. Having real vibrational frequencies allow us to check that the structure is indeed optimised and has minimum energy. The six 'low frequencies' refer to the 6 vibrational modes in the formula for vibrational frequencies, 3N-6. These 6 frequencies are representative of the motions of the centre of mass of the molecule, and thus should be as close to 0 as possible for greatest accuracy. From the comparison of vibrational data, it can also be seen that lower frequency vibrations involve more bond-bending while higher frequency vibrations involve more bond stretching. Bond bending requires lower energy compared to bond stretching, and consequently bond bending is observed at a lower frequency compared to bond stretching.
Molecular Orbital Visualisation
The MOs for BH3 was visualised using Gaussian and the MOs obtained (.log file here, chk file found here, DOI file here; DOI:10042/31385 . Screen captures of the molecular orbitals were obtained and superposed on top of the LCAO molecular orbitals of BH3 we had learnt to draw in year 2:

It must be noted that the energy gaps between the various levels are not drawn to scale as indicated by the squiggly line - the 1s orbital has an energy of -6.77 au and the next level has an energy of -0.51 au. This large gap in energy is why the first MO is essentially made up of the 1s orbital of boron, as the orbital is too low to interact with the orbital of the same symmetry on the H3 fragment. From the models obtained from the computation, it is clear that the LCAO approach, while not very rigorous and requires some estimation of relative contributions and energy levels, are suitably accurate for depicting the molecular orbitals of simple molecules. Naturally, the specific energy values would not be able to be obtained from the LCAO approach. However, the general shape and phase of the molecular orbitals, as well as the symmetry, can be discerned.
Non-Bonding Orbitals
The NH3 molecule was optimised using the parameters given, with the following obtained:
| Summary Data | Convergence | Jmol | |||
|---|---|---|---|---|---|

|
Item Value Threshold Converged? Maximum Force 0.000024 0.000450 YES RMS Force 0.000012 0.000300 YES Maximum Displacement 0.000079 0.001800 YES RMS Displacement 0.000053 0.001200 YES |
| |||
| Optimisation log file here | |||||
| Bond Length | |||||
| 1.02 | |||||
The frequency analysis was run using Gaussian and the following obtained:
NH3:B3LYP/6-31G(d,p) Frequency file: here
| summary data | Convergence Check | low modes |
|---|---|---|

|
Item Value Threshold Converged? Maximum Force 0.000021 0.000450 YES RMS Force 0.000009 0.000300 YES Maximum Displacement 0.000078 0.001800 YES RMS Displacement 0.000039 0.001200 YES |
Low frequencies --- -30.7295 0.0009 0.0013 0.0018 20.1705 28.2664 Low frequencies --- 1089.5535 1694.1244 1694.1856 |
The low frequencies were observed to be out of the range stipulated, so the NH3 molecule was optimised again using stricter convergence criteria:
| Summary Data | Convergence Check | Jmol | |||
|---|---|---|---|---|---|

|
Item Value Threshold Converged? Maximum Force 0.000006 0.000015 YES RMS Force 0.000004 0.000010 YES Maximum Displacement 0.000012 0.000060 YES RMS Displacement 0.000008 0.000040 YES |
| |||
| Optimisation log file here | |||||
| Bond Length | |||||
| 1.02 | |||||
The frequency analysis was run using Gaussian and the following obtained:
NH3:B3LYP/6-31G(d,p) Frequency file: here
| Summary data | Convergence check | Low Modes |
|---|---|---|

|
Item Value Threshold Converged? Maximum Force 0.000006 0.000450 YES RMS Force 0.000003 0.000300 YES Maximum Displacement 0.000013 0.001800 YES RMS Displacement 0.000007 0.001200 YES |
Low frequencies --- -0.0138 -0.0026 -0.0008 7.0783 8.0932 8.0937 Low frequencies --- 1089.3840 1693.9368 1693.9368 |
Vibrational spectrum for NH3
| wavenumber | Intensity | IR active? | type |
| 1090 | 145 | yes | bend |
| 1694 | 14 | very slight | bend |
| 1694 | 14 | very slight | bend |
| 3461 | 1 | no | stretch |
| 3589 | 0.2700 | no | stretch |
| 3590 | 0.2709 | no | stretch |
|
The population analysis was run using Gaussian, log file found here, DOI log file here: DOI:10042/31386
| Summary Data | Charge Distribution | |
|---|---|---|

|

Range between -1.125 to +1.125 |

|
From the screen captures, Nitrogen has a negative charge while Hydrogen positive, as is expected due to their relative electronegativities. NH3 is a neutral molecule, and correspondingly the sum of the charges on the hydrogen atoms is equal in magnitude to the charge on the Nitrogen atom.
Association Energies
Optimisation of Ammonium Borane using 6-31G(d,p)
A molecule of NH3 was created in Gaussian and optimised, with the following parameters obtained:
| Summary Data | Convergence | Jmol | |||
|---|---|---|---|---|---|

|
Item Value Threshold Converged? Maximum Force 0.000002 0.000015 YES RMS Force 0.000001 0.000010 YES Maximum Displacement 0.000027 0.000060 YES RMS Displacement 0.000012 0.000040 YES |
| |||
| Optimisation log file here | |||||
| B-N Bond Length | N-H Bond Length | B-H Bond Length | |||
| 1.67 | 1.21 | 1.02 | |||
| Bond Angle | |||||
| -o | |||||
The frequency analysis was run and checked to be correct.
BH3NH3:B3LYP/6-31G(d,p)
Frequency file: here
| Summary Data | Convergence Check | Low Modes |
|---|---|---|

|
Item Value Threshold Converged? Maximum Force 0.000004 0.000450 YES RMS Force 0.000001 0.000300 YES Maximum Displacement 0.000028 0.001800 YES RMS Displacement 0.000013 0.001200 YES |
Low frequencies --- -3.5001 -0.0010 -0.0007 0.0008 2.1901 7.0672 Low frequencies --- 263.3572 632.9821 638.4587 |
Vibrational spectrum for NH3BH3

The energy for NH3, BH3 and NH3BH3 were then obtained from the summary data:
| Molecule | Energy |
|---|---|
|
NH3 |
-56.55776856 a.u. |
|
BH3 |
-26.61532363 a.u. |
|
NH3BH3 |
-83.22468916 a.u. |
Calculating the B-N bond energy:
The final calculated bond energy is -135.47 kJ/mol. The experimental value has been found to be 130.1 ± 4.2 kJ /mol[5], so this is a reasonably close value with a percentage difference of approximately 3.7%. From the broad definition I provided above, the B-N bond falls within that for a medium bond and the overall bond formation is favourable. Given our knowledge that this compound is an adduct of a lewis acid and lewis base, this seems reasonable - BH3 can be seen as a reasonably hard acid while NH3 is a reasonably hard base, and hard acid-hard base interactions are favourable.
Inorganic Computational Lab, Part 2: Aromaticity Mini-Project
Introduction
Benzene is a compound of immense chemical interest due to its unique ring structure, characteristic of many aromatic compounds, and utility as a precursor in synthesizing many other aromatic compounds. Its identical C-H bond lengths, all between the lengths of a C-H single bond and a C-H double bond, presented a curious puzzle to earlier inquirers. Many structures were presented, and Kekule eventually proposed a ring structure for the compound. To explain the bonding between the different atoms in benzene, an MO picture involving the formation of delocalised π orbitals have been proposed.
Scientists have since discovered many compounds similar in structure, such as boratabenzene, borazine and pyridine. These different analogues of benzene have one or more carbon atoms substituted by other atoms, and these heteroatoms are expected to bring about major differences not only to the bond lengths in the compound, but also to the MO and NBOs of the original benzene. However, LCAO approximations of the MOs of benzene at the undergraduate level are too simplistic to account for such differences exactly - most if not all texts utilise the p orbitals exclusively to construct the frontier orbitals, neglecting the sigma orbitals. In addition, it is difficult to qualitatively account for the effect of the heteroatoms on the structures for the MOs and NBOs. Thus, this project aims to use computational chemistry to elucidate the properties of benzene and its analogues.
Computational Analysis of Benzene
Optimisation of Benzene
Using Gaussian, C6H6 (benzene) was optimised using density functional theory via B3LYP exchange-correlational functional. The 3-21G basis set was first used to obtain an approximation of the optimised molecule, before a more accurate basis set of 6-31G was utilised to optimise the approximated molecules. The table below shows the successive optimisation for benzene:
| No. | Molecule | Convergence Data | Summary Data | |||
|---|---|---|---|---|---|---|
| 1 |
|
Item Value Threshold Converged? Maximum Force 0.000212 0.000450 YES RMS Force 0.000075 0.000300 YES Maximum Displacement 0.000737 0.001800 YES RMS Displacement 0.000261 0.001200 YES |

colspan="3" | Optimisation log file here | |||
| 2 |
|
Item Value Threshold Converged? Maximum Force 0.000074 0.000450 YES RMS Force 0.000019 0.000300 YES Maximum Displacement 0.000111 0.001800 YES RMS Displacement 0.000051 0.001200 YES |

colspan="3" | Optimisation log file here |
Frequency Analysis
A frequency analysis of benzene was then run.
| Summary Data | Convergence Check | Low Modes |
|---|---|---|

|
Item Value Threshold Converged? Maximum Force 0.000063 0.000450 YES RMS Force 0.000027 0.000300 YES Maximum Displacement 0.000089 0.001800 YES RMS Displacement 0.000039 0.001200 YES |
 Low frequencies ---  -11.2063   -7.2461   -7.2461   -0.0055   -0.0055   -0.0003
 Low frequencies ---  414.4985  414.4985  621.0622
Frequency log file File:KN BENZENE FREQ.LOG |
The low frequencies were checked to be within the acceptable range, thus the molecule deemed to be adequately optimised at the 6-31G level.
Analogues of Benzene
Optimisation
Following that for benzene, optimisation was similarly carried out on the analogues of benzene using a two step process, first with the 3-21G basis set and then the 6-31G basis set. For brevity, only the 6-31G basis set is shown:
| Data | Boratabenzene | Pyridine | Borazine | |||||||||
|---|---|---|---|---|---|---|---|---|---|---|---|---|
| Jmol file |
|
|
| |||||||||
| Convergence Check |
Item Value Threshold Converged? Maximum Force 0.000067 0.000450 YES RMS Force 0.000020 0.000300 YES Maximum Displacement 0.000304 0.001800 YES RMS Displacement 0.000089 0.001200 YES |
Item Value Threshold Converged? Maximum Force 0.000004 0.000015 YES RMS Force 0.000001 0.000010 YES Maximum Displacement 0.000014 0.000060 YES RMS Displacement 0.000004 0.000040 YES |
Item Value Threshold Converged? Maximum Force 0.000012 0.000015 YES RMS Force 0.000004 0.000010 YES Maximum Displacement 0.000025 0.000060 YES RMS Displacement 0.000009 0.000040 YES | |||||||||
| Summary Data | 
Optimisation log file here |

Optimisation log file here |

Optimisation log file here |
Frequency Analysis
Similarly, frequency analyses of the analogue were then run.
| No. | Molecule | Summary Data | Convergence Check | Low Modes |
|---|---|---|---|---|
| 1 | Boratabenzene (C5H6B)
|

|
Item Value Threshold Converged? Maximum Force 0.000133 0.000450 YES RMS Force 0.000038 0.000300 YES Maximum Displacement 0.000334 0.001800 YES RMS Displacement 0.000116 0.001200 YES |
 Low frequencies ---   -7.0634    0.0003    0.0006    0.0009    3.1873    5.1409
 Low frequencies ---  371.3080  404.4215  565.1050
Frequency log file File:KN BORATABENZENE FREQ.LOG |
| 2 | Pyridine (C5H6N)
|

|
Item Value Threshold Converged? Maximum Force 0.000006 0.000450 YES RMS Force 0.000002 0.000300 YES Maximum Displacement 0.000014 0.001800 YES RMS Displacement 0.000005 0.001200 YES |
 Low frequencies ---   -9.3856   -2.9496   -0.0005   -0.0005    0.0007    0.8619
 Low frequencies ---  391.8993  404.3445  620.1988
Frequency log file File:KN pyridine freq.log |
| 3 | Borazine (N3H3B3H3)
|

|
Item Value Threshold Converged? Maximum Force 0.000019 0.000450 YES RMS Force 0.000008 0.000300 YES Maximum Displacement 0.000023 0.001800 YES RMS Displacement 0.000011 0.001200 YES |
 Low frequencies ---   -4.1503   -4.1313   -3.0161   -0.0040    0.0158    0.0200
 Low frequencies ---  289.7383  289.7390  404.5904
Frequency log file File:KN BORAZINE FREQ.log |


Molecular Orbitals
Benzene
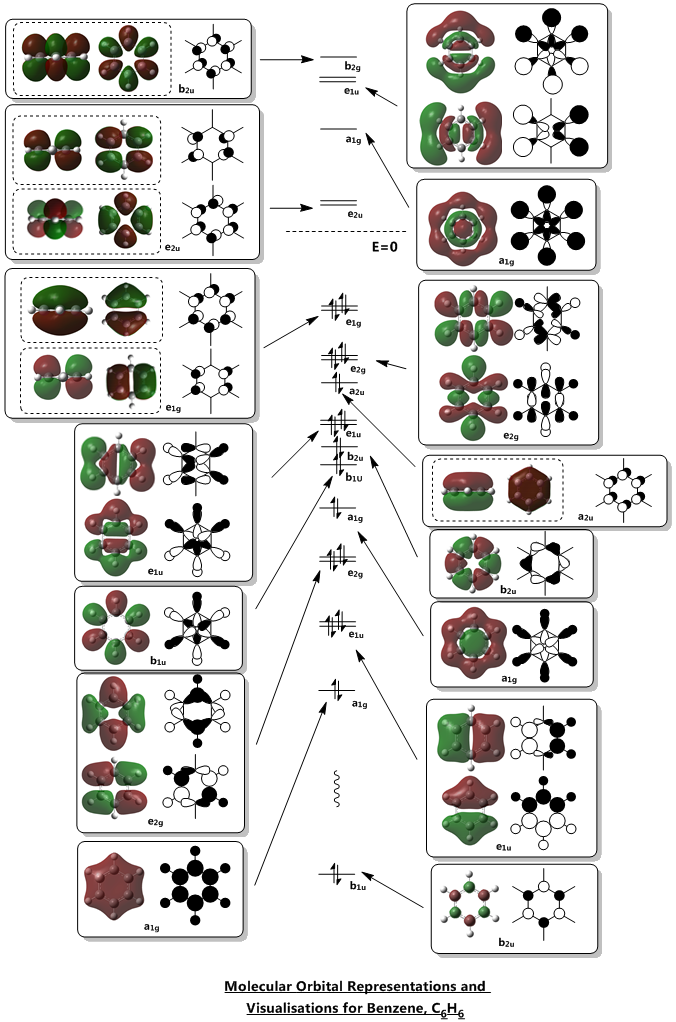
The molecular orbitals of benzene were visualised using Gaussian from the population analysis .chk file. In most texts, the orbitals of interest are the frontier orbitals of pi symmetry, and not orbitals very low in energy. However, it is apparent from the computation that there are a great deal of orbitals of sigma symmetry that are not normally examined in conventional texts. For our analysis, the 6th - 26th molecular orbital were identified. Strictly speaking, the 6th orbital is too low in energy and is a core orbital, but was identified for the sake of comparison. The visualisation was stopped at the 26th MO as it is the last unoccupied molecular orbital of pi symmetry. Using the visualisations as reference, the LCAO representations were then drawn.

Implications of MO representations on Aromaticity
Benzene and its analogues are considered aromatic. Aromaticity in chemistry refers to the phenomenon where there is additional stabilisation in a conjugated, planar cyclic system. The Hückel rule is an accepted rule with quantum mechanical origins that can be expressed in a simple form - essentially, any conjugated, planar cyclic system would be aromatic if there are 4n+2 p electrons and anti-aromatic if there are 4n electrons, where n is the number of atoms in the system. For benzene, the experimentally determined energy of hydrogenation is 208kJ /mol instead of the theoretically determined 360kJ /mol. This means that benzene is far lower in energy in its ground state than expected, and this is the stabilisation that aromaticity confers.
The most oft-studied orbitals of benzene are the pi orbitals, formed due to the cyclic array of p-orbitals from each carbon after sigma-bonding has been accounted for. These remaining orbitals form 3 bonding MOs and 3 non-bonding MOs, all 6 of which can be represented by considering the pi-orbitals formed in linear 1,3,5 hexatriene. Using such an approach, it can be found that the number of nodal regions between the carbons in an acyclic chain of 6 p-orbitals increase from no nodes (completely bonding) to six nodes (completely antibonding). Thinking of a ring as a chain formed from two linked ends of a chain, the nodes would form nodal planes instead. From the computations, we can see that these representations are indeed correct - it is clear that the bonding aa2u molecular orbital has no nodes between the C atoms, the bonding e1g has 1 nodal plane each, the antibonding e2u has 2 nodal plane each and the antibonding b2g have nodes between all 6 carbons. This shows that the commonly established rationalisation for the MOs formed in a cyclic planar, conjugated system is accurate. For Benzene, two of these pi molecular orbitals are the two degenerate HOMOs computed. The electronic configuration of benzene allows for the 3 bonding MOs to be fully filled, forming the closed shell which accounts for the stability of benzene. Should there be two less p electrons, Hund's rule dictates that each HOMO would be singly filled, resulting in a di-radical which is unstable, thus leading to antiaromaticity.
As can be seen, there was some consideration to the relative contributions of the s and p orbitals of the various atoms. However, the exact numbers and percentages cannot be ascertained without further computations which are beyond the scope of the report. Some of the representations may also not necessarily be very accurate. For instance, the first e2g orbital was drawn to have some contribution from a p-orbital. However, this may not necessarily be the case, indeed, it may be possible that the p-orbital contribution not be present in a lower energy molecular orbital.
Some interesting properties of molecular orbitals can also be gleaned from the energy level diagram. For instance, while it is a common assumption that antibonding orbitals are high in energy, this is not necessarily true. Several of the low energy orbitals of benzene are overall antibonding in character but are still relatively low in energy. The key difference is in the location of the antibonding nodes - most of the low-energy antibonding orbitals either have nodes localised on the atoms or in the space between atoms, while most of the high-energy antibonding orbitals have nodes between atoms and located on the bonds. This is consistent with the knowledge that interactions (i.e. orbital overlap)` through bonds are stronger than interactions in free space.
Effects of substitution on Molecular Orbitals
Effects of substitution on Molecular Orbitals Boron (1s2 2s2 2p1), Carbon (1s2 2s2 2p2) and Nitrogen (1s2 2s2 2p3), are all consecutive elements on the same period. Their atomic number differ only by 1 and their electrons occupy atomic orbitals of similar energy levels. Thus, the atomic orbitals should overlap to similar extents. For molecules that are very similar, such as the analogues (with one atom substituted) and borazine (which is also radially symmetrical with a C3 axis, the molecular orbitals formed through the linear combination of these atomic orbitals should not be radically different from benzene’s in terms of occupancies or amount of molecular orbitals formed.
However, we would expect several differences upon substituting the atoms, such as:
• Loss of degeneracy
• Different Energy levels
• Shapes of orbitals
Firstly, we expect that substituting a C with a heteroatom would disrupt the D6H symmetry of the benzene molecule, resulting in a molecule with C2V point group. The D6H point group contains several degenerate irreducible representations while the C2V point group does not have degenerate irreducible representations. Thus, the degeneracy of several orbitals in benzene would be lost. For borazine, with a D3H point group, this degeneracy would be lost to a lesser extent. From the Gaussian computations, we find that this is indeed the case. For boratabenzene and pyridine, most of the MOs analogous to the degenerate MOs in benzene are close in energy but not degenerate. Some examples of these MOs are found below.
Secondly, the energy levels should be different. This is clear because the energy levels of the atomic orbitals of B, C and N are different, so the molecular orbitals formed from LCAO would consequently differ in energy. For atoms of increasing nuclear charge, the energy of the orbitals would decrease due to increased electrostatic attraction causing stability. We would then expect boratabenzene, with a higher energy boron, to have MOs of higher energy while pyridine to have MOs of lower energy. For boratabenzene, the difference is not so obvious to be immediately discerned. The computations reveal this to be true – while the HOMO in benzene are all low in energy, the HOMO in boratabenzene is higher in energy and positive in nature while the HOMO in pyridine is lower than that in benzene.
Thirdly, the shapes of the molecular orbitals formed would be different, with the reasoning similar to the above two differences. We expect different molecules with different symmetry to have molecular orbitals of different energy. Additionally, since the energy of the atomic orbital is directly related to its size, we expect atomic orbitals of different energy to have different sizes. Substituting one or more atoms in benzene would thus lead to the MOs formed to have different shapes. This is indeed the case, as shown from the computations, and this is examined in the next section.
Comparison of Molecular Orbitals of the Analogues
Using Gaussian, the molecular orbitals of the different analogues were visualised and compared with Benzene's as a reference. Despite the differences mentioned above, the orbitals are still structurally very similar and the MOs of the same levels bear a close resemblance to one another. This can be seen in the molecular orbital visualisations below. Of the occupied MOs, 5 were picked out for analysis. The first 3 are the occupied pi orbitals in benzene, chosen because these orbitals are commonly represented in literature as the key orbitals of interest in benzene. The last two are a set of degenerate sigma orbitals, picked to examine the effect of substitution on the sigma orbitals.
| Benzene | Boratabenzene | Pyridinium | Borazine | |
|---|---|---|---|---|
| Visualisation |  |
 |
 |
 |
| MO Order | HOMO | HOMO | HOMO - 1 | HOMO |
| Energy (a.u) | -0.24691 | +0.01094 | -0.50847 | -0.27594 |
| Visualisation |  |
 |
 |
 |
| MO Order | HOMO | HOMO - 1 | HOMO | HOMO |
| Energy (a.u) | -0.24691 | -0.03493 | -0.47886 | -0.27594 |
As can be observed for benzene, the HOMO are a pair of degenerate pi orbitals. Each orbital possesses a node in the plane of the molecule and a node along one of the C2 axes of the molecule. HOMO 1, as indicated in the table, has a node running between the C atoms while HOMO 2 has a node running through the C atoms. Thus, we would expected HOMO 1, which has probability distribution in the region around all the C atoms, to show great deviation upon substitution of a single C atom. HOMO 2, which have regions of zero probability around two of the C atoms, would be expected to show less deviation upon substitution of one of those C atoms. Looking at the analogous MOs in the other 3 molecules, this can be immediately observed. The orbitals analogous to HOMO 2 are the same shape regardless of the substitution of atoms and look virtually identical to the MO in benzene. Interestingly, the ordering and phases of the orbitals are different for pyridine compared to boratabenzene, this is possibly due to the difference in the electronegativity of the atoms but cannot be confirmed. This visualisation shows that the orbital contribution of the two oppositely located atoms in the ring are likely to be negligible for this particular MO.
For HOMO 1, the analogous MOs now differ greatly. The first difference is the loss of degeneracy in boratabenzene and pyridine; as mentioned, this is to be expected. The second difference is in the sizes of the lobes of the MOs. In benzene, all 4 lobes are of the same size but this is not so for the other compounds, where two of the lobes are sized differently from the other two. For boratabenzene, the half of the molecules with 3 carbon atoms have smaller lobes while for pyridine, the half with 3 carbon atoms have larger lobes. As expected, the difference in size is more pronounced for pyridine due to the greater difference in electronegativity from N to C as compared to B to C. Interestingly, the half with 2 N atoms in borazine have the larger lobes, and there does not seem to be a trend as to whether the electronegativity of the atoms have an effect on the size of the lobes.
| Benzene | Boratabenzene | Pyridinium | Borazine | |
|---|---|---|---|---|
| Visualisation |  |
 |
 |
 |
| MO Order | HOMO | HOMO | HOMO - 1 | HOMO |
| Energy (a.u) | -0.35997 | -0.13211 | -0.64062 | -0.36134 |
The last pi orbital for benzene has a single node through the plane of the molecule. Since the orbital has a mirror plane running in the plane of the molecule, it is expected that substituting one or more of the atoms with an atom of similar energy levels would not have much effect on the shape of this molecular orbital, and this is indeed correct. As seen in the visualisation, the analogous MOs of the other compounds all closely resemble the MO in benzene. The key difference is that for boratabenzene and pyridine, the MOs are no longer rotationally symmetric about the z axis and are now distorted. This is to be expected given the substitution of one of the atoms in the ring. For boratabenzene, the molecule is still rotationally symmetric about the z axis and thus still has a very similar MO to benzene, as expected.
| Benzene | Boratabenzene | Pyridinium | Borazine | |
|---|---|---|---|---|
| Visualisation |  |
 |
 |
 |
| MO Order | HOMO - 11 | HOMO - 11 | HOMO - 11 | HOMO - 11 |
| Energy (a.u) | -0.74001 | -0.46083 | -0.99321 | -0.83516 |
| Visualisation |  |
 |
 |
 |
| MO Order | HOMO - 11 | HOMO - 12 | HOMO - 12 | HOMO - 11 |
| Energy (a.u) | -0.74001 | -0.51955 | -1.02631 | -0.83516 |
The last set of degenerate orbitals were picked due to the resemblance to the HOMOs in benzene. Indeed, the last set of degenerate orbitals would resemble large ‘p’ orbitals while the HOMO pair of degenerate orbitals resemble large ‘d’ orbitals. Once again, it would be expected that for the MO with a node running through the atoms containing the substituted atom, the analogous MOs for the other compounds would not have much difference; this is indeed the case. Once again, the order of the energy levels in pyridine is now different from that in boratabenzene. Interestingly, as the MO for borazine shows, the MO is largely limited to two nitrogen atoms and not the third.
For the other analogous MOs, there is a much larger difference. While all three MOs still have just one node between the two phases, the sizes of the opposite phases are now very different Both the electropositive halves of boratabenzene and pyridine having larger lobes while the electronegative half of borazine has larger lobes.
Charge Distribution
The charge distribution of the benzene and the various analogues were then computed. The charge distribution were obtained both in the form of color and numerical distribution, with green colour indicating high positive charges and red colour indicate high negative charges. The more negative the charge, the greater the electron density about the region.
| Charge Distribution of Benzene | |
|---|---|
| By Color | Numerical Distribution |

Range: -0.3-+0.3 |

|
| DOI File here: DOI:10042/31387 | |
| Charge Distribution of Benzene Analogues | ||
|---|---|---|
| Boratabenzene | Pyridinium | Borazine |

Range: -0.453 - +0.453 |

Range: -0.483 - +0.483 |

Range: -1.102 - +1.102 |

|

|

|
| DOI file here: DOI:10042/31382 | DOI file here: DOI:10042/31383 | DOI file here: DOI:10042/31384 |
Analysis of Charge Distribution
| Atom | Benzene | Boratabenzene | Pyridinium | Borazine | Numbering |
|---|---|---|---|---|---|
| 1 | -0.239 | 0.202 | -0.476 | -0.102 | 
|
| 2 | -0.239 | -0.588 | 0.071 | 0.747 | |
| 3 | -0.239 | -0.588 | 0.071 | -0.102 | |
| 4 | -0.239 | -0.250 | -0.241 | 0.747 | |
| 5 | -0.239 | -0.250 | -0.241 | -0.102 | |
| 6 | -0.239 | -0.340 | -0.122 | 0.747 | |
| H1 | 0.239 | -0.097 | 0.483 | 0.432 | |
| H2 | 0.239 | 0.184 | 0.285 | -0.077 | |
| H3 | 0.239 | 0.184 | 0.285 | 0.432 | |
| H4 | 0.239 | 0.179 | 0.297 | -0.077 | |
| H5 | 0.239 | 0.179 | 0.297 | 0.432 | |
| H6 | 0.239 | 0.186 | 0.292 | -0.077 |
Benzene has a very symmetrical charge distribution due to its radially symmetric structure. As can be seen, the carbon atoms each have a charge of -0.239e and the Hydrogens have a charge of +0.239e. This is to be expected as Carbon is more electronegative than Hydrogen and would thus bear much of the negative charge compared to the hydrogens. Benzene is an electronically neutral molecule, and thus the charges add up to 0 as expected.
In boratabenzene and pyridinium, the 1st carbon has been substituted. Nitrogen is more electronegative than carbon while borine is more electropositive than carbon, and this difference is clearly apparent in the screen captures of colored NBO visualisations. The B atom in boratabenzene is now colored green due to it bearing a positive charge while the N atom in pyridinium is colored red due to it bearing a negative charge. Looking at the first row of the table also shows the difference, from -0.239 to 0.202 in boratabenzene and -0.476 in Pyridinium.
However, the substitution also brings about several other important changes. Looking at boratabenzene, the H bonded to the B atom is now bearing a charge of -0.097, a negative charge compared to the positive charges on the other H atoms (and the ones on benzene). This is due to H being more electronegative than B. Thus, the polarity of the B-H bond is inverted compared to the C-H bond. As can be seen from the decreased charges on the other Hs, the hydrogens in boratabenzene are less electron deficient (LR!!!) than benzene, which implies that they are more stable and less easily lost. Thus, boratabenzene is less acidic than benzene. Additionally, the C atoms alpha to the B atom bears a charge of -0.588 compared to -0.250 on the C atoms beta to the B atom. This is once again due to the nature of the C-B bonds.

However, the carbon furthest away from the B atom has the second highest electron density, which shows that the effects of electronegativity are induction based and resonance based. As can be seen from the diagram on the left, the resonance structure of boratabenzene shows that the carbons on the ortho and para positions would have higher electron density, which is what we obtained from the computation. As expected, due to the negative charge on boratabenzene (in order for it to be isoelectronic to benzene), the charges add up to -1.

Looking at pyridinium, one can see the effects of substituting a more electronegative atom for one benzene C. The alpha Cs are now green in color in the visualisations and bear a charge of 0.071 compared to the beta Cs, which are still red and bear a charge of -0.241. This is due to the polar nature of the C-N bond; nitrogen is highly electronegative and probably distorted the charge distribution of pyridinium a great deal compared to benzene. As expected, the H bonded to the N is now even more electropositive, as can be seen by the intense green color and the computed charge of +0.483 compared to +0.239 in benzene. In order to be isolectronic the molecule contains a +1 charge, this is likely to account for the increased positive nature of the other H atoms. However, these H atoms show less deviation from benzene, which is likely because the effect of the substitution is diminished with distance. Similarly, the Carbons on the meta position have higher electron density, with a charge of -0.241 compared to the carbon on the para position with a charge of -0.122. This can once again be rationalised using a simple resonance diagram as shown on the left.
Borazine is a symmetric molecule with symmetry D3H and contains N and H atoms, thus it provides a good comparison for the symmetric benzene and the substituted analogues. As can be observed, the N and B atoms now bear charges of higher magnitude with -0.102 on N and + 0.747 on B. This is higher compared to the charges on pyridinium and boratabenzene since the increase difference in electronegativity between B and N leads to bond of greater polarity. As before, the H-B and H-N bonds are still polar in nature and this is reflected in the +0.432 charges on the H bonded to B and the -0.077 charges on H bonded to N.
Conclusions
The mini-project allowed us to test the veracity of the commonly utilised LCAO approximations to aromatic molecules such as benzene, and it can clearly be seen that even simple treatments of atomic orbitals can lead to a computationally verifiable representations of complex molecular orbitals. In addition, the effects of electronegativities of substituted heteroatoms into aromatic rings were also examined through looking at the charge distributions and molecular orbital computations. It was seen that adjusting the electronegativities had great effect on the charge distribution through induction and resonance.
References
- ↑ 1.0 1.1 M. S. Schuurman, W. D. Allen, H. F. Schaefer, Journal of Computational Chemistry, 2005, 26 (11), 1106 DOI:10.1002/jcc.20238
- ↑ 2.0 2.1 K. Kawaguchi, Journal of Chemical Physics, 1992, 96, 3411 DOI:10.1063/1.461942
- ↑ Martinsen, K.-G., Vogt, N., Volden, H.V., Lyutsarev, V.S., Vogt, J. Journal of Mol. Struct. 1996, 385, 159
- ↑ Réffy, B., Kolonits, M., Hargittai, M. Journal of Mol. Struct. 1998, 445 139.
- ↑ 5.0 5.1 Luo, Y. R. Comprehensive Handbook of Chemical Bond Energies,CRC Press, Boca Raton, FL, 2007
- ↑ T. Steiner. Angewandte Chemistry Int. Ed. 2002, 41, 48 - 76