Rep:Mod:klInorgComp101292
BH3 Optimisation
3-21 G Optimisation
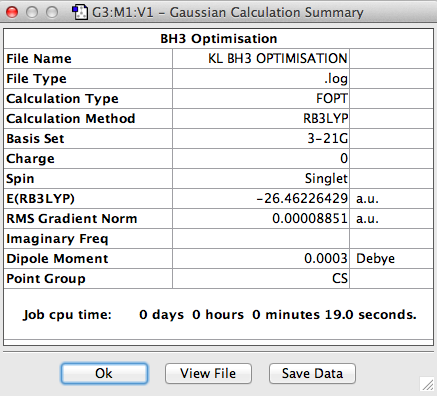
The symmetry of BH3 was reduced by changing the bond length of the three B - H bonds to 1.55, 1.54, 1.53 Å. The Structure is optimised using 3-21 G basis which is a poor approximation but the calculation requires less time. File:KL BH3 OPTIMISATION.LOG
The parameters is summarised below:
The most important information is the gradient since the derivative of energy is force. If the gradient is 0 then there is no net force acting on the molecule and the molecule is at a stable minimum point. The value of the gradient in this case is very close to 0 suggesting that the minimum point was identified and the optimisation was successful.
 Item               Value     Threshold  Converged?
 Maximum Force            0.000220     0.000450     YES
 RMS     Force            0.000106     0.000300     YES
 Maximum Displacement     0.000940     0.001800     YES
 RMS     Displacement     0.000447     0.001200     YES
 Predicted change in Energy=-1.672477D-07
 Optimization completed.
    -- Stationary point found.
                           ----------------------------
                           !   Optimized Parameters   !
                           ! (Angstroms and Degrees)  !
 --------------------------                            --------------------------
 ! Name  Definition              Value          Derivative Info.                !
 --------------------------------------------------------------------------------
 ! R1    R(1,2)                  1.1948         -DE/DX =   -0.0002              !
 ! R2    R(1,3)                  1.1947         -DE/DX =   -0.0002              !
 ! R3    R(1,4)                  1.1944         -DE/DX =   -0.0001              !
 ! A1    A(2,1,3)              120.0157         -DE/DX =    0.0                 !
 ! A2    A(2,1,4)              119.986          -DE/DX =    0.0                 !
 ! A3    A(3,1,4)              119.9983         -DE/DX =    0.0                 !
 ! D1    D(2,1,4,3)            180.0            -DE/DX =    0.0                 !
 --------------------------------------------------------------------------------
 GradGradGradGradGradGradGradGradGradGradGradGradGradGradGradGradGradGrad.
From the table above, the forces were converged and this reinforces the fact that the optimisation was successful.
The following data were obtained
| Bond | Length (Å) | Angle type | Angle |
|---|---|---|---|
| B - H1 | 1.19 | H1 - B - H2 | 120.0 |
| B - H2 | 1.19 | H1 - B - H3 | 120.0 |
| B - H3 | 1.19 | H2 - B - H3 | 120.0 |
6-31 G(d)(p) Optimisation
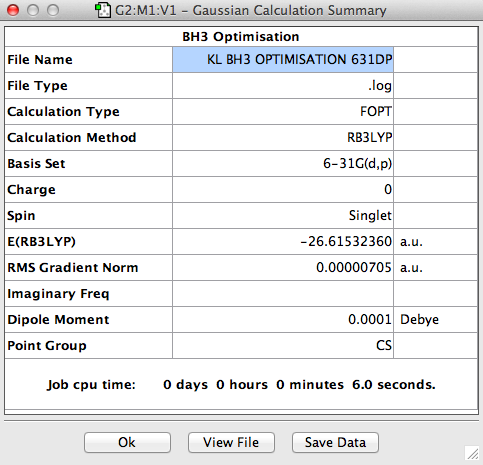
The BH3 molecule was further optimised using the full basis set 6-31G(d,p) is a much better approximation compared to 3-21 G. The log file for this calculation is shown here: File:KL BH3 OPTIMISATION 631DP.LOG
The value of the gradient is very close to 0 suggesting that the optimisation was successful.
 Item               Value     Threshold  Converged?
 Maximum Force            0.000012     0.000450     YES
 RMS     Force            0.000008     0.000300     YES
 Maximum Displacement     0.000061     0.001800     YES
 RMS     Displacement     0.000038     0.001200     YES
 Predicted change in Energy=-1.063892D-09
 Optimization completed.
    -- Stationary point found.
                           ----------------------------
                           !   Optimized Parameters   !
                           ! (Angstroms and Degrees)  !
 --------------------------                            --------------------------
 ! Name  Definition              Value          Derivative Info.                !
 --------------------------------------------------------------------------------
 ! R1    R(1,2)                  1.1923         -DE/DX =    0.0                 !
 ! R2    R(1,3)                  1.1923         -DE/DX =    0.0                 !
 ! R3    R(1,4)                  1.1923         -DE/DX =    0.0                 !
 ! A1    A(2,1,3)              120.0054         -DE/DX =    0.0                 !
 ! A2    A(2,1,4)              119.9939         -DE/DX =    0.0                 !
 ! A3    A(3,1,4)              120.0007         -DE/DX =    0.0                 !
 ! D1    D(2,1,4,3)            180.0            -DE/DX =    0.0                 !
 --------------------------------------------------------------------------------
 GradGradGradGradGradGradGradGradGradGradGradGradGradGradGradGradGradGrad
From the table above, the forces were converged and this reinforces that the optimisation was successful.
The following data were obtained
| Bond | Length (Å) | Angle type | Angle | |
|---|---|---|---|---|
| B - H1 | 1.19 | H1 - B - H2 | 120.0 | |
| B - H2 | 1.19 | H1 - B - H3 | 120.0 | |
| B - H3 | 1.19 | H2 - B - H3 | 120.0 |
GaBr3 Optimisation
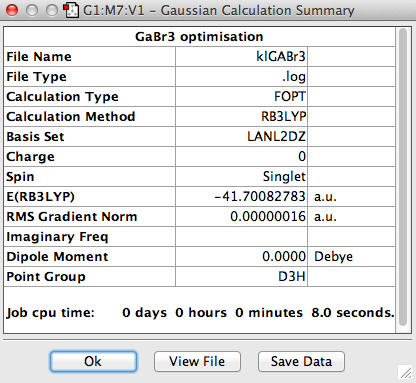
GaBr3 contains heavy atoms with many electrons compared to BH3 so it is inappropriate to use the full basis set. Therefore Pseudo-potentials is applied where only the electrons in the valence shell are considered. The molecule was optimised using the LandL2DZ basis. The log file for this calculation is shown here File:KlGABr3.LOG
The value of the gradient is very close to 0 suggesting that the optimisation was successful.
        Item               Value     Threshold  Converged?
 Maximum Force            0.000000     0.000450     YES
 RMS     Force            0.000000     0.000300     YES
 Maximum Displacement     0.000003     0.001800     YES
 RMS     Displacement     0.000002     0.001200     YES
 Predicted change in Energy=-1.282694D-12
 Optimization completed.
    -- Stationary point found.
                           ----------------------------
                           !   Optimized Parameters   !
                           ! (Angstroms and Degrees)  !
 --------------------------                            --------------------------
 ! Name  Definition              Value          Derivative Info.                !
 --------------------------------------------------------------------------------
 ! R1    R(1,2)                  2.3502         -DE/DX =    0.0                 !
 ! R2    R(1,3)                  2.3502         -DE/DX =    0.0                 !
 ! R3    R(1,4)                  2.3502         -DE/DX =    0.0                 !
 ! A1    A(2,1,3)              120.0            -DE/DX =    0.0                 !
 ! A2    A(2,1,4)              120.0            -DE/DX =    0.0                 !
 ! A3    A(3,1,4)              120.0            -DE/DX =    0.0                 !
 ! D1    D(2,1,4,3)            180.0            -DE/DX =    0.0                 !
 --------------------------------------------------------------------------------
 GradGradGradGradGradGradGradGradGradGradGradGradGradGradGradGradGradGrad
From the table above, the forces were converged and this reinforces that the optimisation was successful.
The following data were obtained
| Bond | Length (Å) | Angle type | Angle |
|---|---|---|---|
| Ga - Br1 | 2.35 | Br1 - Ga - Br2 | 120.0 |
| Ga - Br2 | 2.35 | Br1 - Ga - Br3 | 120.0 |
| Ga - Br3 | 2.35 | Br2 - Ga - Br3 | 120.0 |
BBr3
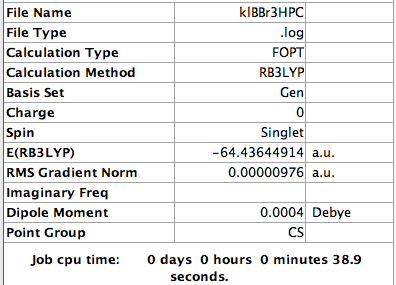
A mixture of basis-sets and pseudo-potentials was applied to BBr3. This is required as the basis is applied to the light B atom and pseudo-potentials for the heavy Br atoms. The molecule is optimised and the log file can be found here File:KlBBr3.log
The value of the gradient is very close to 0 suggesting that the optimisation was successful.
Item               Value     Threshold  Converged?
 Maximum Force            0.000018     0.000450     YES
 RMS     Force            0.000011     0.000300     YES
 Maximum Displacement     0.000115     0.001800     YES
 RMS     Displacement     0.000066     0.001200     YES
 Predicted change in Energy=-2.336751D-09
 Optimization completed.
    -- Stationary point found.
                           ----------------------------
                           !   Optimized Parameters   !
                           ! (Angstroms and Degrees)  !
 --------------------------                            --------------------------
 ! Name  Definition              Value          Derivative Info.                !
 --------------------------------------------------------------------------------
 ! R1    R(1,2)                  1.934          -DE/DX =    0.0                 !
 ! R2    R(1,3)                  1.9339         -DE/DX =    0.0                 !
 ! R3    R(1,4)                  1.934          -DE/DX =    0.0                 !
 ! A1    A(2,1,3)              120.0005         -DE/DX =    0.0                 !
 ! A2    A(2,1,4)              120.0021         -DE/DX =    0.0                 !
 ! A3    A(3,1,4)              119.9974         -DE/DX =    0.0                 !
 ! D1    D(2,1,4,3)            180.0            -DE/DX =    0.0                 !
 --------------------------------------------------------------------------------
 GradGradGradGradGradGradGradGradGradGradGradGradGradGradGradGradGradGrad
From the table above, the forces were converged and this reinforces that the optimisation was successful.
The following data were obtained
| Bond | Length (Å) | Angle type | Angle |
|---|---|---|---|
| B - Br1 | 1.93 | Br1 - B - Br2 | 120.0 |
| B - Br2 | 1.93 | Br1 - B - Br3 | 120.0 |
| B - Br3 | 1.93 | Br2 - B - Br3 | 120.0 |
Comparison of BH3, GaBr3 and BBr3
The table below summarised the mean bond length of each molecule
| Molecule | Bond Length |
|---|---|
| BH3 | 1.19 |
| BBr3 | 1.93 |
| GaBr3 | 2.35 |
This exercise demonstrated that the size of the ligand has an effect on the bond length. As the ligand increases in size, the bond length generally increases. The bond length of the B-H bond is 0.74 Å shorter than the B-Br bond. The only similarity between the H and Br ligand is that both atoms are 1 electron away from completing a full valence shell. However, the main difference between the two ligands is the location of this valence electron. In the H atom, the single electron is held in the inner 1s orbital with no shielding effects so the effective nuclear charge is very great. This means the valence electron is close to the nuclei so the atomic radii of the H atom is small. In contrast the valence electrons of the Br atom is held in the highly diffused 4p orbital where the 28 core electrons shields most of the nuclear charge leaving the 7 valence electrons with a very low effective nuclear charge. This suggests that the valence electrons are far away from the nucleus so the atomic radii of the Br atom is large. As a result, the 2p orbital of B overlaps better with the 1s orbital of H than that of the overlap of 2p B with 4p Br. Since the central B atom remains the same, we can conclude that this is the main reason why the B - H bond is shorter than the B - Br bond.
The same trend applies when the central atom changes from B to Ga while the ligands remain constant. The B - Br bond is 0.42 Å shorter than the Ga - Br bond. B and Ga are both in group 3 with 3 valence electrons but Ga is lower down the group. The 3 valence electrons in B is held in the inner 2p orbital with just 2 shielding electrons while the 3 valence electrons of Ga is held in the highly diffused 4p orbital with 28 core electrons shielding these valence electrons. This suggests that the effective nuclear charge on B is greater than the effective nuclear charge of Ga so the atomic radii for B is smaller than the atomic radii of Ga. Therefore, the interaction of B with Br is greater than that of Ga with Br and this is the primary reason why the B - Br bond is shorter than the Ga - Br. The boron atom usually undergoes dimerisation to to gain extra electron density whereas Ga does not enjoy this since it is a much poorer lewis acid so we would expect B to form stronger bond with lewis bases such as Br.
A chemical bond denotes 2 electrons and the real definition of a chemical bond is the electrostatic interaction between two atoms due to its electrons and nuclei. Chemical bonds have allowed many concepts of Chemistry to be understood, terms such as "bond breaking" and "bond formation" are powerful discription to follow a reaction. However a chemical bond only helps us to understand the situation, in reality a localised chemical bond does not exist, instead it is diffused around the whole molecule. It is useful to represent it as a straight line as it simplifies the situation in many ways while the chemistry can still be understood.
For some optimisation on Gaussview, the bonds between the atoms are absent. This does not necessarily mean that the bonds are not present, instead it means the software has failed to meet within the range of the parameters set by the user. As a result no bondings were observed in the programme but this does not mean that the bond doesn't exist in the real world.
More on NH3 and GaBr
Frequency analysis for BH3
Frequency analysis is carried out to confirm that the optimised structure is at the minimum point of the potential surface. Although the gradient in the previous parts was very close to 0,it just means the molecule is at a urning point, it can either be a maximum or a minimum. We need to consider the 2nd derivative of the potential surface to confirm that the turning point is a minimum. The 2nd derivative of potential surface is effectively the frequency, hence if the frequency is negative then the turning point is a maximum (transition state) and if it is positive then it is a minimum point. Frequency analysis also allow us to investigate the vibrational modes and the Ir spectrum of a molecule.
The frequency analysis was carried out on the 6-31 G(d)(p) optimised BH3 molecule
The log file is attached here
Low frequencies ---   -1   -1   0    6   12   12

Low frequencies --- 1163 1213 1213
The six frequencies are within the range of -15-15 cm1 and there are some negative frequencies with a very small magnitude but this is fine for the poor model we are using, the calculation would take much longer if we aim for perfect result. There is enough evidence to conclude that the molecule is at a minimum point on the potential surface. The energy remains the same during the frequency analysis calculation so the structure of the molecule remains constant.
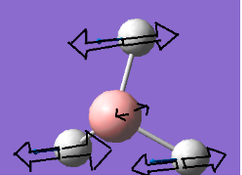
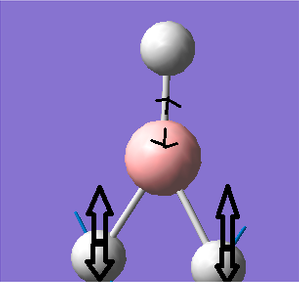
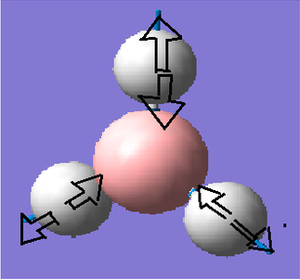
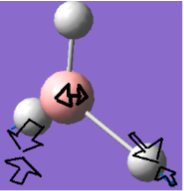
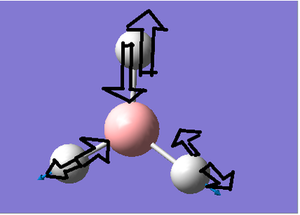
There are 3N-6 vibrational modes (6) but there are only 3 peaks in the IR spectrum. This is because some of these modes are degenerate in frequency even though their mode of vibration is different. Therefore these peaks are superimposed in the spectrum. The 4th vibrational mode is IR inactive because this vibrational mode is totally symmetric. As a result we only expect to see the peak at 1163, 1213 and 2715 cm-1 and these are the 3 peaks present in the spectrum.
Frequency Analysis of GaBr3
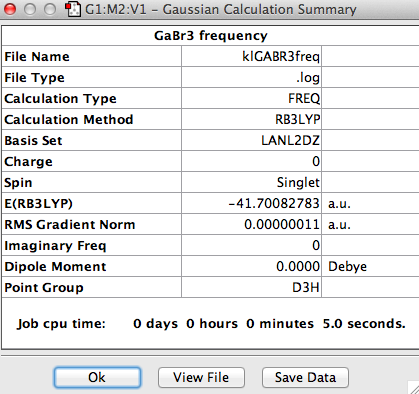
The log file can be found here File:KlGABR3freq.LOG
Low frequencies ---   -1   -1   0   0    0    1

Low frequencies ---   76  76  100
The six frequencies are within the range of -15-15 cm1 and there are some negative frequencies with a very small magnitude but this is fine for the poor model we are using, the calculation would take much longer if we aim for perfect result. There is enough evidence to conclude that the molecule is at a minimum point on the potential surface. The energy remains the same during the frequency analysis calculation so the structure of the molecule remains constant.
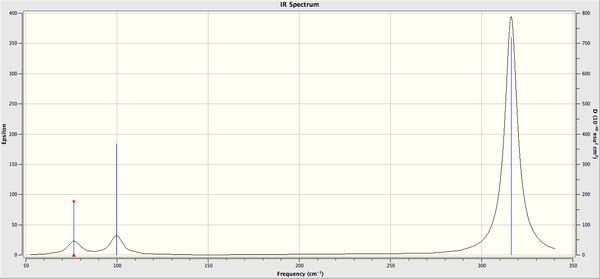
There are 3N-6 vibrational modes (6) but there are only 3 peaks in the IR spectrum. This is because some of these modes are degenerate in frequency even though their mode of vibration is different. Therefore these peaks are superimposed in the spectrum. The 4th vibrational mode is IR inactive because this vibrational mode is totally symmetric. As a result we only expect to see the peak at 76, 100 and 316 cm-1 and these are the 3 peaks present in the spectrum.
Comparison between GaBr3 and BH3
| Mode (GaBr3 | Frequency | Mode BH3 | Frequency | |
|---|---|---|---|---|
| 1 | 76 | 1 | 1163 | |
| 2 | 76 | 2 | 1213 | |
| 3 | 100 | 3 | 1213 | |
| 4 | 197 | 4 | 2582 | |
| 5 | 316 | 5 | 2715 | |
| 6 | 316 | 6 | 2715 |
From the table above, it can be seen that there is a large difference in frequency for the same vibrational mode of GaBr3 and BH3. In the previous part, we found out that B-H bonds are much stronger than Ga - Br bonds so would expect the vibrational modes of GaBr to be found at a much lower frequency in the IR spectrum. Frequency is defined by the following equation:
From this equation we can see that frequency v operates inverse proportionally with the reduced mass μ and the force constant k operates proportionally with frequency. The total mass in Ga -Br is much greater than that of B-H and the force constant of B - H is greater than the force constant in Ga - Br since B -H is the stronger bond Therefore this equation supports the idea that heavy atoms with weak bonds will result in lower frequencies. The combined effect is the main reason why the vibrational modes in GaBr3 are much lower in frequency that those of BH3.
For the first 3 vibrational modes, the trend in GaBr3 is opposite to that of BH3. The first two degrease vibrational modes of GaBr3 starts off with a low frequency(76cm-1) with E' symmetry followed by a higher frequency (100cm-1) vibrational mode with A2' symmetry. The reverse happens for BH3 where the first vibrational mode (1163 cm-1) is A2' symmetry followed by the 2 degenerate vibrational modes with E' symmetry with a higher frequency (1213cm-1). The rest of the vibrational modes follows the same trend with same symmetry labels. The IR spectra of both molecules suppose to have 6 peaks according to the 3N-6 formula but both only have 3 peaks. This is due to degeneracy in frequency and inactive IR vibrational modes. In each case, there are 2 lots of degeneracy + 1 inactive totally symmetric vibrational mode leaving with only 3 peaks that are detectable in the IR spectrum.
It seems that the E' mode and A1' lie close together as well as E' mode lies close to A2' but the latter is higher in energy. A plausible explanation is that the former is bending motion whereas the latter is stretching motion. Stretching motions have a much greater force constant so the movement of the atom is greater and during the vibration, the displacement from equilibrium distant is much larger than the case for bending motions. As a result more energy are required for the latter.
The same basis-set and method are used for each calculation as this ensures that the results obtained from this investigation can be compared. If the basis were not kept constant in each optimisation and frequency analysis, the position of the atoms of the optimised structure will be different so the solution of the Schrodinger equation would give different results meaning that the resulting energy will be different for the same molecule. If this was the case then any comparisons are invalid.
Frequency analysis is highly important as mentioned earlier it differentiates between a maxima or a minima. If the value is positive then it is a minima, and maxima for negative value. It also allow us to investigate many useful information such as the "low frequency" describing the motion at the centre of mass of the molecule as well as visualising the vibrational modes and IR spectrum.
MOs of BH3</sub>
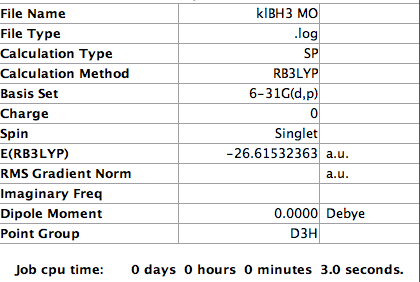
The checkpoint file for this calculation can be found here File:KlBH3 MO.chk
The following parameters were set with the key word "pop=full"
From the diagram above, there is a big difference between real MOs and LCAO MOs. The real MO orbitals are all delocalised around the whole molecule whereas the LCAO MOs are localised only on atoms. Therefore real MOs are much more useful in predicting the electron distribution of BH3. Nonetheless, LCAO can still be used to predict the combination and contribution of the frontier orbitals and any nodal planes can be identified.
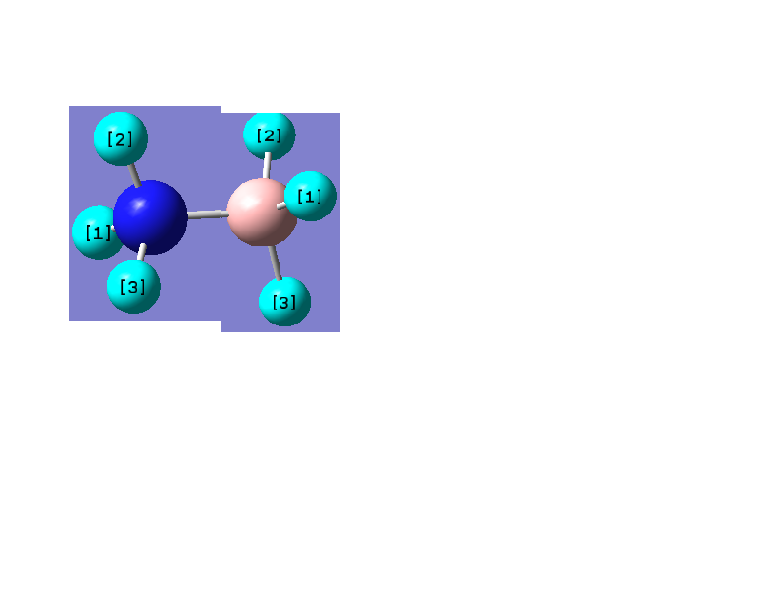
NH3
The log file can be found here File:KlNH3 OPTIMISATION.LOG
       Item               Value     Threshold  Converged?
 Maximum Force            0.000000     0.000002     YES
 RMS     Force            0.000000     0.000001     YES
 Maximum Displacement     0.000001     0.000006     YES
 RMS     Displacement     0.000000     0.000004     YES
 Predicted change in Energy=-1.239175D-13
 Optimization completed.
    -- Stationary point found.
                           ----------------------------
                           !   Optimized Parameters   !
                           ! (Angstroms and Degrees)  !
 --------------------------                            --------------------------
 ! Name  Definition              Value          Derivative Info.                !
 --------------------------------------------------------------------------------
 ! R1    R(1,2)                  1.018          -DE/DX =    0.0                 !
 ! R2    R(1,3)                  1.018          -DE/DX =    0.0                 !
 ! R3    R(1,4)                  1.018          -DE/DX =    0.0                 !
 ! A1    A(2,1,3)              105.7444         -DE/DX =    0.0                 !
 ! A2    A(2,1,4)              105.7444         -DE/DX =    0.0                 !
 ! A3    A(3,1,4)              105.7444         -DE/DX =    0.0                 !
 ! D1    D(2,1,4,3)           -111.8634         -DE/DX =    0.0                 !
 --------------------------------------------------------------------------------
 GradGradGradGradGradGradGradGradGradGradGradGradGradGradGradGradGradGrad
The following data were obtained
| Bond | Length (Å) | Angle type | Angle | |
|---|---|---|---|---|
| N - H1 | 1.02 | H1 - N - H2 | 105.7 | |
| N - H2 | 1.02 | H1 - N - H3 | 105.7 | |
| N - H3 | 1.02 | H2 - N - H3 | 105.7 |
Frequency Analysis of NH3
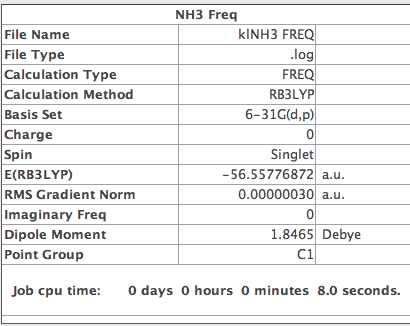
The log file for this calculation can be found here File:KlNH3 FREQ.LOG
Low frequencies ---   -8   -6   -4   0   0   0
Low frequencies --- 1089 1694 1694
The six frequencies are within the range of -15-15 cm1 and there are some negative frequencies with a very small magnitude but this is fine for the poor model we are using, the calculation would take much longer if we aim for perfect result. There is enough evidence to conclude that the molecule is at a minimum point on the potential surface. The energy remains the same during the frequency analysis calculation so the structure of the molecule remains constant.
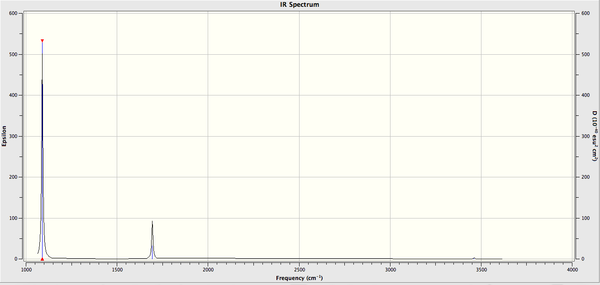
There are 3N-6 vibrational modes (6) but there are only 2 peaks in the IR spectrum. This is because some of these modes are degenerate in frequency even though their mode of vibration is different. Therefore these peaks are superimposed in the spectrum. The 4th vibrational mode is IR inactive because this vibrational mode is totally symmetric. The intensity of the 5th and 6th vibrational mode is too low to be detected in the spectrum. As a result we only expect to see the peak at 1089 and 1694 cm-1 and these are the 2 peaks present in the spectrum.
Molecular Orbitals of NH3
| no. | MO | no. | MO |
|---|---|---|---|
| 1 |  |
5 | 
|
| 2 |  |
6 | 
|
| 3 |  |
7 | 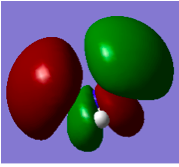
|
| 4 | 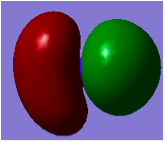 |
8 | 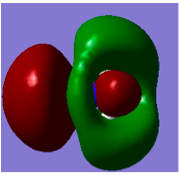
|
NBO Analysis
The log file for this calculation can be found here File:KlNH3 NBO.LOG
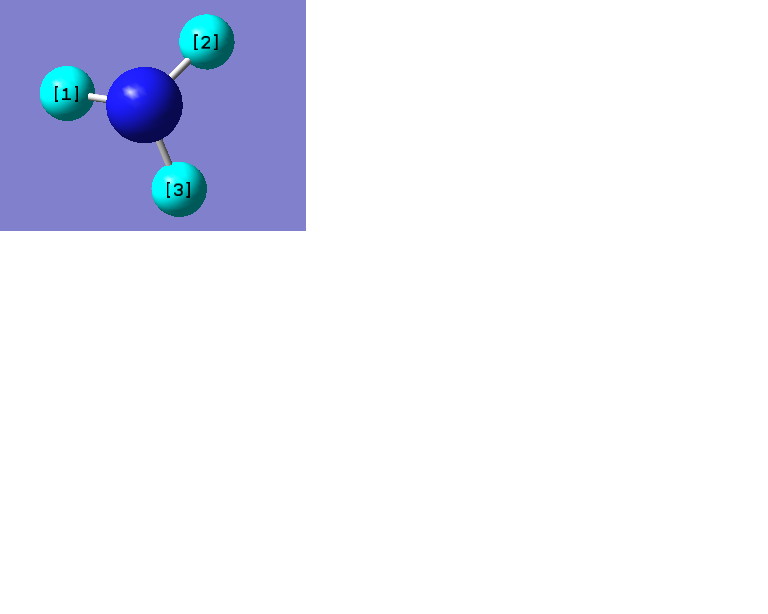
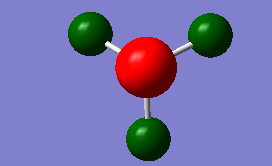
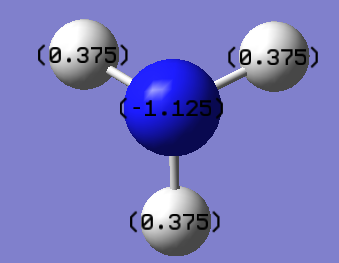
The Charge distribution is shown below
The charge range was set as as follow
The exact charge number is shown below
Ammonia Borane
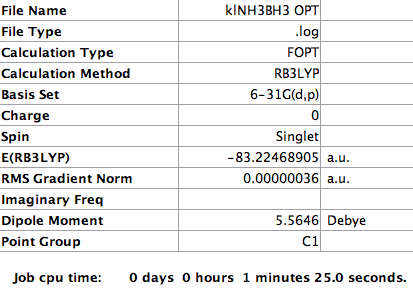
The log file for this calculation can be found here File:KlNH3BH3 OPT.LOG
 Item               Value     Threshold  Converged?
 Maximum Force            0.000001     0.000002     YES
 RMS     Force            0.000000     0.000001     YES
 Maximum Displacement     0.000003     0.000006     YES
 RMS     Displacement     0.000001     0.000004     YES
 Predicted change in Energy=-2.333779D-12
 Optimization completed.
    -- Stationary point found.
                           ----------------------------
                           !   Optimized Parameters   !
                           ! (Angstroms and Degrees)  !
 --------------------------                            --------------------------
 ! Name  Definition              Value          Derivative Info.                !
 --------------------------------------------------------------------------------
 ! R1    R(1,7)                  1.0185         -DE/DX =    0.0                 !
 ! R2    R(2,7)                  1.0185         -DE/DX =    0.0                 !
 ! R3    R(3,7)                  1.0185         -DE/DX =    0.0                 !
 ! R4    R(4,8)                  1.2098         -DE/DX =    0.0                 !
 ! R5    R(5,8)                  1.2098         -DE/DX =    0.0                 !
 ! R6    R(6,8)                  1.2098         -DE/DX =    0.0                 !
 ! R7    R(7,8)                  1.6677         -DE/DX =    0.0                 !
 ! A1    A(1,7,2)              107.8759         -DE/DX =    0.0                 !
 ! A2    A(1,7,3)              107.8759         -DE/DX =    0.0                 !
 ! A3    A(1,7,8)              111.0229         -DE/DX =    0.0                 !
 ! A4    A(2,7,3)              107.8759         -DE/DX =    0.0                 !
 ! A5    A(2,7,8)              111.023          -DE/DX =    0.0                 !
 ! A6    A(3,7,8)              111.0229         -DE/DX =    0.0                 !
 ! A7    A(4,8,5)              113.8739         -DE/DX =    0.0                 !
 ! A8    A(4,8,6)              113.8738         -DE/DX =    0.0                 !
 ! A9    A(4,8,7)              104.5974         -DE/DX =    0.0                 !
 ! A10   A(5,8,6)              113.8739         -DE/DX =    0.0                 !
 ! A11   A(5,8,7)              104.5974         -DE/DX =    0.0                 !
 ! A12   A(6,8,7)              104.5974         -DE/DX =    0.0                 !
 ! D1    D(1,7,8,4)           -180.0            -DE/DX =    0.0                 !
 ! D2    D(1,7,8,5)            -60.0            -DE/DX =    0.0                 !
 ! D3    D(1,7,8,6)             60.0            -DE/DX =    0.0                 !
 ! D4    D(2,7,8,4)            -60.0            -DE/DX =    0.0                 !
 ! D5    D(2,7,8,5)             60.0            -DE/DX =    0.0                 !
 ! D6    D(2,7,8,6)           -180.0            -DE/DX =    0.0                 !
 ! D7    D(3,7,8,4)             60.0            -DE/DX =    0.0                 !
 ! D8    D(3,7,8,5)           -180.0            -DE/DX =    0.0                 !
 ! D9    D(3,7,8,6)            -59.9999         -DE/DX =    0.0                 !
 --------------------------------------------------------------------------------
 GradGradGradGradGradGradGradGradGradGradGradGradGradGradGradGradGradGrad
The following data were obtained
| Bond | Length (Å) | Angle type | Angle |
|---|---|---|---|
| N - H1 | 1.02 | H1 - N - H2 | 107.9 |
| N - H2 | 1.02 | H1 - N - H3 | 107.9 |
| N - H3 | 1.02 | H2 - N - H3 | 107.9 |
| B - H1 | 1.21 | H1 - B - H2 | 113.9 |
| B - H2 | 1.21 | H1 - B - H3 | 113.9 |
| B - H3 | 1.21 | H2 - B - H3 | 113.9 |
Frequency Analysis of NH3
Frequency Analysis
The log file for this calculation can be found here File:KlNH3BH3 FREQ.LOG
 Low frequencies ---   -3   0    0   0   3    5
 Low frequencies ---  263 633  638
The six frequencies are within the range of -15-15 cm1 and there are some negative frequencies with a very small magnitude but this is fine for the poor model we are using, the calculation would take much longer if we aim for perfect result. There is enough evidence to conclude that the molecule is at a minimum point on the potential surface. The energy remains the same during the frequency analysis calculation so the structure of the molecule remains constant.
Association energy for ammonia borane
Ammonia borane is formed from the following reaction : BH3 + NH3 -> NH3BH3
The energy of each of the molecules were as follow: E(BH3) = -26.61532360 , E(NH3) = -56.55776872 a.u. , NH3BH3=-83.22468910 a.u.
The energy change of the reaction is given by -83.22468910 a.u. - (-56.55776872 a.u. + -26.61532360 a.u.) = -0.05159678 a.u. = 135.47 kJ/mol
Therefore the dissociation energy of BH3 is 135.47 kJ/mol
Mini Project
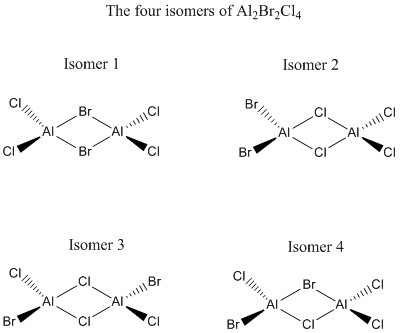
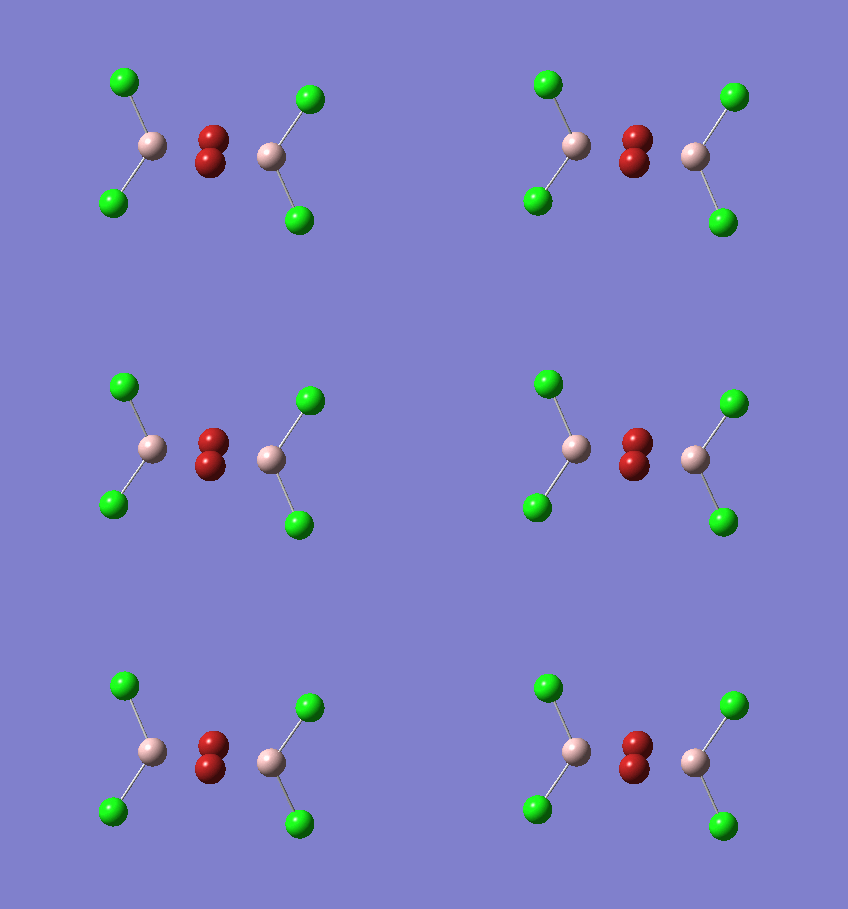
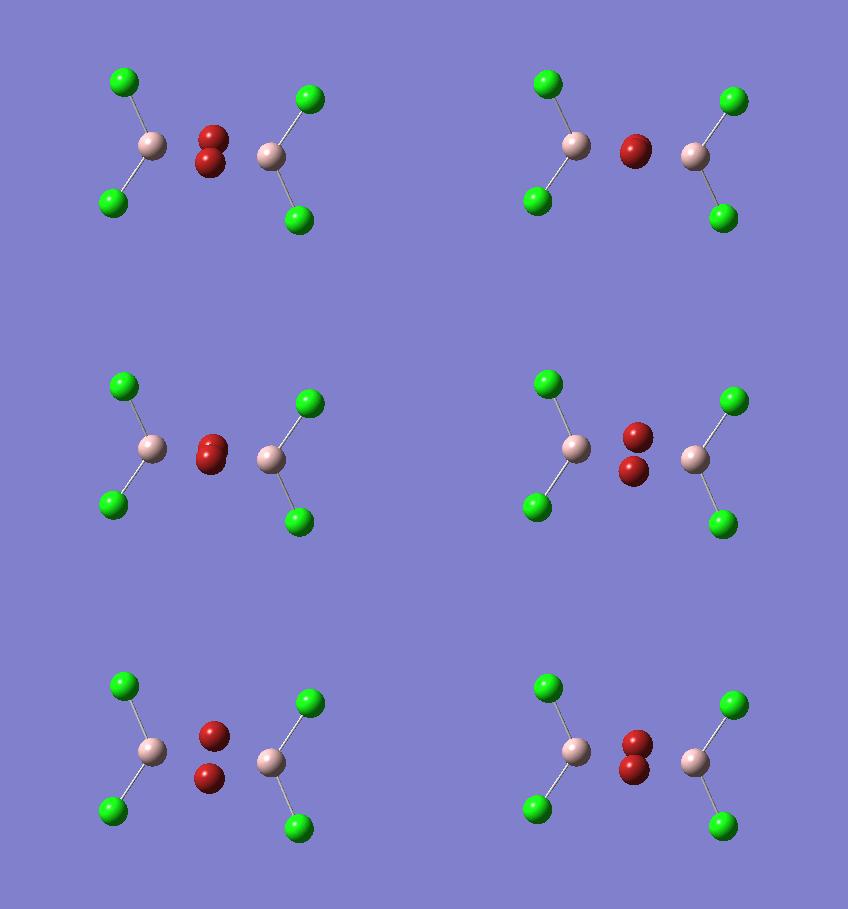
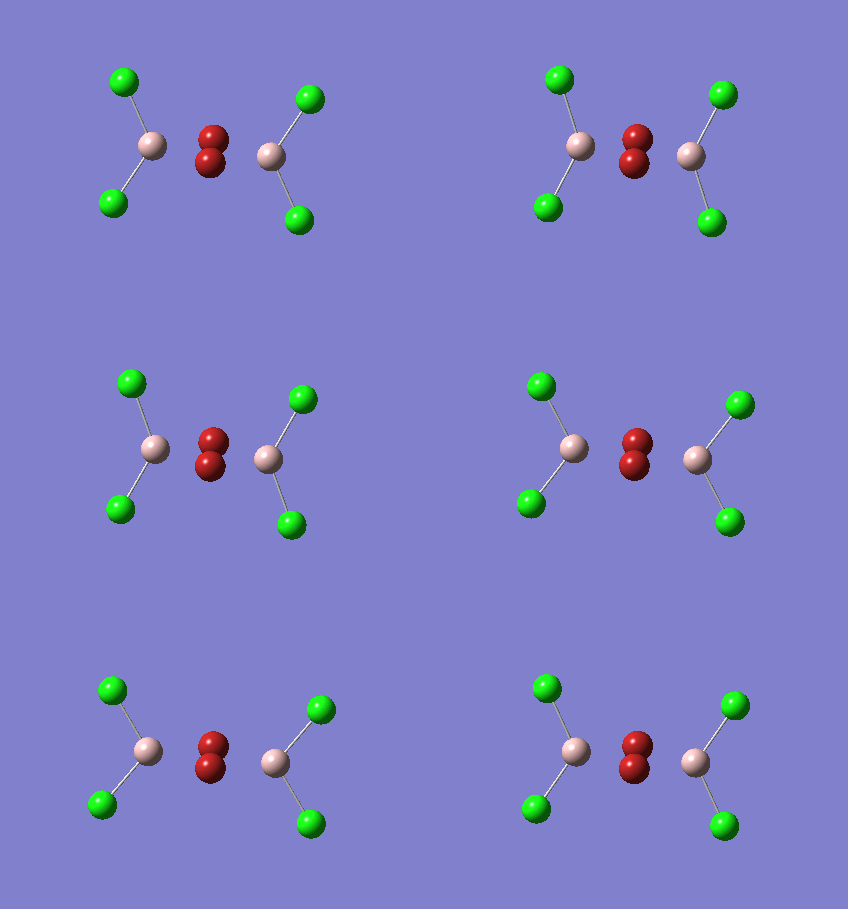
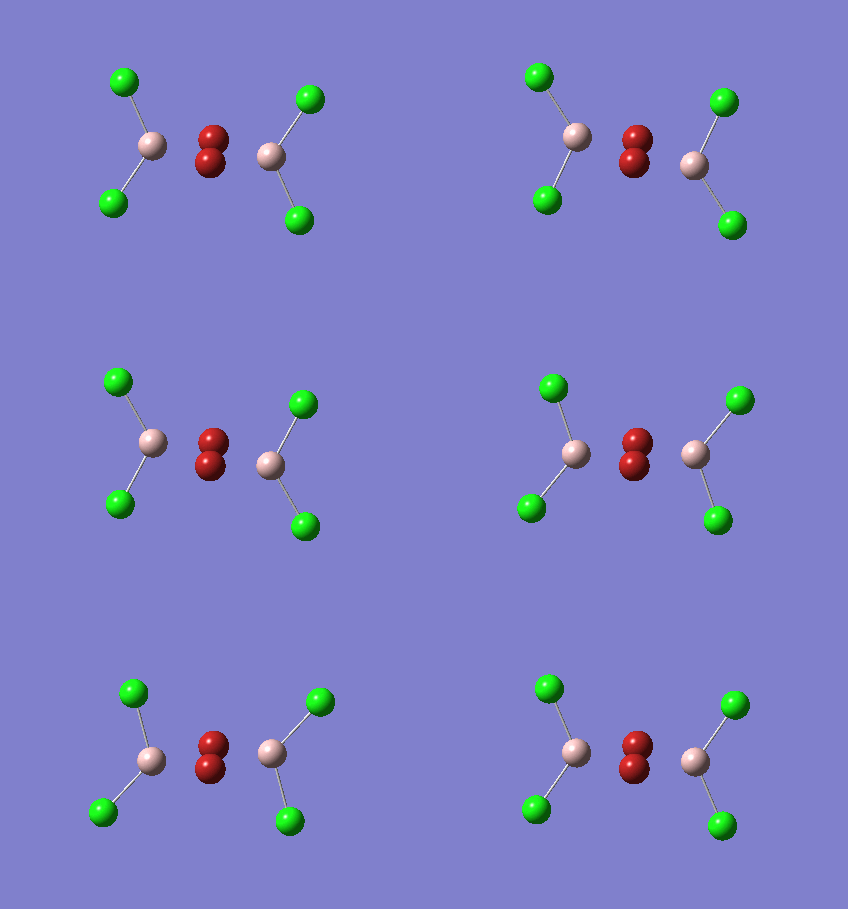
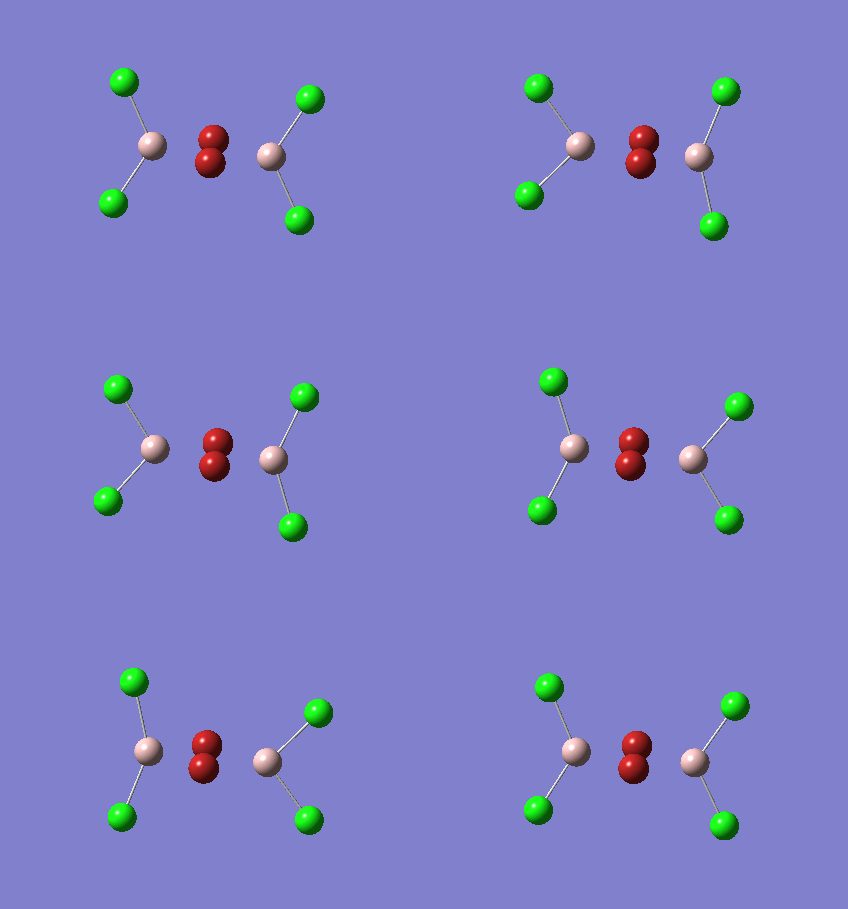
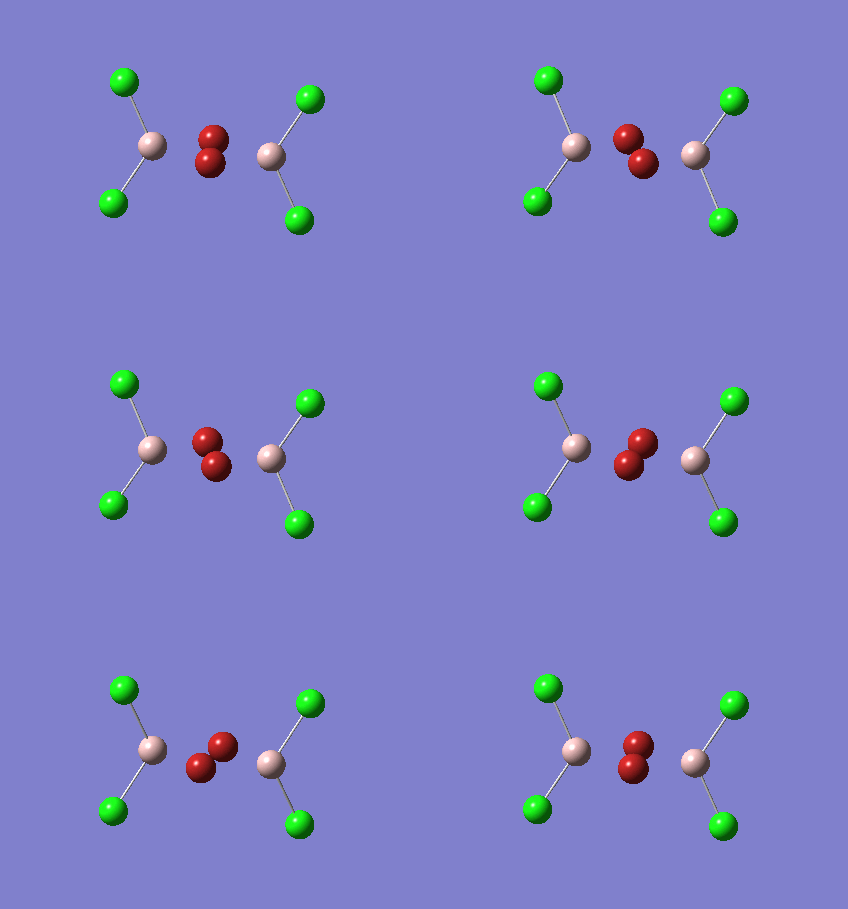
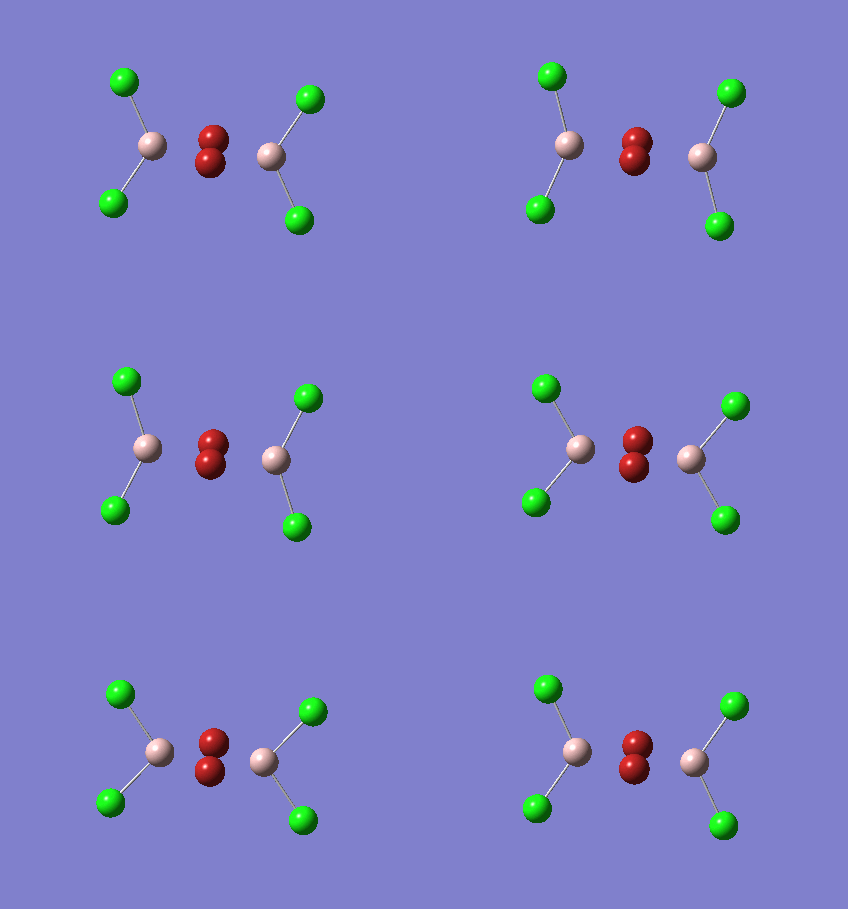
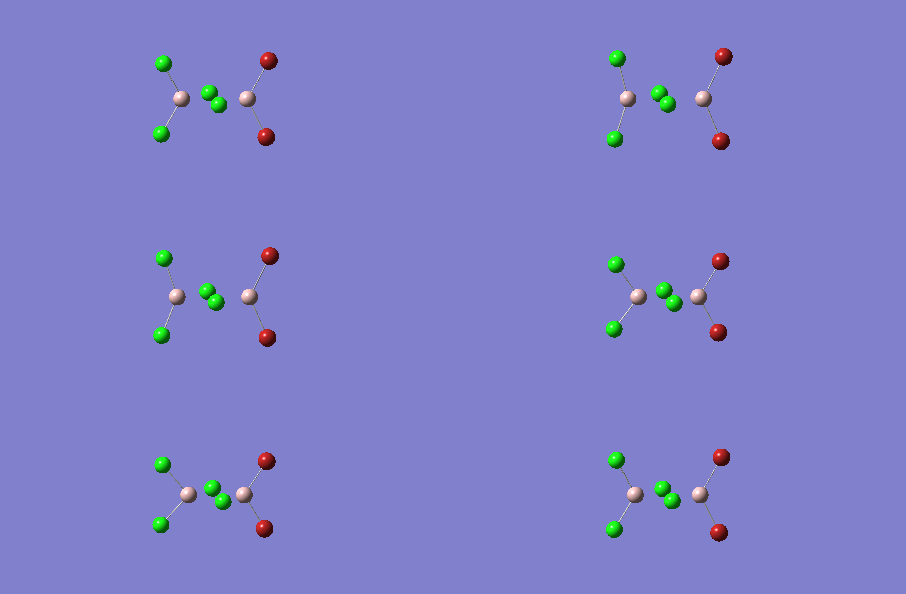
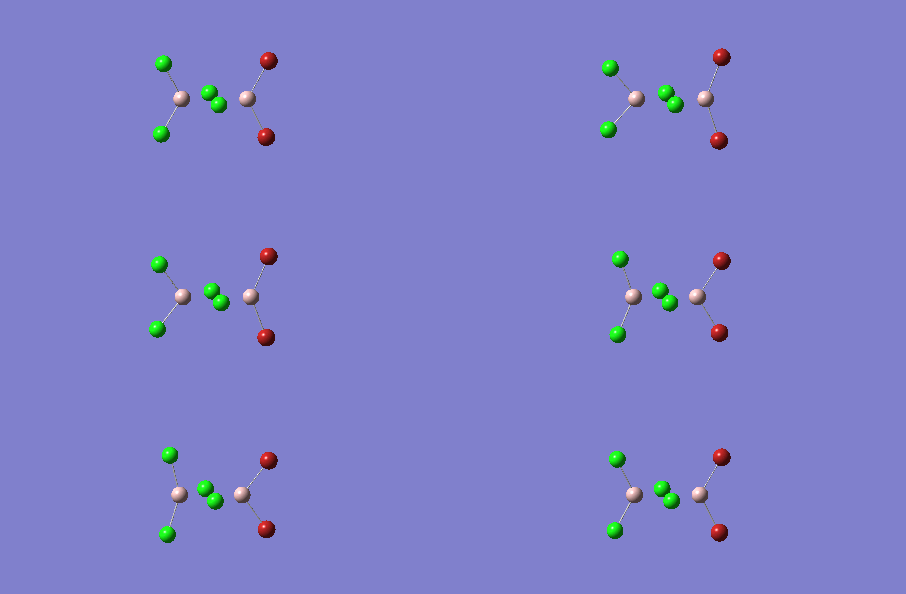
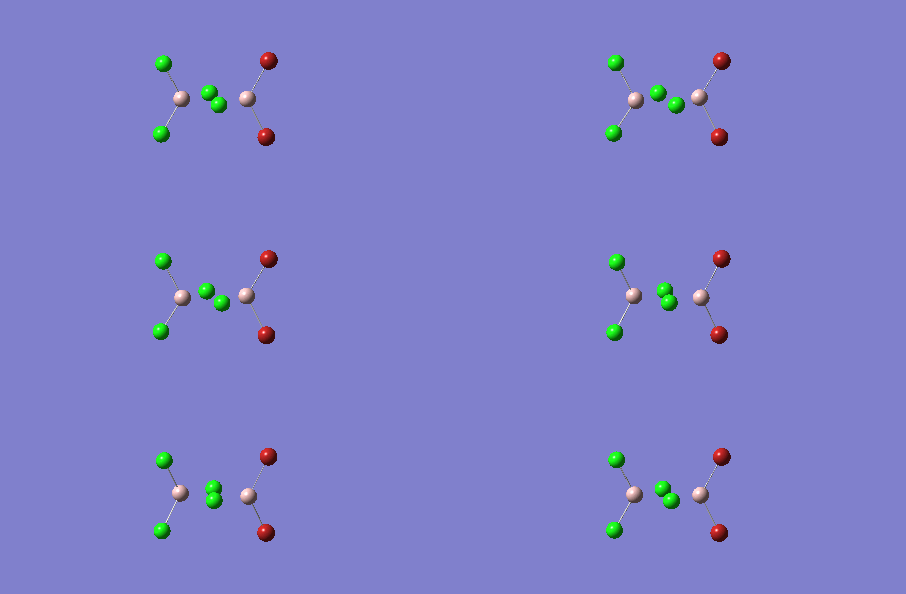
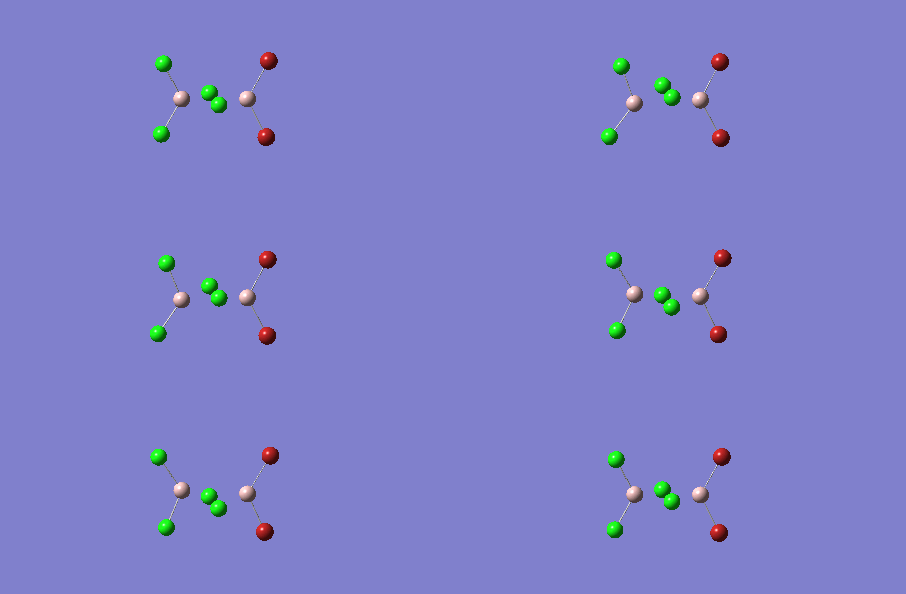
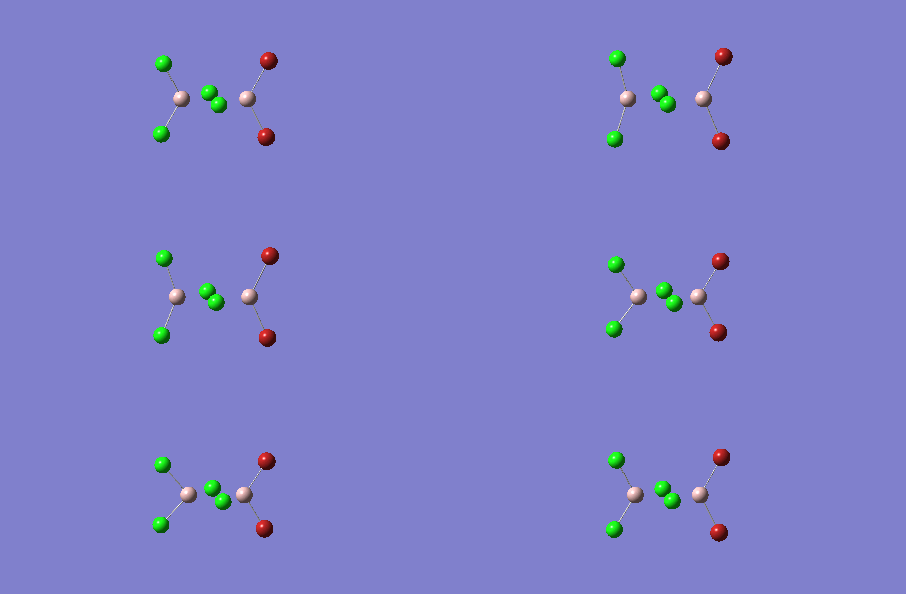
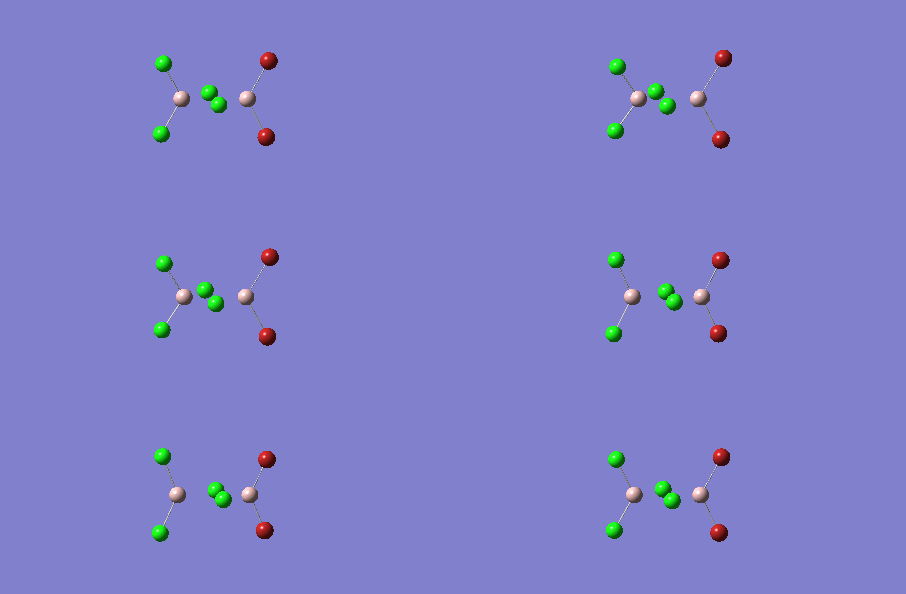
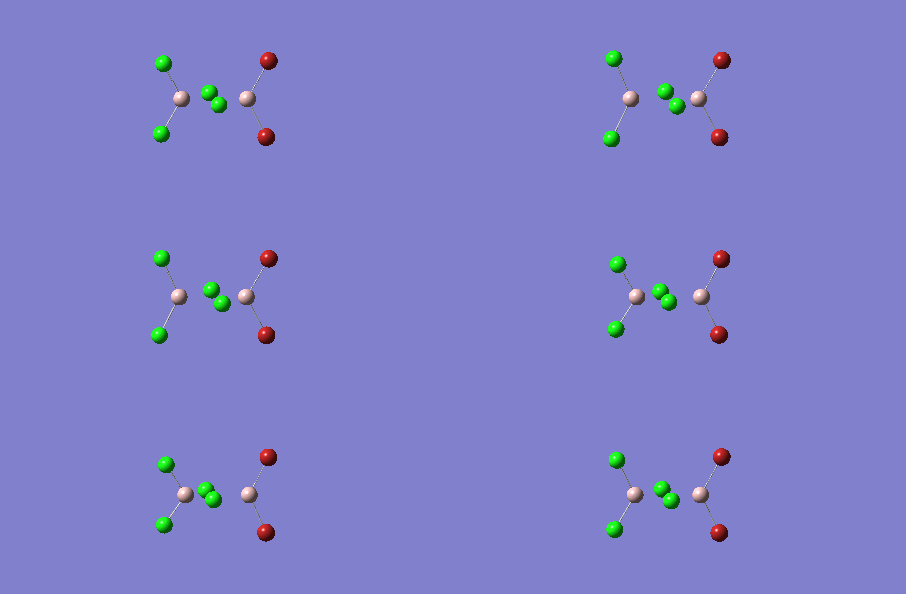
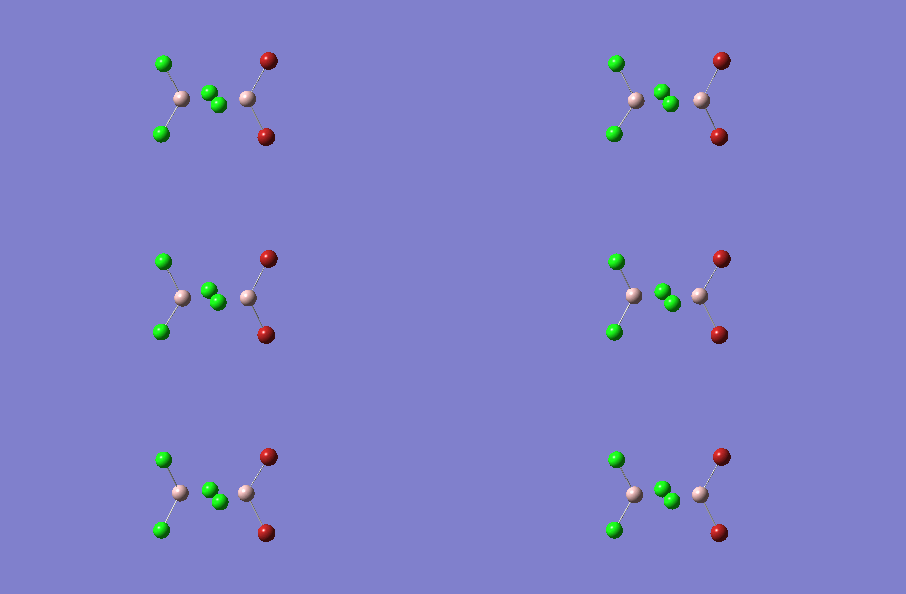
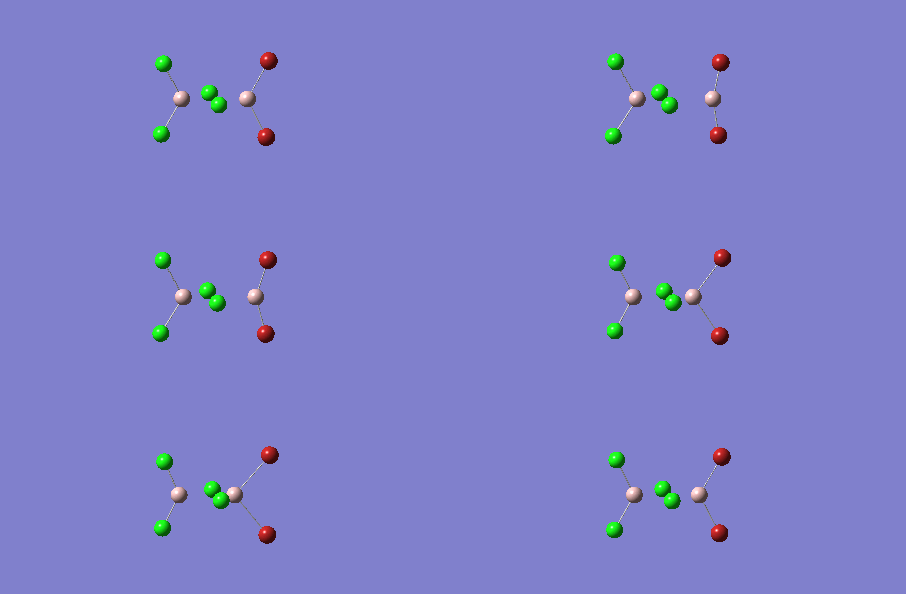
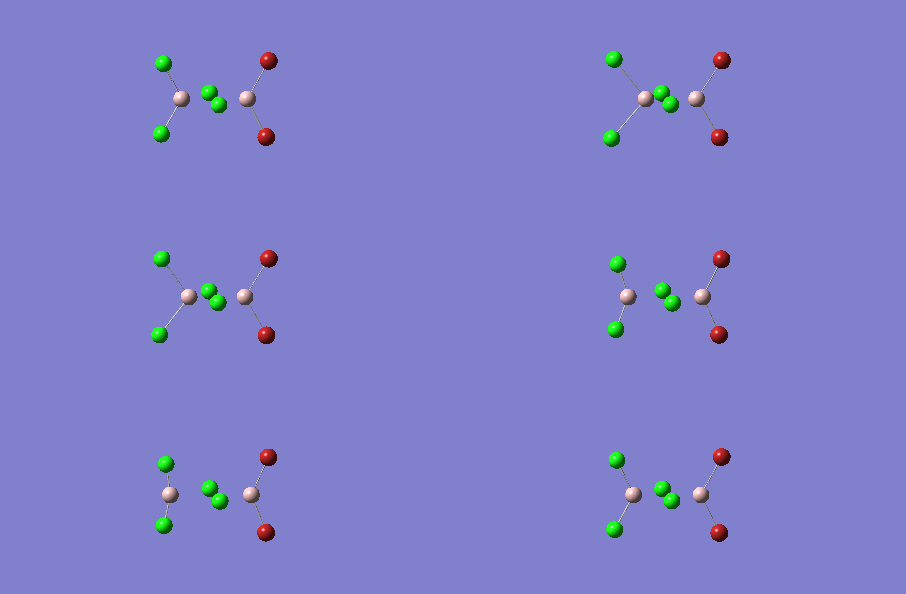
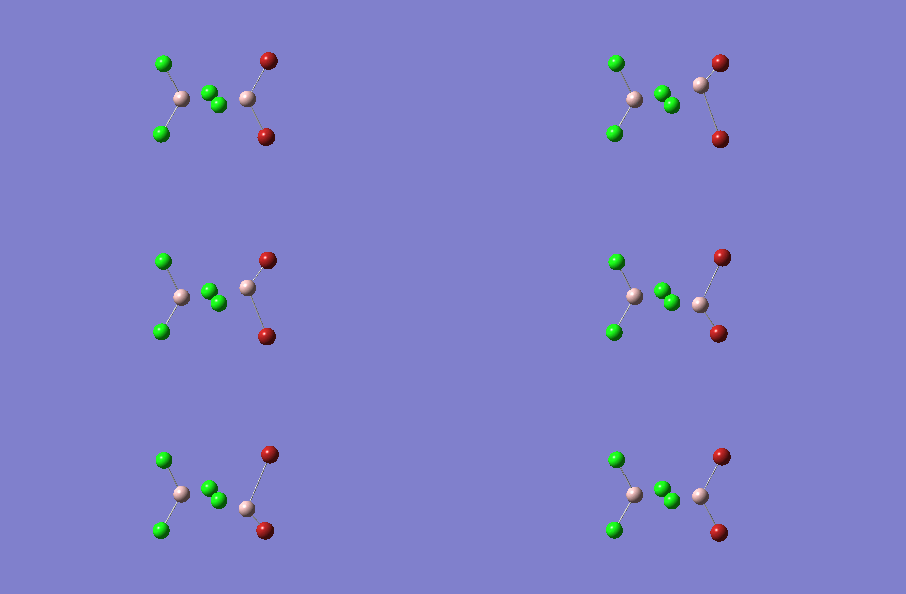
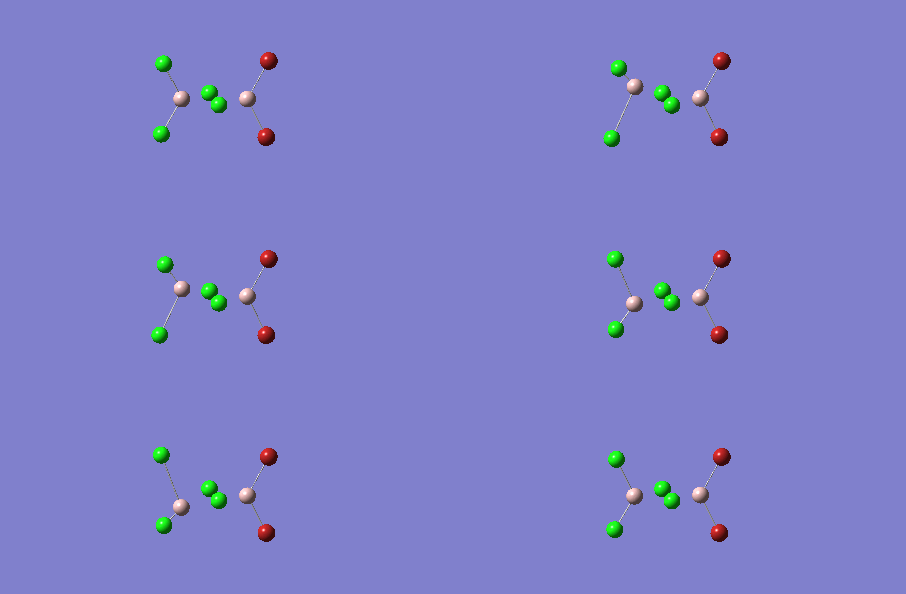
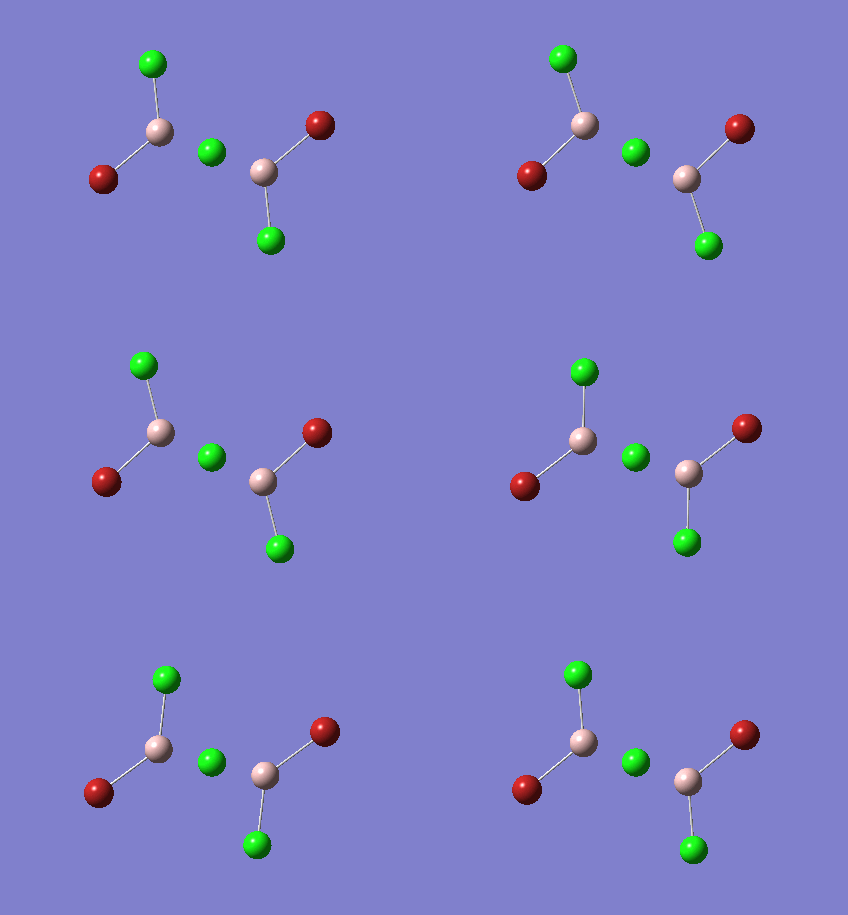
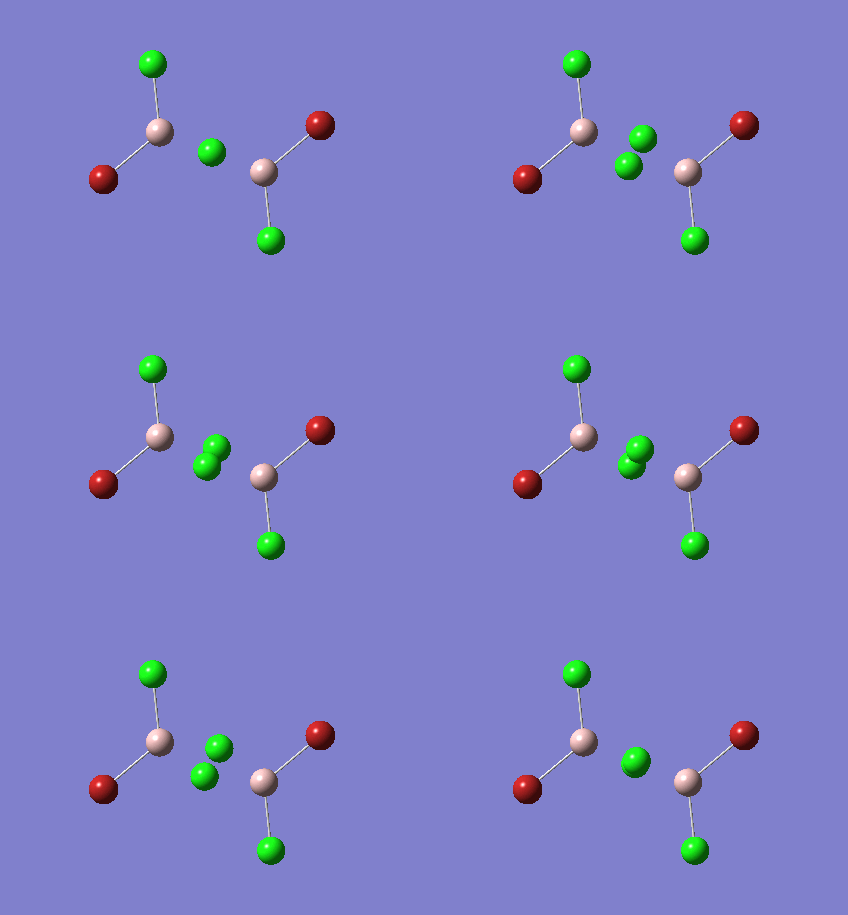
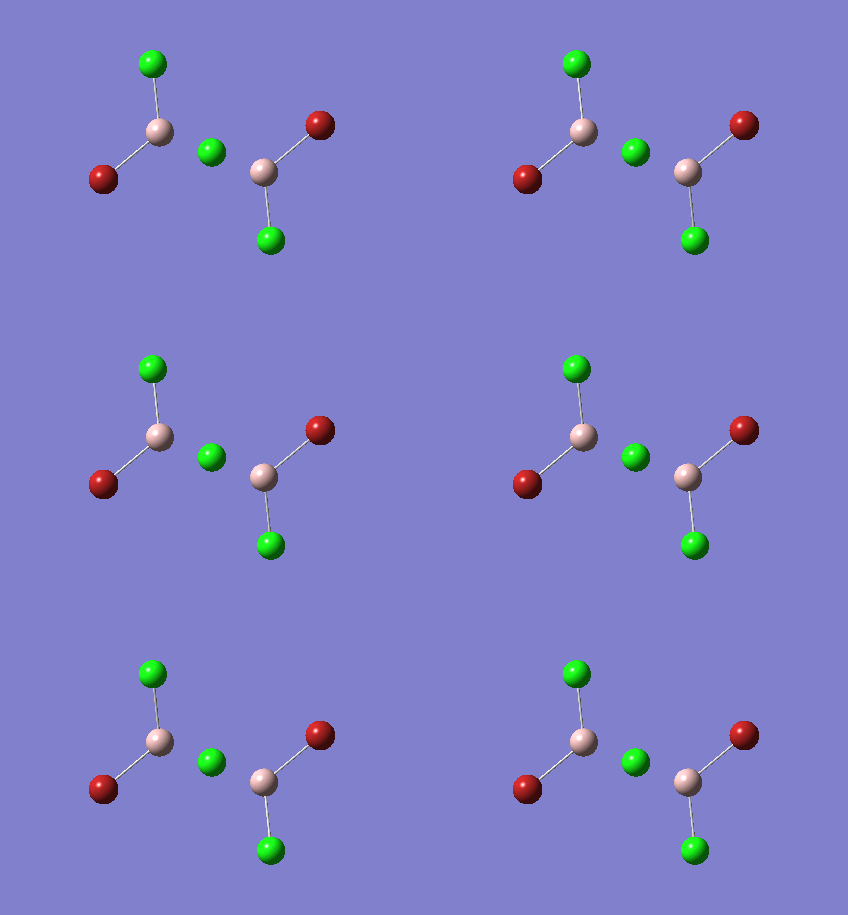
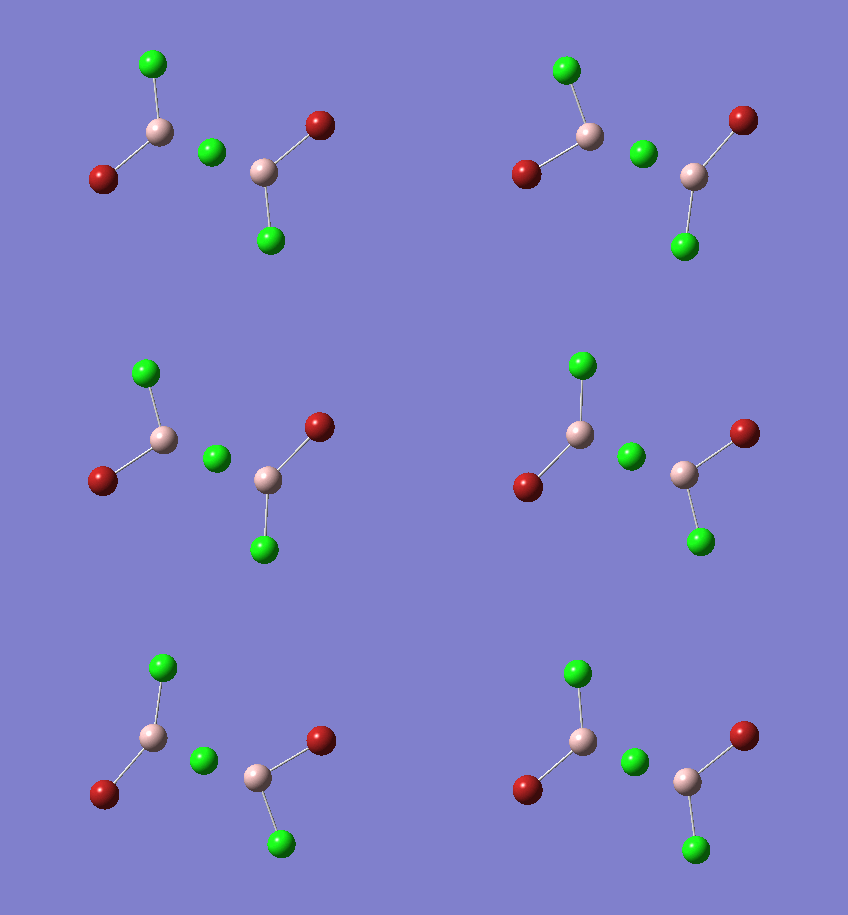
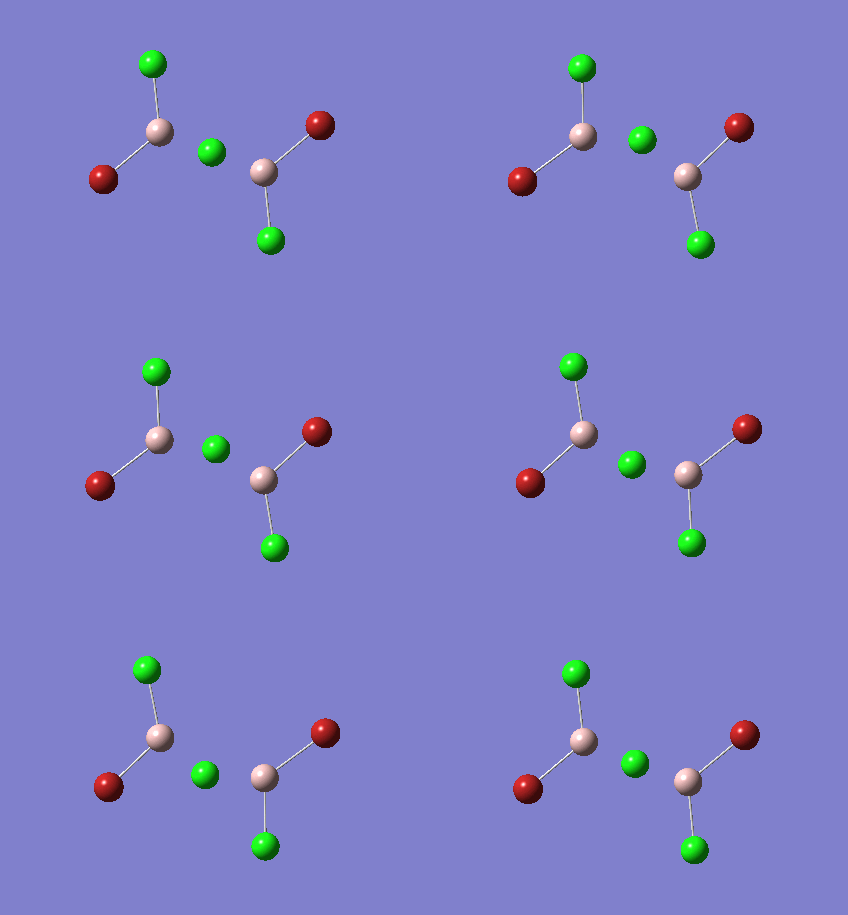
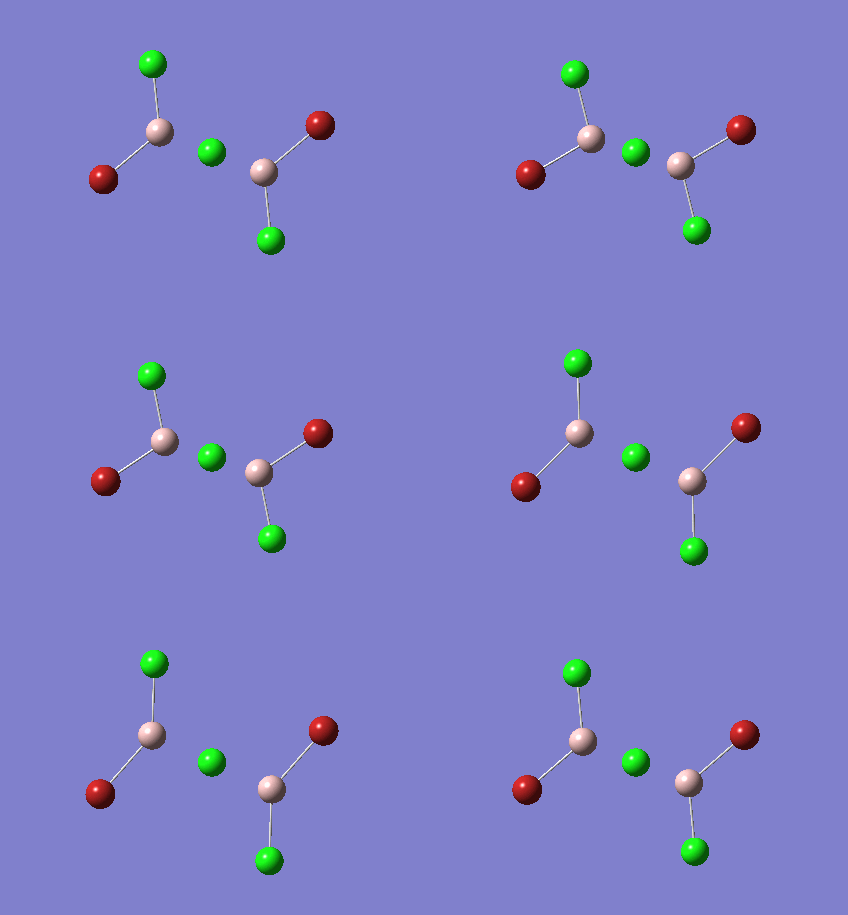
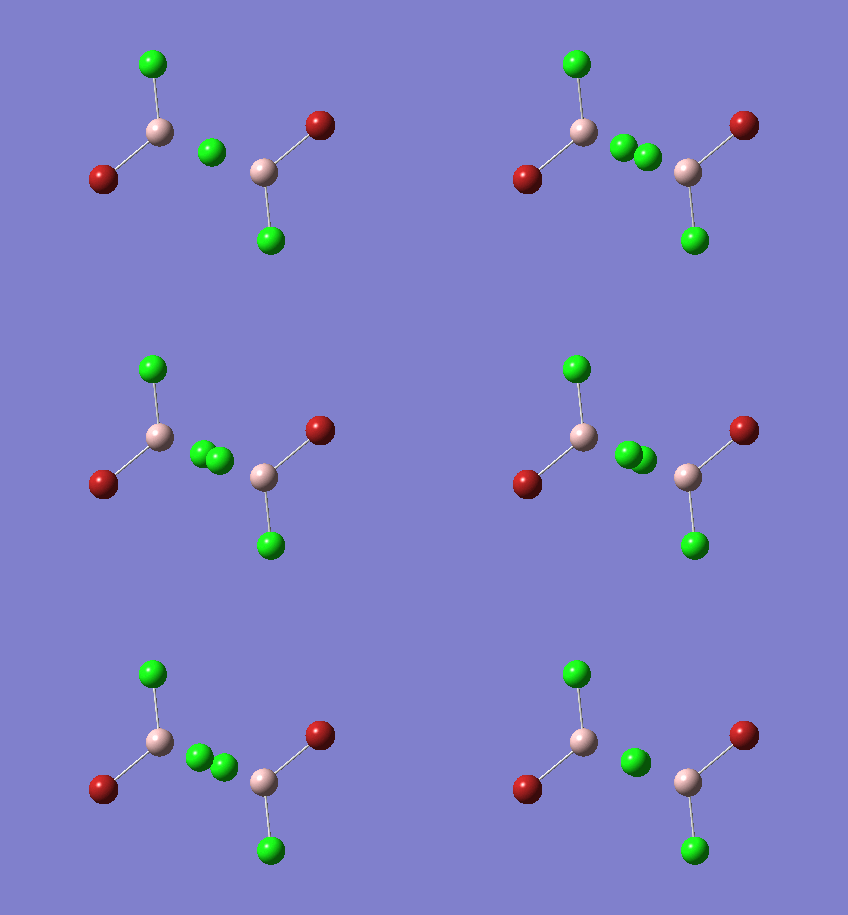
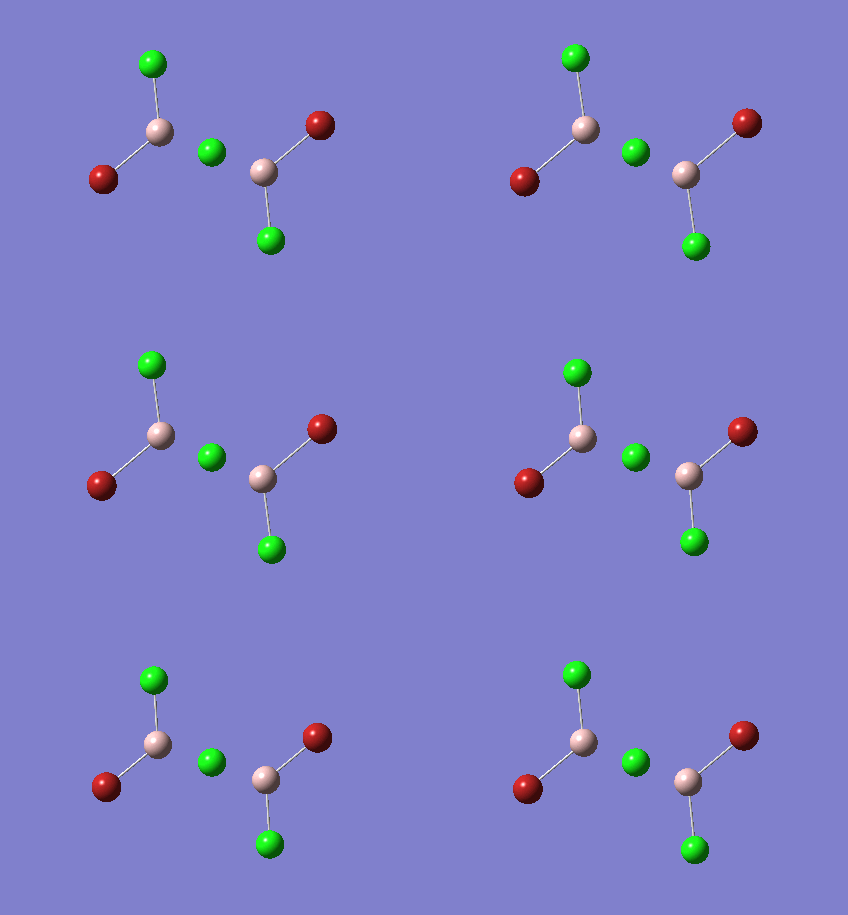
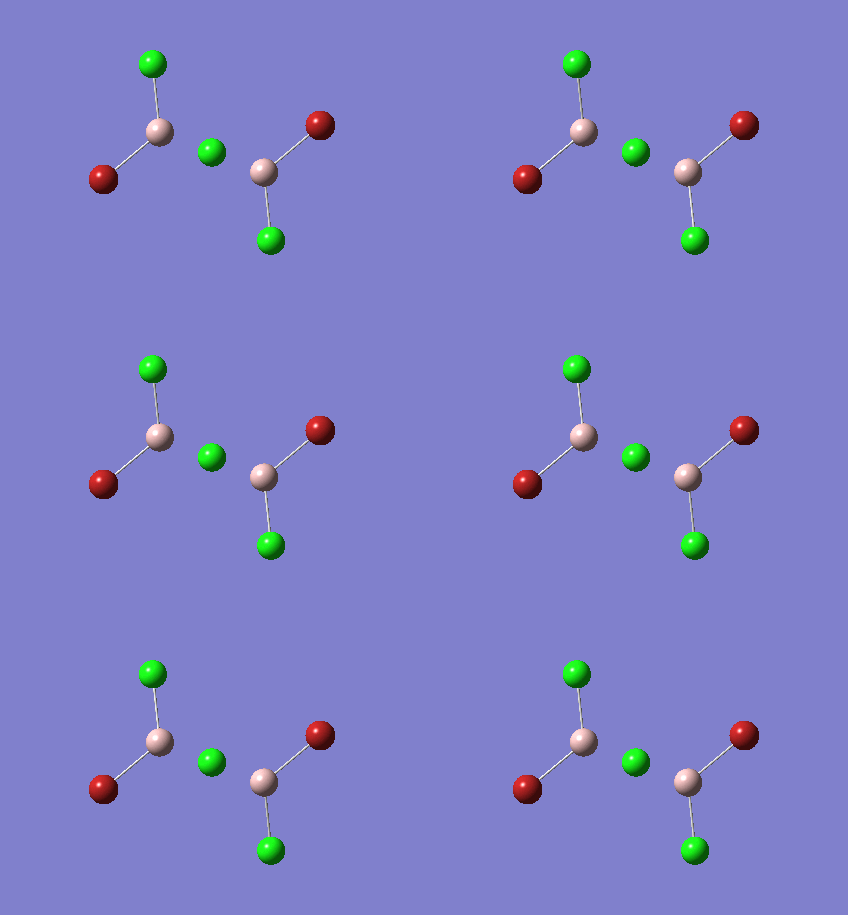
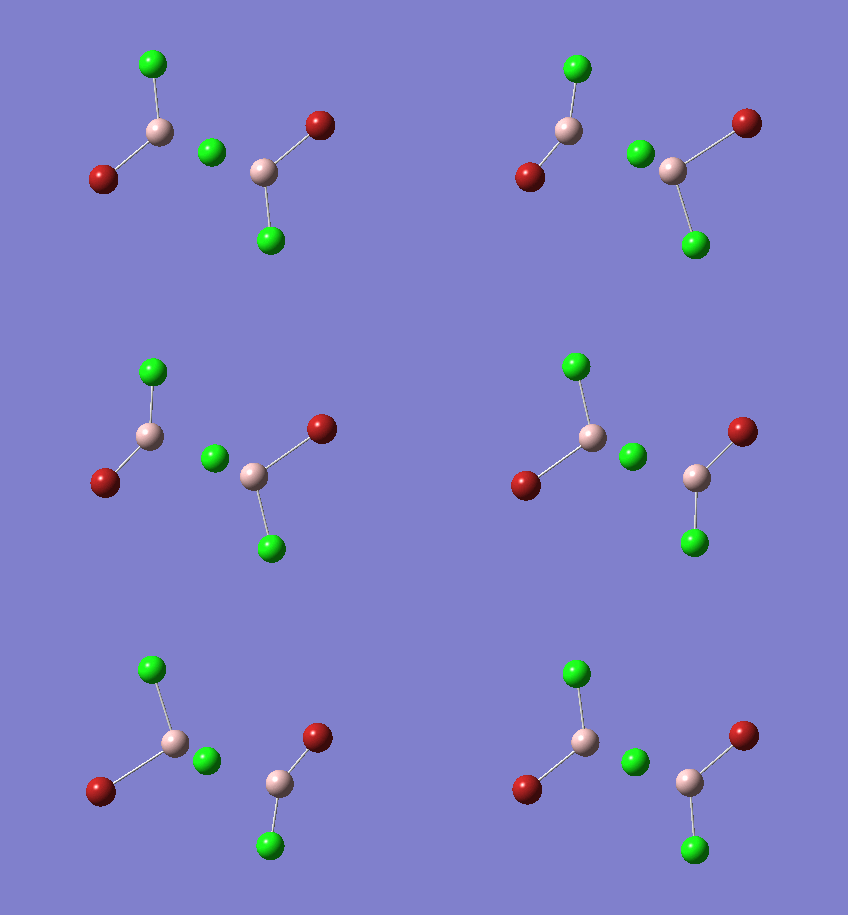
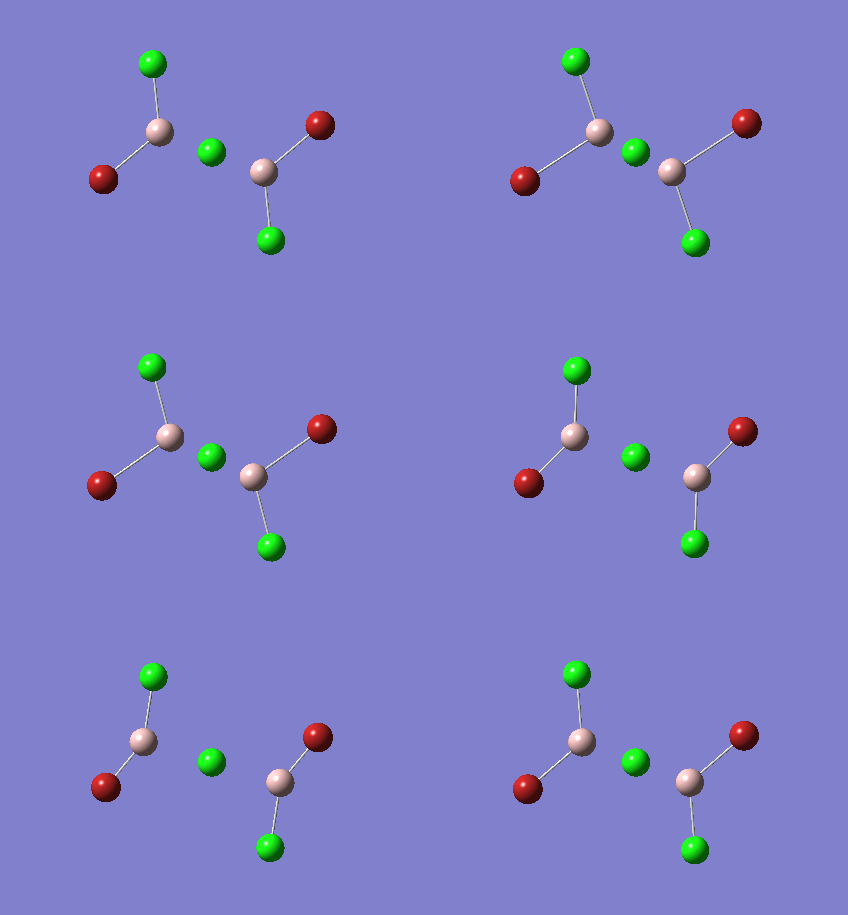
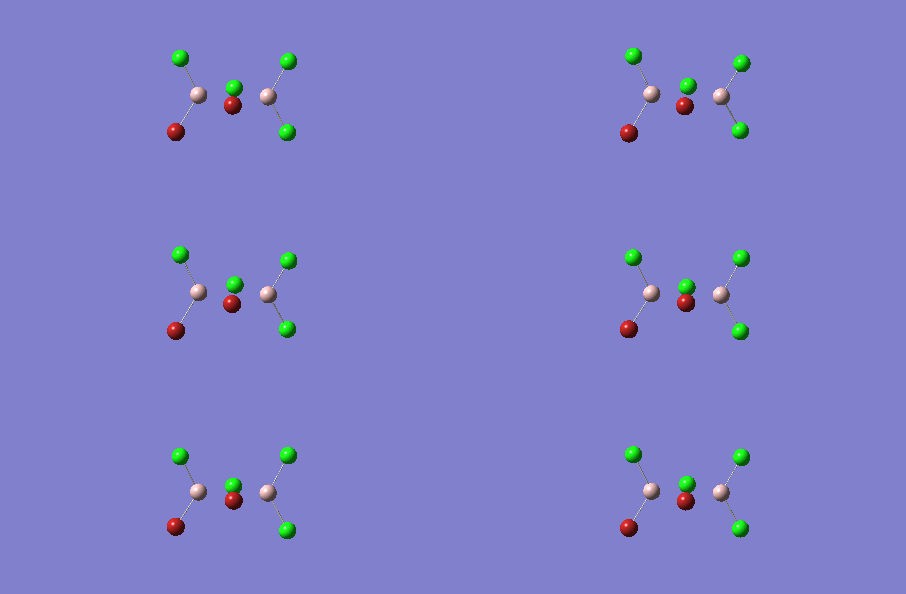
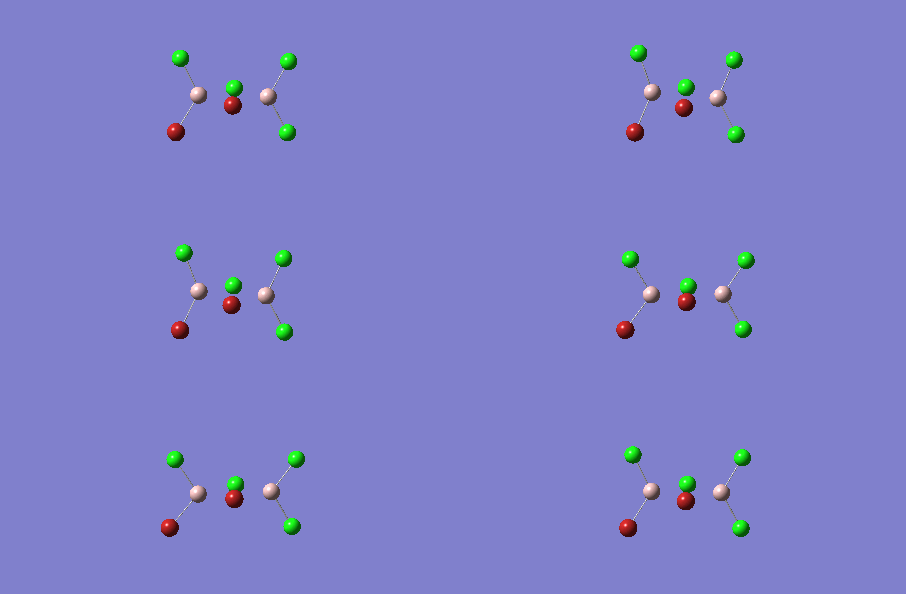
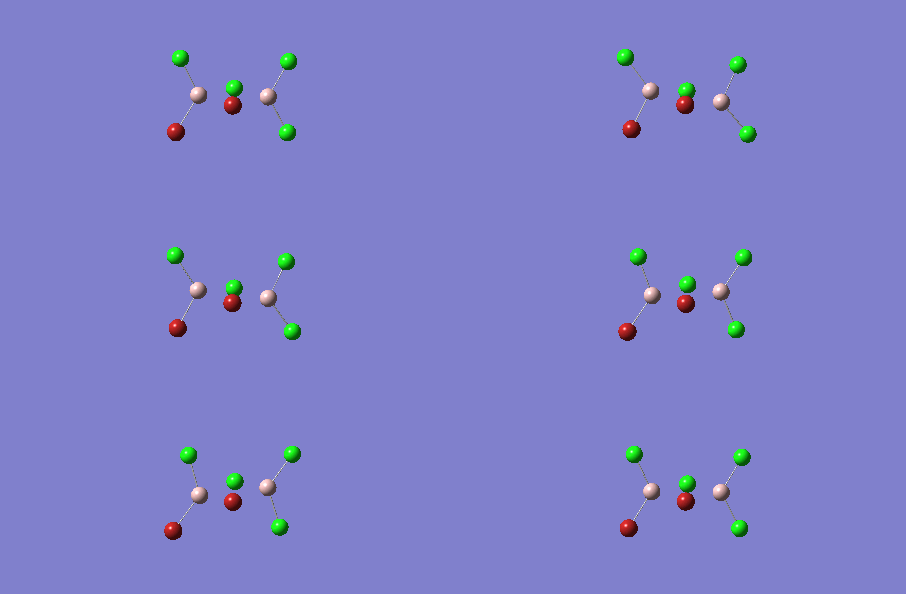
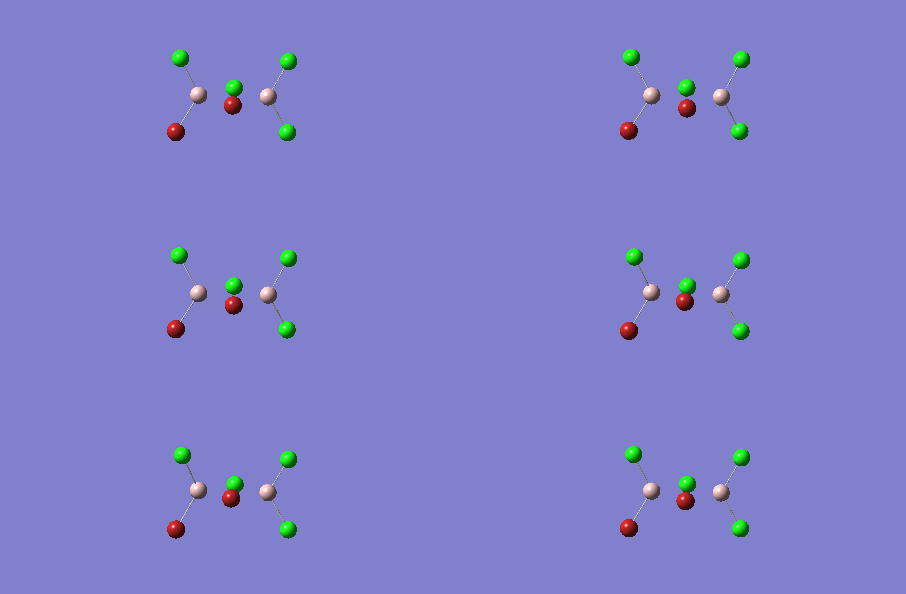
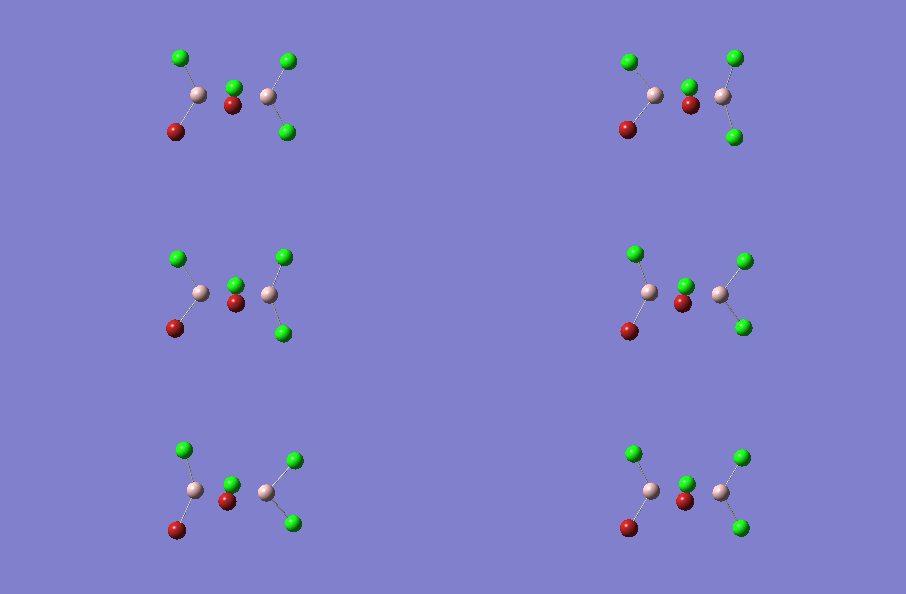
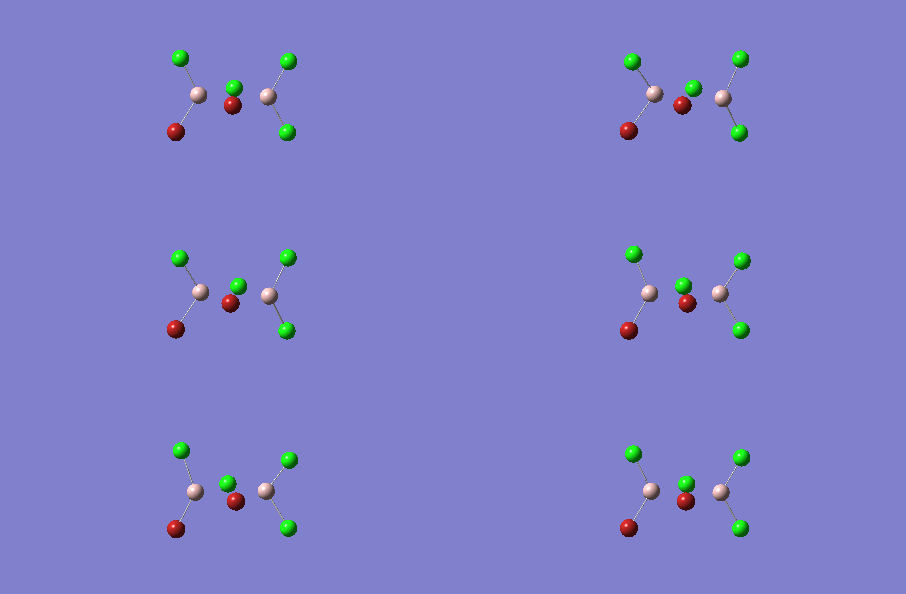
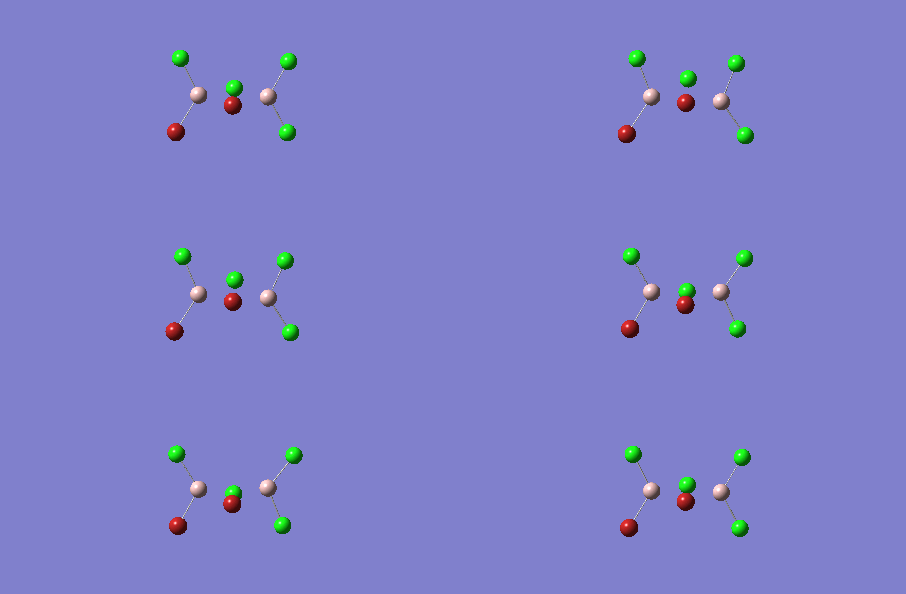
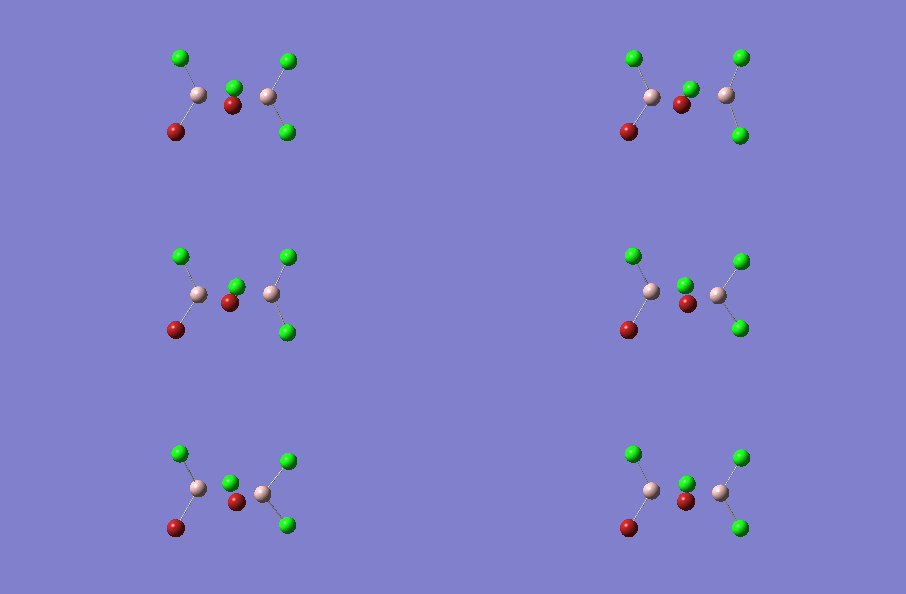
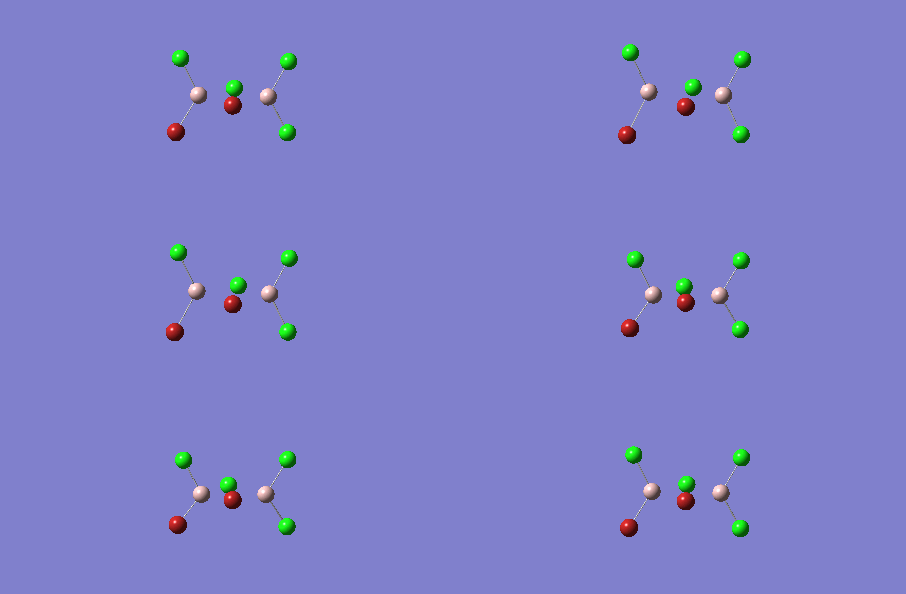
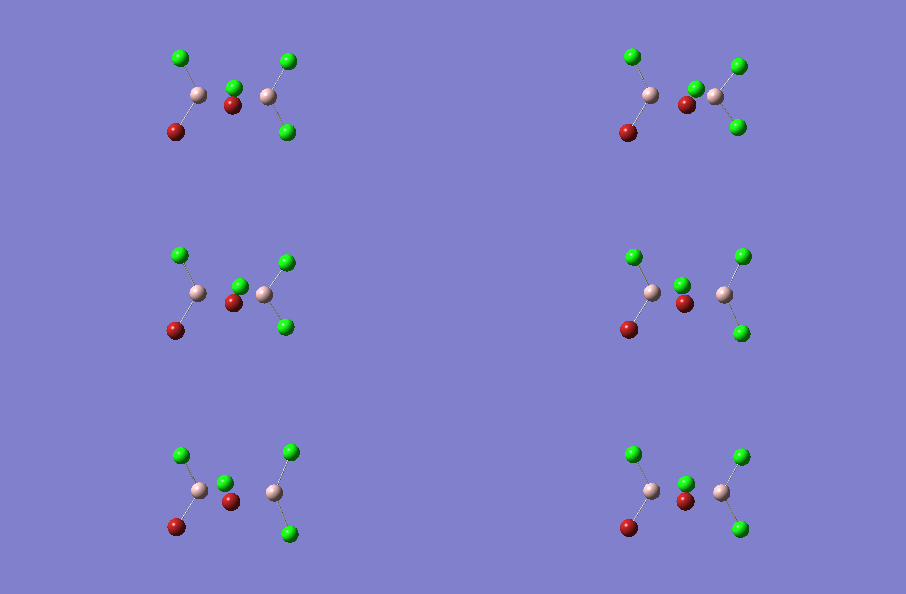
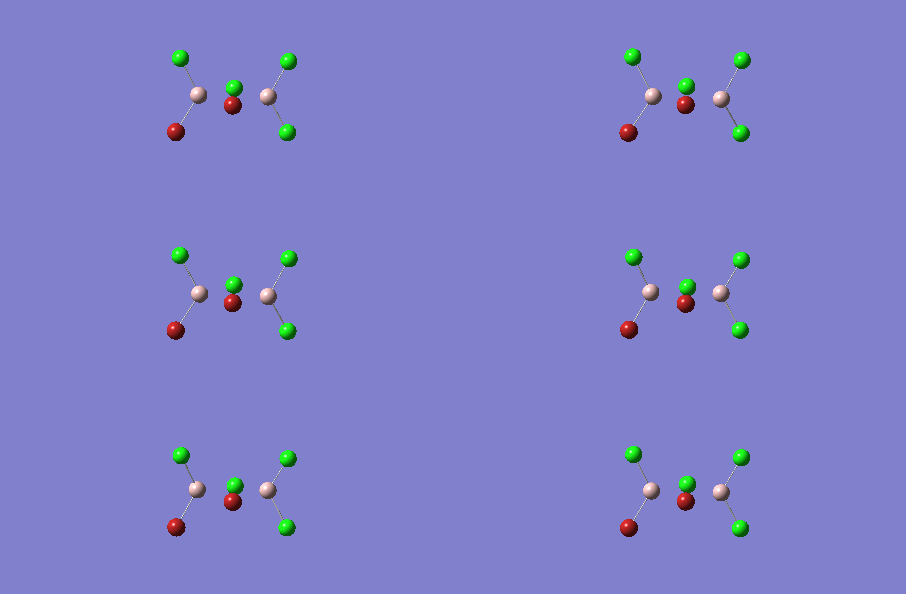
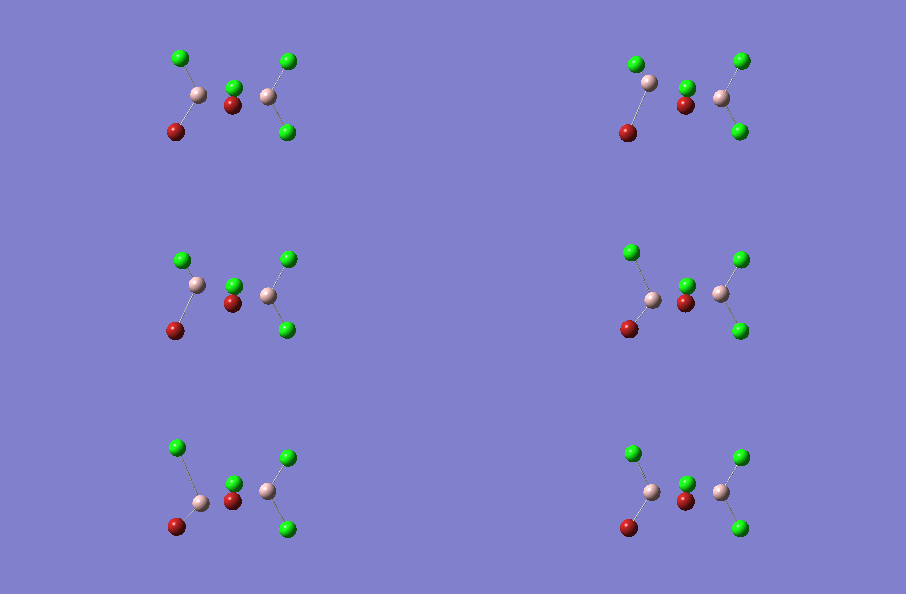
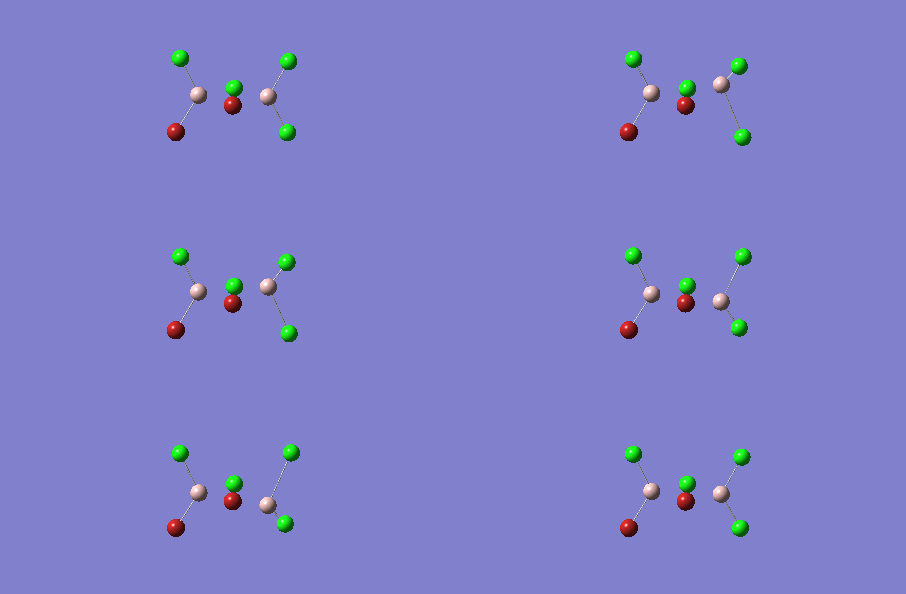
Al2Cl4Br2 is a lewis acid and consist of four isomers. The relative stability, frequency and MO will be investigated in this project. Since all the atoms in Al2Cl4Br2 are heavy, most of the calculation employs the pseudo-potential LanL2DZ.
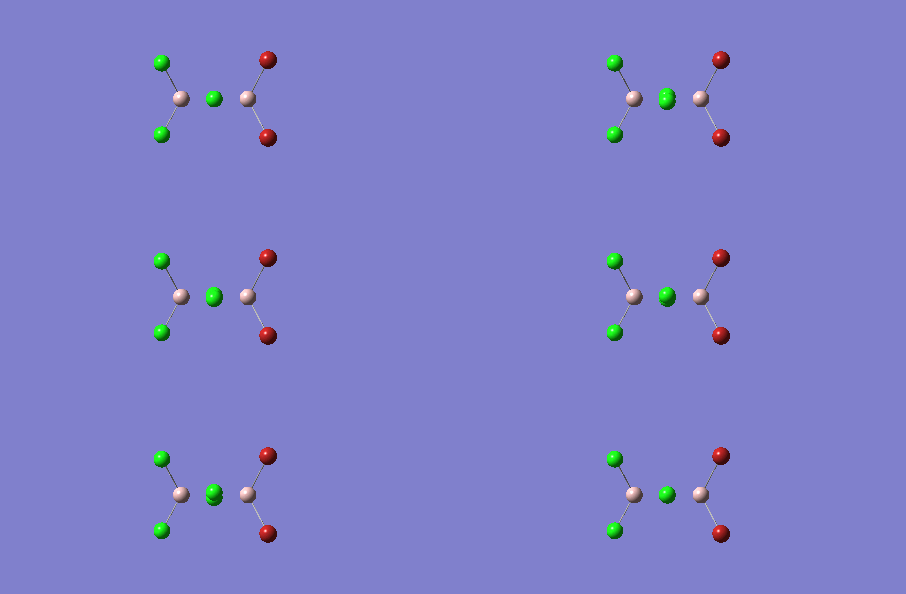
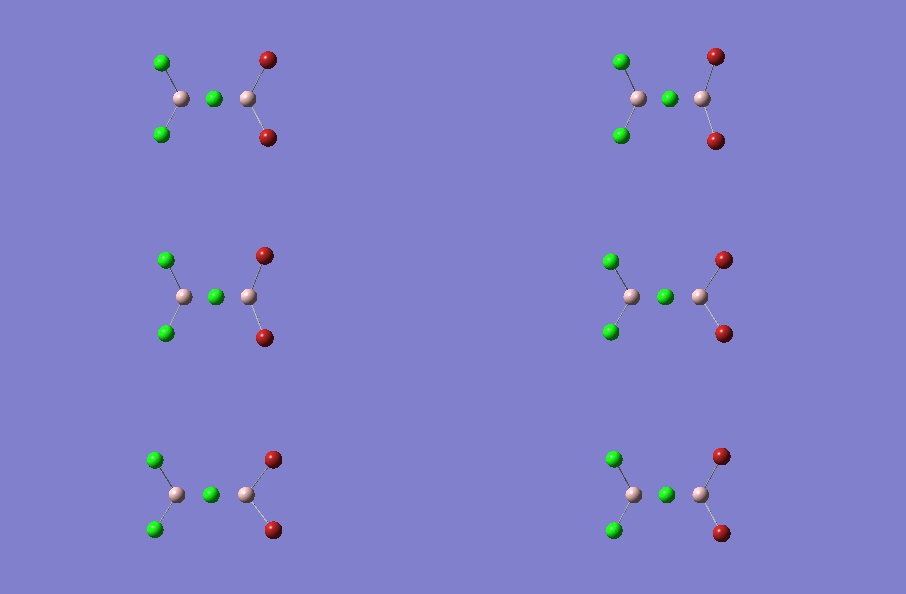
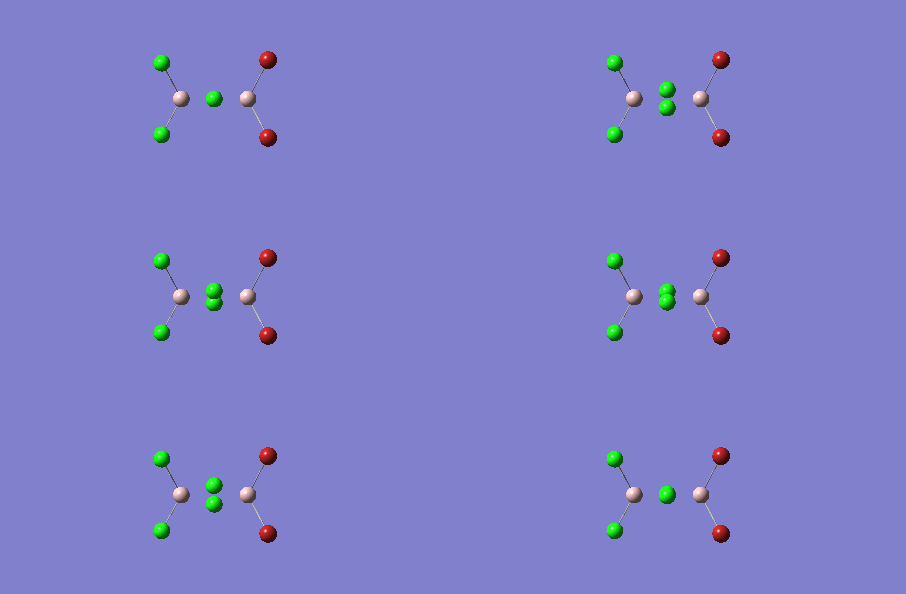
The four Isomers of Al2Cl4Br2
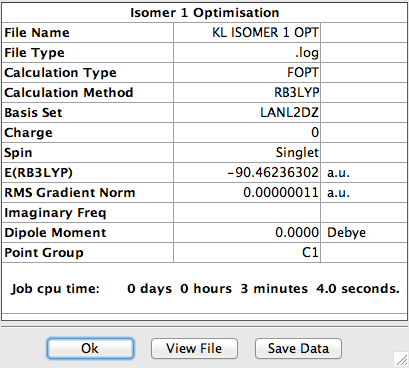
Optimisation of isomer 1
The log file for this calculation can be found here [[ File:KL_ISOMER_1_OPT.LOG]]
The following parameters were set
The value of the gradient is very close to 0 suggesting that the optimisation was successful.
 Item               Value     Threshold  Converged?
 Maximum Force            0.000000     0.000002     YES
 RMS     Force            0.000000     0.000001     YES
 Maximum Displacement     0.000003     0.000006     YES
 RMS     Displacement     0.000001     0.000004     YES
 Predicted change in Energy=-7.076144D-14
 Optimization completed.
    -- Stationary point found.
                           ----------------------------
                           !   Optimized Parameters   !
                           ! (Angstroms and Degrees)  !
 --------------------------                            --------------------------
 ! Name  Definition              Value          Derivative Info.                !
 --------------------------------------------------------------------------------
 ! R1    R(1,3)                  2.5878         -DE/DX =    0.0                 !
 ! R2    R(1,4)                  2.5878         -DE/DX =    0.0                 !
 ! R3    R(1,7)                  2.1805         -DE/DX =    0.0                 !
 ! R4    R(1,8)                  2.1805         -DE/DX =    0.0                 !
 ! R5    R(2,3)                  2.5878         -DE/DX =    0.0                 !
 ! R6    R(2,4)                  2.5878         -DE/DX =    0.0                 !
 ! R7    R(2,5)                  2.1805         -DE/DX =    0.0                 !
 ! R8    R(2,6)                  2.1805         -DE/DX =    0.0                 !
 ! A1    A(3,1,4)               89.1309         -DE/DX =    0.0                 !
 ! A2    A(3,1,7)              109.9012         -DE/DX =    0.0                 !
 ! A3    A(3,1,8)              109.9011         -DE/DX =    0.0                 !
 ! A4    A(4,1,7)              109.9012         -DE/DX =    0.0                 !
 ! A5    A(4,1,8)              109.9011         -DE/DX =    0.0                 !
 ! A6    A(7,1,8)              122.9182         -DE/DX =    0.0                 !
 ! A7    A(3,2,4)               89.1309         -DE/DX =    0.0                 !
 ! A8    A(3,2,5)              109.9011         -DE/DX =    0.0                 !
 ! A9    A(3,2,6)              109.9012         -DE/DX =    0.0                 !
 ! A10   A(4,2,5)              109.9012         -DE/DX =    0.0                 !
 ! A11   A(4,2,6)              109.9011         -DE/DX =    0.0                 !
 ! A12   A(5,2,6)              122.9182         -DE/DX =    0.0                 !
 ! A13   A(1,3,2)               90.8691         -DE/DX =    0.0                 !
 ! A14   A(1,4,2)               90.8692         -DE/DX =    0.0                 !
 ! D1    D(4,1,3,2)             -0.0001         -DE/DX =    0.0                 !
 ! D2    D(7,1,3,2)           -110.8897         -DE/DX =    0.0                 !
 ! D3    D(8,1,3,2)            110.8894         -DE/DX =    0.0                 !
 ! D4    D(3,1,4,2)              0.0001         -DE/DX =    0.0                 !
 ! D5    D(7,1,4,2)            110.8897         -DE/DX =    0.0                 !
 ! D6    D(8,1,4,2)           -110.8894         -DE/DX =    0.0                 !
 ! D7    D(4,2,3,1)              0.0001         -DE/DX =    0.0                 !
 ! D8    D(5,2,3,1)            110.8897         -DE/DX =    0.0                 !
 ! D9    D(6,2,3,1)           -110.8894         -DE/DX =    0.0                 !
 ! D10   D(3,2,4,1)             -0.0001         -DE/DX =    0.0                 !
 ! D11   D(5,2,4,1)           -110.8897         -DE/DX =    0.0                 !
 ! D12   D(6,2,4,1)            110.8894         -DE/DX =    0.0                 !
 --------------------------------------------------------------------------------
 GradGradGradGradGradGradGradGradGradGradGradGradGradGradGradGradGradGrad
From the table above, the forces were converged and this reinforces that the optimisation was successful.
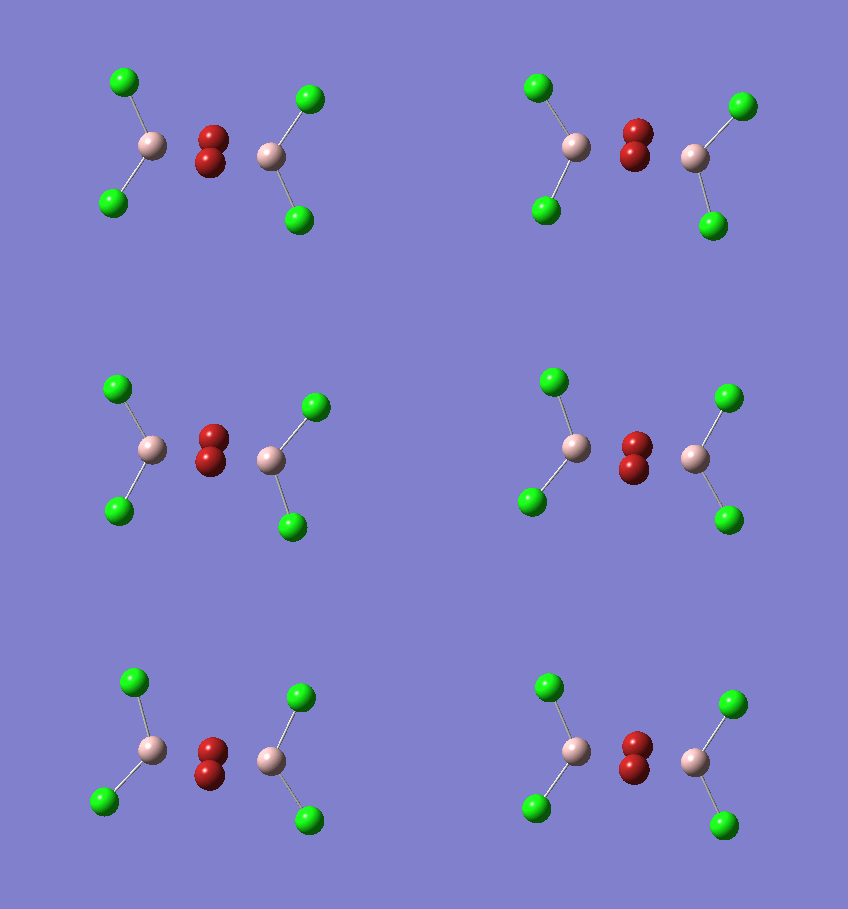
Frequency analysis of isomer 1
The log file for this calculation can be found here File:KL ISOMER 1 FREQ.LOG
The parameters were set as follow 
Low frequencies ---   -2   -2   -2   0    0    0
Low frequencies ---   16   53  73
The six frequencies are within the range of -15-15 cm1 and there are some negative frequencies with a very small magnitude but this is fine for the poor model we are using, the calculation would take much longer if we aim for perfect result. There is enough evidence to conclude that the isomer is at a minimum point on the potential surface. The energy remains the same during the frequency analysis calculation so the structure of the molecule remains constant.

Optimisation of isomer 2
The log file for this calculation can be found here 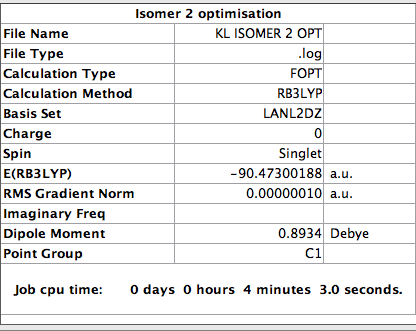
The following parameter was set [[ File:Kl_isomer_2_opt.png]]
The value of the gradient is very close to 0 suggesting that the optimisation was successful.
Item               Value     Threshold  Converged?
 Maximum Force            0.000000     0.000002     YES
 RMS     Force            0.000000     0.000001     YES
 Maximum Displacement     0.000005     0.000006     YES
 RMS     Displacement     0.000002     0.000004     YES
 Predicted change in Energy=-3.226469D-13
 Optimization completed.
    -- Stationary point found.
                           ----------------------------
                           !   Optimized Parameters   !
                           ! (Angstroms and Degrees)  !
 --------------------------                            --------------------------
 ! Name  Definition              Value          Derivative Info.                !
 --------------------------------------------------------------------------------
 ! R1    R(1,3)                  2.407          -DE/DX =    0.0                 !
 ! R2    R(1,4)                  2.407          -DE/DX =    0.0                 !
 ! R3    R(1,5)                  2.1768         -DE/DX =    0.0                 !
 ! R4    R(1,6)                  2.1768         -DE/DX =    0.0                 !
 ! R5    R(2,3)                  2.4362         -DE/DX =    0.0                 !
 ! R6    R(2,4)                  2.4362         -DE/DX =    0.0                 !
 ! R7    R(2,7)                  2.3386         -DE/DX =    0.0                 !
 ! R8    R(2,8)                  2.3386         -DE/DX =    0.0                 !
 ! A1    A(3,1,4)               86.0688         -DE/DX =    0.0                 !
 ! A2    A(3,1,5)              110.342          -DE/DX =    0.0                 !
 ! A3    A(3,1,6)              110.3423         -DE/DX =    0.0                 !
 ! A4    A(4,1,5)              110.3422         -DE/DX =    0.0                 !
 ! A5    A(4,1,6)              110.3421         -DE/DX =    0.0                 !
 ! A6    A(5,1,6)              123.2052         -DE/DX =    0.0                 !
 ! A7    A(3,2,4)               84.7938         -DE/DX =    0.0                 !
 ! A8    A(3,2,7)              109.9978         -DE/DX =    0.0                 !
 ! A9    A(3,2,8)              109.9978         -DE/DX =    0.0                 !
 ! A10   A(4,2,7)              109.9977         -DE/DX =    0.0                 !
 ! A11   A(4,2,8)              109.9978         -DE/DX =    0.0                 !
 ! A12   A(7,2,8)              124.8275         -DE/DX =    0.0                 !
 ! A13   A(1,3,2)               94.5686         -DE/DX =    0.0                 !
 ! A14   A(1,4,2)               94.5688         -DE/DX =    0.0                 !
 ! D1    D(4,1,3,2)              0.0007         -DE/DX =    0.0                 !
 ! D2    D(5,1,3,2)           -110.2511         -DE/DX =    0.0                 !
 ! D3    D(6,1,3,2)            110.2523         -DE/DX =    0.0                 !
 ! D4    D(3,1,4,2)             -0.0007         -DE/DX =    0.0                 !
 ! D5    D(5,1,4,2)            110.2508         -DE/DX =    0.0                 !
 ! D6    D(6,1,4,2)           -110.2525         -DE/DX =    0.0                 !
 ! D7    D(4,2,3,1)             -0.0007         -DE/DX =    0.0                 !
 ! D8    D(7,2,3,1)            109.4061         -DE/DX =    0.0                 !
 ! D9    D(8,2,3,1)           -109.4075         -DE/DX =    0.0                 !
 ! D10   D(3,2,4,1)              0.0007         -DE/DX =    0.0                 !
 ! D11   D(7,2,4,1)           -109.4062         -DE/DX =    0.0                 !
 ! D12   D(8,2,4,1)            109.4075         -DE/DX =    0.0                 !
 --------------------------------------------------------------------------------
 GradGradGradGradGradGradGradGradGradGradGradGradGradGradGradGradGradGrad
From the table above, the forces were converged and this reinforces that the optimisation was successful.
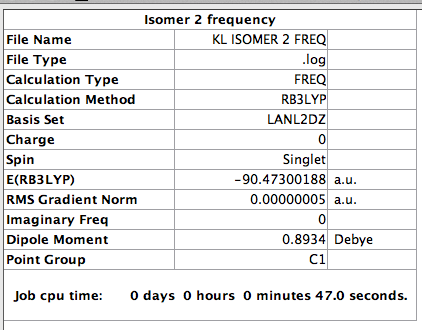
Frequency analysis of isomer 2
The following parameters were set
The log file for this calculation can be found here File:KL ISOMER 2 FREQ.LOG
Low frequencies ---   0    0    0    1    1    2
 Low frequencies ---   18   42   64
The six frequencies are within a very small range and there are no negative frequencies. This is a strong evidence to conclude that the isomer is at a minimum point on the potential surface. The energy remains the same during the frequency analysis calculation so the structure of the molecule remains constant.

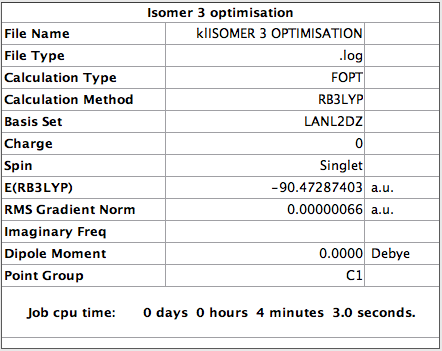
Optimisation of Isomer 3
The following parameters were set
The value of the gradient is very close to 0 suggesting that the optimisation was successful.
The log file for this calculation can be found here File:KlISOMER 3 OPTIMISATION.LOG
 Item               Value     Threshold  Converged?
 Maximum Force            0.000001     0.000002     YES
 RMS     Force            0.000000     0.000001     YES
 Maximum Displacement     0.000001     0.000006     YES
 RMS     Displacement     0.000000     0.000004     YES
 Predicted change in Energy=-8.734385D-13
 Optimization completed.
    -- Stationary point found.
                           ----------------------------
                           !   Optimized Parameters   !
                           ! (Angstroms and Degrees)  !
 --------------------------                            --------------------------
 ! Name  Definition              Value          Derivative Info.                !
 --------------------------------------------------------------------------------
 ! R1    R(1,7)                  2.4212         -DE/DX =    0.0                 !
 ! R2    R(1,8)                  2.4212         -DE/DX =    0.0                 !
 ! R3    R(2,7)                  2.4212         -DE/DX =    0.0                 !
 ! R4    R(2,8)                  2.4212         -DE/DX =    0.0                 !
 ! R5    R(3,8)                  2.1803         -DE/DX =    0.0                 !
 ! R6    R(4,7)                  2.1803         -DE/DX =    0.0                 !
 ! R7    R(5,7)                  2.3346         -DE/DX =    0.0                 !
 ! R8    R(6,8)                  2.3346         -DE/DX =    0.0                 !
 ! A1    A(7,1,8)               94.5667         -DE/DX =    0.0                 !
 ! A2    A(7,2,8)               94.5672         -DE/DX =    0.0                 !
 ! A3    A(1,7,2)               85.433          -DE/DX =    0.0                 !
 ! A4    A(1,7,4)              109.4402         -DE/DX =    0.0                 !
 ! A5    A(1,7,5)              110.9281         -DE/DX =    0.0                 !
 ! A6    A(2,7,4)              109.4406         -DE/DX =    0.0                 !
 ! A7    A(2,7,5)              110.9286         -DE/DX =    0.0                 !
 ! A8    A(4,7,5)              123.9744         -DE/DX =    0.0                 !
 ! A9    A(1,8,2)               85.4331         -DE/DX =    0.0                 !
 ! A10   A(1,8,3)              109.4404         -DE/DX =    0.0                 !
 ! A11   A(1,8,6)              110.9288         -DE/DX =    0.0                 !
 ! A12   A(2,8,3)              109.4401         -DE/DX =    0.0                 !
 ! A13   A(2,8,6)              110.9284         -DE/DX =    0.0                 !
 ! A14   A(3,8,6)              123.9744         -DE/DX =    0.0                 !
 ! D1    D(8,1,7,2)             -0.0018         -DE/DX =    0.0                 !
 ! D2    D(8,1,7,4)           -109.0209         -DE/DX =    0.0                 !
 ! D3    D(8,1,7,5)            110.6756         -DE/DX =    0.0                 !
 ! D4    D(7,1,8,2)              0.0018         -DE/DX =    0.0                 !
 ! D5    D(7,1,8,3)           -109.0167         -DE/DX =    0.0                 !
 ! D6    D(7,1,8,6)            110.679          -DE/DX =    0.0                 !
 ! D7    D(8,2,7,1)              0.0018         -DE/DX =    0.0                 !
 ! D8    D(8,2,7,4)            109.0205         -DE/DX =    0.0                 !
 ! D9    D(8,2,7,5)           -110.675          -DE/DX =    0.0                 !
 ! D10   D(7,2,8,1)             -0.0018         -DE/DX =    0.0                 !
 ! D11   D(7,2,8,3)            109.0171         -DE/DX =    0.0                 !
 ! D12   D(7,2,8,6)           -110.6793         -DE/DX =    0.0                 !
 --------------------------------------------------------------------------------
 GradGradGradGradGradGradGradGradGradGradGradGradGradGradGradGradGradGrad
From the table above, the forces were converged and this reinforces that the optimisation was successful.
Frequency analysis of Isomer 3
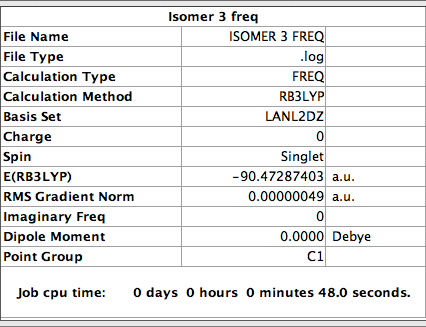
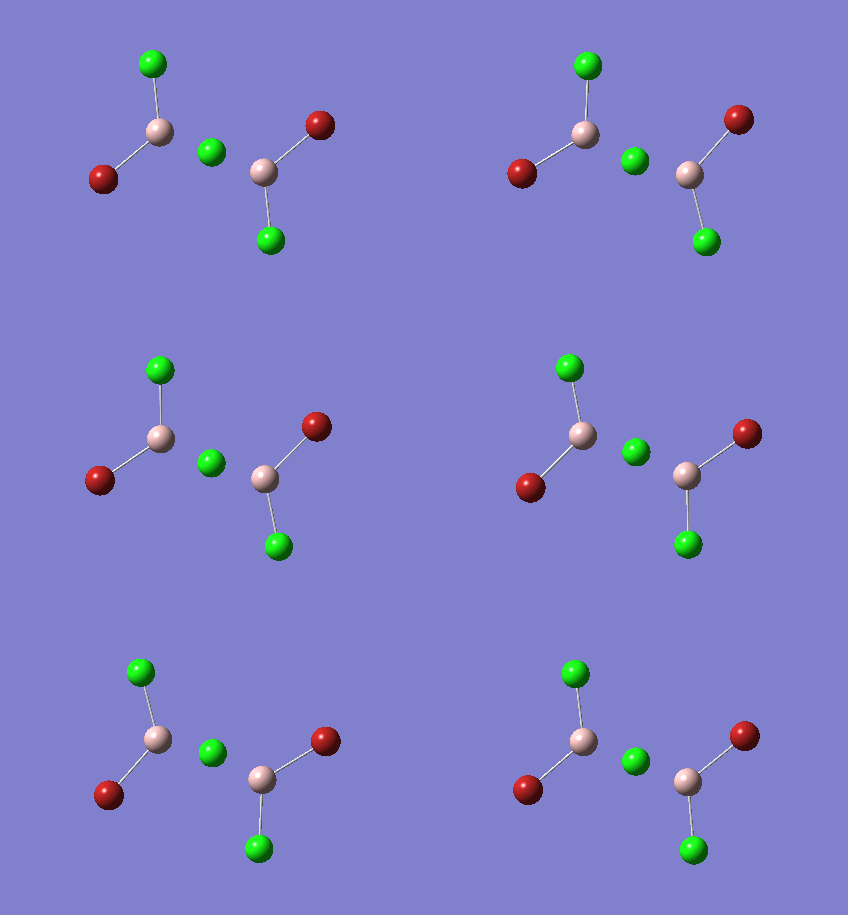
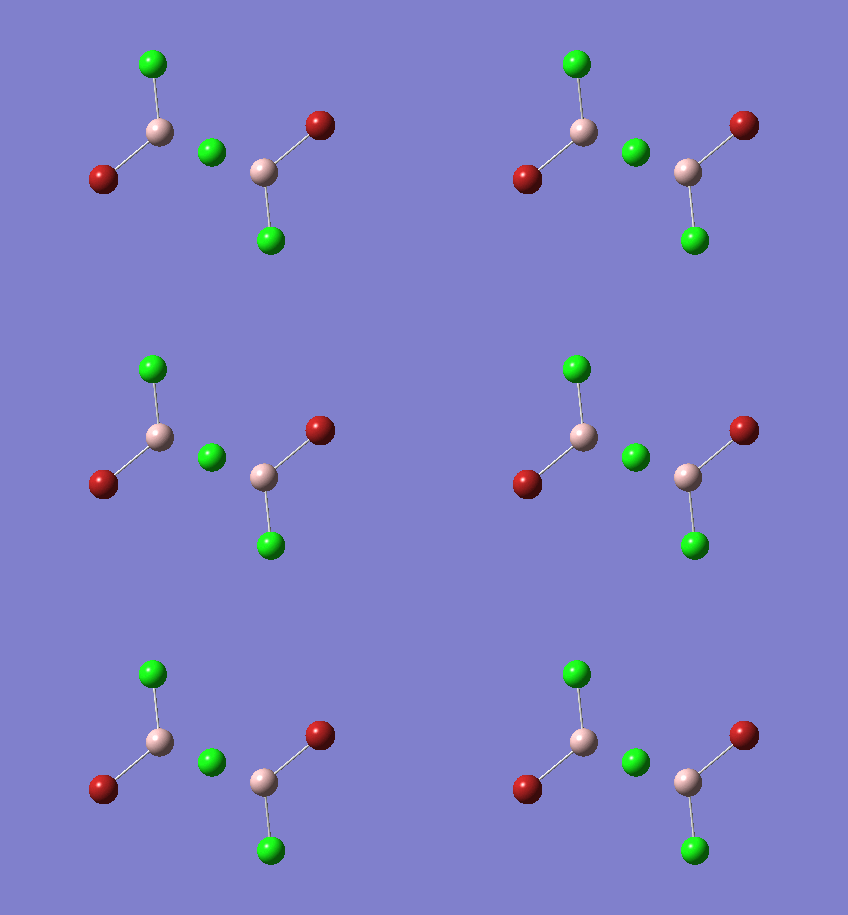
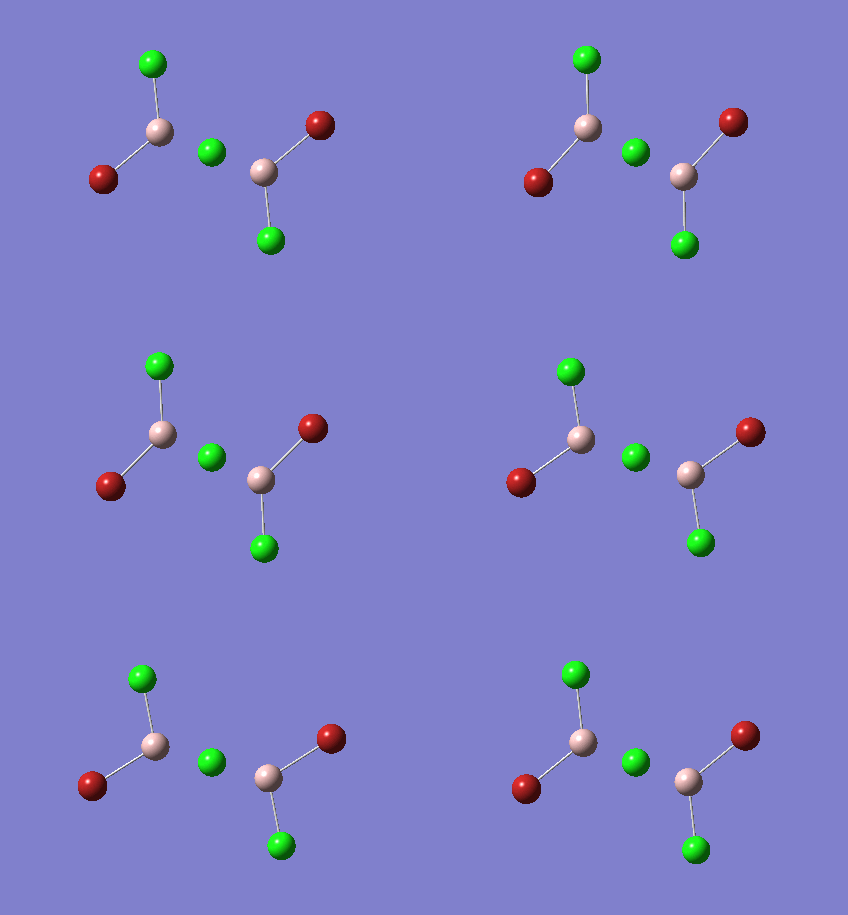
The log file for this calculation can be found here File:KlISOMER 3 FREQ.LOG
The parameters were set as follow
Low frequencies ---   -3   -1   -1   0    0    0
 Low frequencies ---   18   41   65
The six frequencies are within the range of -15-15 cm1 and there are some negative frequencies with a very small magnitude but this is fine for the poor model we are using, the calculation would take much longer if we aim for perfect result. There is enough evidence to conclude that the isomer is at a minimum point on the potential surface. The energy remains the same during the frequency analysis calculation so the structure of the molecule remains constant.

Optimisation of isomer 4
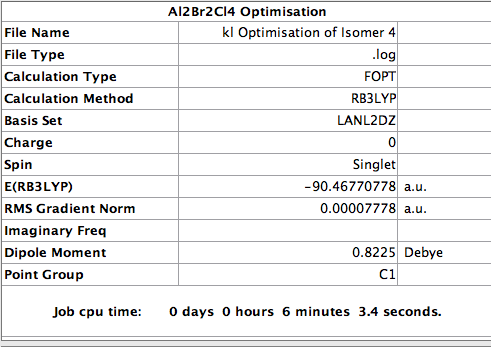
The log file for this calculation can be found here File:Kl Optimisation of Isomer 4.log
The following parameters were set
The value of the gradient is very close to 0 suggesting that the optimisation was successful.
Item Value Threshold Converged?
Maximum Force            0.000157     0.000450     YES
RMS     Force            0.000056     0.000300     YES
Maximum Displacement     0.001136     0.001800     YES
RMS     Displacement     0.000492     0.001200     YES
Predicted change in Energy=-1.416927D-07
Optimization completed.
   -- Stationary point found.
                          ----------------------------
                          !   Optimized Parameters   !
                          ! (Angstroms and Degrees)  !
--------------------------                            --------------------------
! Name  Definition              Value          Derivative Info.                !
--------------------------------------------------------------------------------
! R1    R(1,2)                  3.6214         -DE/DX =   -0.0001              !
! R2    R(1,3)                  2.6026         -DE/DX =   -0.0001              !
! R3    R(1,4)                  2.3372         -DE/DX =    0.0                 !
! R4    R(1,5)                  2.4228         -DE/DX =    0.0001              !
! R5    R(1,8)                  2.1819         -DE/DX =    0.0                 !
! R6    R(2,3)                  2.58           -DE/DX =    0.0001              !
! R7    R(2,5)                  2.4143         -DE/DX =   -0.0002              !
! R8    R(2,6)                  2.179          -DE/DX =    0.0                 !
! R9    R(2,7)                  2.1785         -DE/DX =    0.0                 !
! R10   R(3,5)                  3.457          -DE/DX =    0.0                 !
! A1    A(2,1,4)              119.2911         -DE/DX =    0.0                 !
! A2    A(2,1,8)              116.9126         -DE/DX =    0.0                 !
! A3    A(3,1,4)              110.9097         -DE/DX =    0.0                 !
! A4    A(3,1,8)              109.4097         -DE/DX =    0.0                 !
! A5    A(4,1,5)              110.4648         -DE/DX =    0.0                 !
! A6    A(4,1,8)              123.7428         -DE/DX =    0.0                 !
! A7    A(5,1,8)              109.3003         -DE/DX =    0.0                 !
! A8    A(1,2,6)              118.4156         -DE/DX =    0.0                 !
! A9    A(1,2,7)              118.3581         -DE/DX =    0.0                 !
! A10   A(3,2,6)              110.2166         -DE/DX =    0.0                 !
! A11   A(3,2,7)              110.4976         -DE/DX =    0.0                 !
! A12   A(5,2,6)              109.7309         -DE/DX =    0.0                 !
! A13   A(5,2,7)              109.9694         -DE/DX =    0.0                 !
! A14   A(6,2,7)              123.148          -DE/DX =   -0.0001              !
! D1    D(4,1,2,6)              0.0788         -DE/DX =    0.0                 !
! D2    D(4,1,2,7)            176.9629         -DE/DX =    0.0                 !
! D3    D(8,1,2,6)           -177.3604         -DE/DX =    0.0                 !
! D4    D(8,1,2,7)             -0.4763         -DE/DX =    0.0                 !
! D5    D(5,2,3,1)             -0.3063         -DE/DX =    0.0                 !
--------------------------------------------------------------------------------
GradGradGradGradGradGradGradGradGradGradGradGradGradGradGradGradGradGrad
From the table above, the forces were converged and this reinforces that the optimisation was successful.
Frequency Analysis of isomer 4
The log file for this calculation can be found here File:Kl isomer 4 freq.log
The following parameters were set [[ File:Kl isomer 4 freq.png ]]
Low frequencies --- -1 0 0 0 2 4 Low frequencies --- 17 47 72
The six frequencies are within the range of -15-15 cm1 and there are some negative frequencies with a very small magnitude but this is fine for the poor model we are using, the calculation would take much longer if we aim for perfect result. There is enough evidence to conclude that the isomer is at a minimum point on the potential surface. The energy remains the same during the frequency analysis calculation so the structure of the molecule remains constant.

Comparison of the four isomers
The optimised energy of the four isomers are summarised in the table below
| Isomer | Energy (a.u.) | Energy (kJ/mol) |
|---|---|---|
| 1 | -90.46236302 | -237508.9341 |
| 2 | -90.47300188 | -237536.8664 |
| 3 | -90.47287403 | -237536.5308 |
| 4 | -90.46770778 | -237522.9888 |
From the table above, we can conclude that isomer 2 is the lowest in energy and hence is the most stable conformation of Al2Br2Cl4. The common factor between the four isomers is that they all contain 2 lots of 3-center-4-electron bridging bonds and 4 lots of terminal bonds so it must be the arrangement of the atoms effecting the stability. The most significant factor is the strength of the bridging bonds as these are the main interactions holding the dimer together so we would expect the isomers containing strong bridging bonds to be the most stable. Al forms stronger bond Cl than with Br as the 3p orbital from Cl is less diffused than the 4p orbital in Br so the 3p orbital in Cl overlaps better with the 3p orbital in Al. Therefore isomers containing two bridging Cl atoms should be the most stable. This expectation follows the trend of the result as isomer 2 and 3 both contains 2 bridging Cl atoms and these were the most stable isomers. Isomer 1 which contains 2 bridging Br atoms is the highest in energy as the bridging bonds are weaker. Isomer 4 contains 1 Br and 1 Cl atom so the strength of the bridging bonds is intermediate and hence its stability lies between isomer 1 and isomer 3,4. From this observation we can conclude that the dimer is the most stable when the Br atom occupies a terminal position as this allow the Cl atoms to occupy the bridging position which gives a much stronger 3-center-4-electron bridging bonds interaction.
Dissociation energy of isomer 2
The following equation shows the dissociation of
Al2Br2Cl4 -> 2AlBrCl2
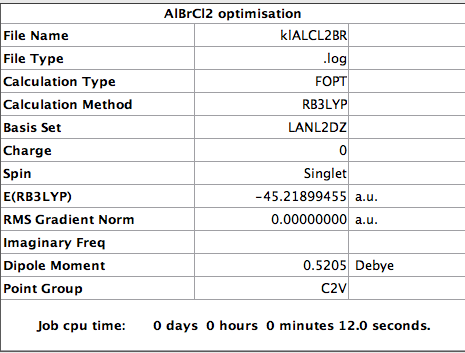
We need to calculate the optimised energy of 2AlBrCl2 to do this analysis
Optimisation of AlCl2Br
The following parameters were set
Item               Value     Threshold  Converged?
 Maximum Force            0.000000     0.000002     YES
 RMS     Force            0.000000     0.000001     YES
 Maximum Displacement     0.000000     0.000006     YES
 RMS     Displacement     0.000000     0.000004     YES
 Predicted change in Energy=-3.608015D-16
 Optimization completed.
    -- Stationary point found.
                           ----------------------------
                           !   Optimized Parameters   !
                           ! (Angstroms and Degrees)  !
 --------------------------                            --------------------------
 ! Name  Definition              Value          Derivative Info.                !
 --------------------------------------------------------------------------------
 ! R1    R(1,2)                  2.1782         -DE/DX =    0.0                 !
 ! R2    R(1,3)                  2.1782         -DE/DX =    0.0                 !
 ! R3    R(1,4)                  2.3355         -DE/DX =    0.0                 !
 ! A1    A(2,1,3)              119.294          -DE/DX =    0.0                 !
 ! A2    A(2,1,4)              120.353          -DE/DX =    0.0                 !
 ! A3    A(3,1,4)              120.353          -DE/DX =    0.0                 !
 ! D1    D(2,1,4,3)            180.0            -DE/DX =    0.0                 !
 --------------------------------------------------------------------------------
 GradGradGradGradGradGradGradGradGradGradGradGradGradGradGradGradGradGrad
Dissociation energy of isomer 2 Continue
E(Al2Br2Cl4) = -90.47300188 a.u.
E(AlBrCl2) = -45.21899455 a.u. The energy change of the reaction is given by -90.47300188 a.u. - (2x -45.21899455 a.u.) = 0.03501278 a.u. = 91.926060893 kJ/mol Therefore the dissociation energy of Al2Br2Cl4 is 91.93 kJ/mol
Base on the dissociation of isomer 2, 91.93 kJ/mol of energy is required to break the dimer linkage to give the monomers. This is not a small amount of energy so this reaction is unfavourable and the dimer is more stable than its monomer. This is not surprising as a dimer is formed to relieve electron deficiency so it is unwise to break the dimer linkage.
Discussion of IR
An IR band can only be detected by an IR spectrometer if the molecule changes its overall dipole moment after absorbing the IR radiation. The overall change in dipole moment of the molecule correlates directly with the intensity of the band, the greater the intensity, the greater the change in dipole moment. When a band is undetectable (0 intensity), there is no overall change in dipole moment so they are classed as IR Inactive bands.
There are 3N-6 vibrational modes (18) for each isomer since they are all non linear. For all four isomers, there are less peaks in the IR spectrum than the number of vibrational modes. Some of the vibrational mode are degenerate in frequency even though they have a distinct vibrational mode, as a result they are superimposed in the IR spectrum. Some of these 18 vibrational modes have very little change in dipole moment so the intensity are too low to be detected
The symmetry label of isomer 2, isomer 3 and isomer 4 are all C1 whereas the point group of isomer 1 is CS. Hence isomer 2,3 and 4 have similar spectra with similar intensities as the same point groups have similar symmetry operations. Isomer 1 have a more unique spectrum since its point group is different, the peaks are more intense suggesting that the vibrational modes have a greater change in dipole moment.
The position and nature of Al-Br stretching vibrations with respect to the terminal or bridging position of the Br atom.
| Mode | Isomer | Vibration | Frequency | Intensity | Mode | Isomer | Vibration | Frequency | Intensity |
|---|---|---|---|---|---|---|---|---|---|
| 3 | 1 |  |
73 | 0 | 2 | 2 |  |
96 | 0 |
| 4 | 4 | 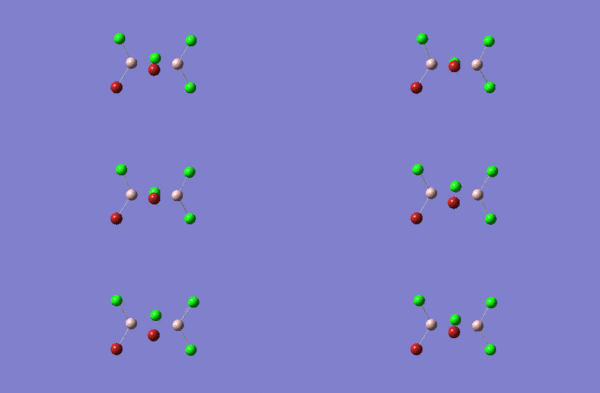 |
79 | 1 | 3 | 1 |  |
73 | 0 |
| 7 | 4 | 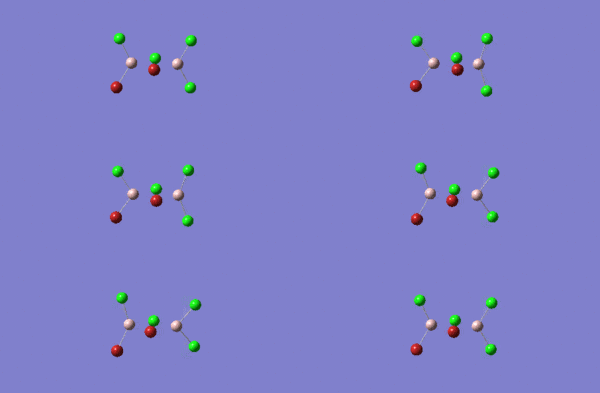 |
107 | 13 | 12 | 2 | 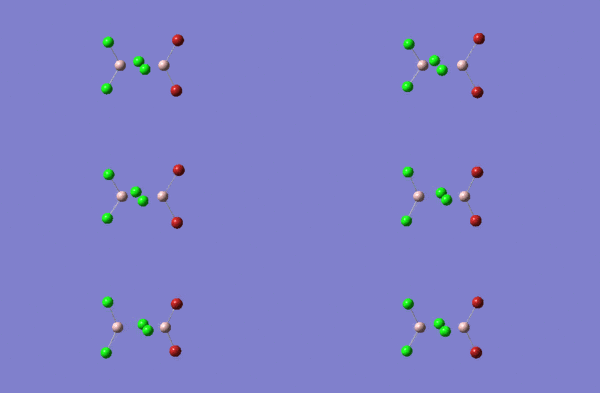 |
241 | 9 |
This section only concerns with similar vibrational modes of different isomers. From the above analysis, we can see that motions containing bridging Br atom lowers the frequency. Mode 3 of isomer 1 has a very similar motion with mode 5 of isomer 2, the frequency of latter is higher than the former, maybe because the central 3C4e bond is stronger if the Cl atoms are bridging. As mentioned earlier, the 3p orbital in Al overlaps better with the Cl 3p orbital than it does with the 4p Br orbital. Hence, the bridging bonds are stronger giving a higher frequency. Both motions does not involve a change in dipole moment so the intensity is 0.
The same is true in the second example where we investigate mode 4 of isomer 4 and mode 3 of isomer 1 but the difference in energy is smaller than in the previous example since the bridging bond composed of Br + Cl atoms instead of two Cl atoms. One Br and one Cl atom forms a stronger bridging interaction than 2 Br atoms so that the frequency in the former case is higher. Very little change in dipole moment so very low intensity.
In the third example, mode 7 of isomer 4 and mode 12 of isomer 2 were compared. Similar trend is observed where the 2 Cl atoms in the latter case provided a stronger bridging than 1 Br and 1 Cl atom in the former case. As a result the frequency in the latter case is higher.
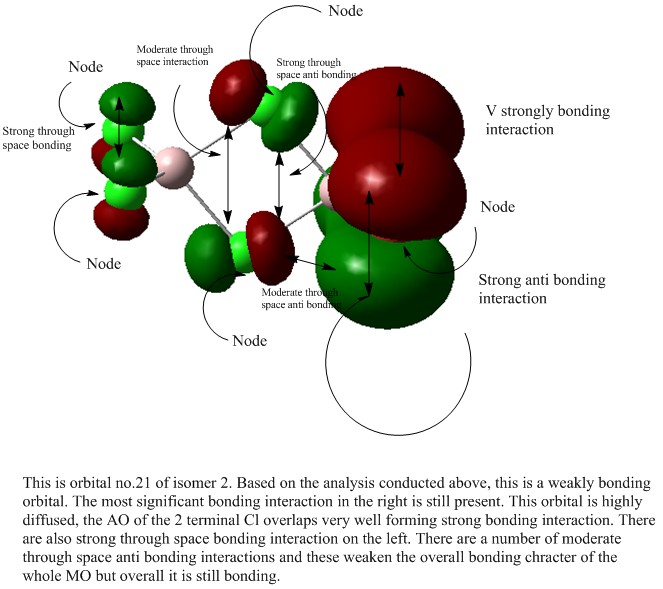
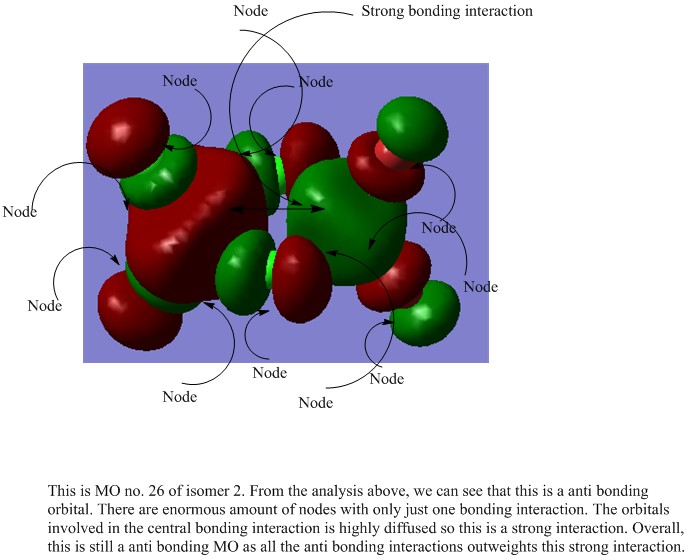
MO Analysis
A MO analysis was carried out all the isomer with the lowest energy (isomer 2)
The checkpoint file for this calculation can be found here File:Kl isomer 2 MO.chk
For this analysis, only the non core orbitals are analysed and five of these were chosen. The MOs to be analysed are 17,21,23,24,26 and each of these will be assigned as either bonding or anti bonding.

