Rep:Mod:kl1111comp2
Introduction: Ionic liquids
Ionic liquids consist entirely of ions and exhibit properties of being non-flammable, non-volatile and non-corrosive under atmospheric properties. [1] Due to the large number of ions that exist, it is possible to engineer a specific combination to give an ionic liquid with desired properties. For this reason, ionic liquids are becoming increasingly popular as "designer solvents". In addition to being excellent solvents for organic and inorganic reagents, they are also being used as catalysts and are termed to be "green solvents" due to their low vapour pressures and high thermal stabilities when compared to other solvents such as water. [2] In this project, the properties of several cations were analyzed and compared.
Optimisation and Frequency Analysis of "Onium" cations
[N(CH3)]4+
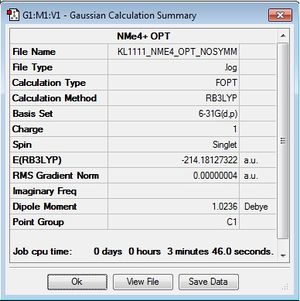
Optimisation log file here
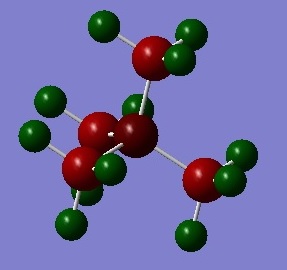
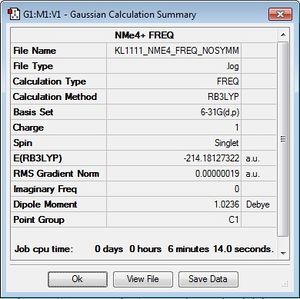
The N(CH3)4 cation was optimised using the B3LYP/6-31G(d,p) basis set and the keywords "integral=grid=ultrafine scf=conver=9 nosymm" were added into the additional keywords section, as well as ticking the "tight convergence" box. This criteria increases the accuracy of the calculation by increasing the number of trapeziums under a curve as seen in the trapezium rule. The point group of the cation is currently unknown and by using the term "nosymm", the lowest energy structure can be found during optimisation. To confirm that the calculation had been completed, the gradient and convergence was analysed and it can be confirmed that convergence has been completed.
Frequency file here
| summary data | low modes |
|---|---|
|
Low frequencies --- -5.5623 -2.1053 -0.0013 -0.0012 -0.0008 3.9591 Low frequencies --- 183.7583 288.3934 288.8974 |
A frequency analysis was carried out in order to determine whether the minimum energy structure had been reached. In the case of a minimum, one would expect to see all positive frequencies. If one frequency was negative, it would indicate a maximum instead, corresponding to a high energy transition state. As seen in the second line within the table, the low frequencies were all positive and confirms the optimisation to find a low energy state was successful. The low frequencies in the first line were found to be close to zero and were within ±15cm-1 of each other.
| C-N bond distance | 1.51 Å |
| C-H bond distance | 1.09 Å |
| C-N-C bond angle | 109.5° |
It has been reported in literature that the tetramethylammonium cation has a distorted tetrahedral structure and has C-N bond lengths of 1.457–1.492Å. [3] The computed bond length is 1.51Å and is pretty close to experimental values. The experimental value for a C-H bond in methane has been found to be 1.10Å [4] and the computed values are comparable to this value. The bond angle for the cation is 109.5°, typical of tetrahedral structures.
[P(CH3)]4+
Optimisation log file here
| summary data | convergence | Jmol | |||
|---|---|---|---|---|---|

|
         Item               Value     Threshold  Converged?
 Maximum Force            0.000001     0.000015     YES
 RMS     Force            0.000000     0.000010     YES
 Maximum Displacement     0.000025     0.000060     YES
 RMS     Displacement     0.000007     0.000040     YES
 Predicted change in Energy=-6.515374D-11
 Optimization completed.
    -- Stationary point found.
|
|
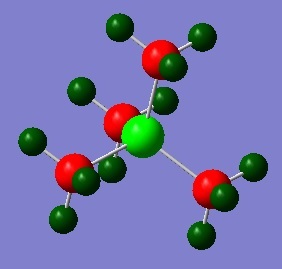
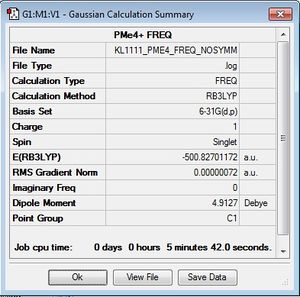
In a similar way to the [N(CH3)4]+ optimisation, the [P(CH3)4]+ cation was optimised using the B3LYP/6-31G (d,p) method and the additional keywords "integral=grid=ultrafine scf=conver=9 nosymm" were used for high accuracy to find the lowest energy structure. The calculation was checked for completion by checking the gradient and convergence of forces. It can be seen here that the calculation has gone to completion.
Frequency file here
| summary data | low modes |
|---|---|
|
Low frequencies --- -2.6503 -0.0013 0.0023 0.0024 5.1085 7.5822 Low frequencies --- 156.4385 192.0306 192.2693 |
Once again, a frequency analysis was carried out to confirm the successful minimisation of energy within the molecule. As one can see, all grequencies in the second line are postivie, indicating a minimum point. The frequencies in the top line are all close to zero and within ±15cm-1 of each other.
| C-P bond distance | 1.82 Å |
| C-H bond distance | 1.09 Å |
| C-P-C bond angle | 109.5° |
The computed C-P bond length of 1.82 Å has been found to be similar to values found experimentally in literature as 1.84 Å [5] The C-H bond length and C-P-C bond angle has been found to be similar to values found in sp3 tetrahedral structures.
[S(CH3)3]+
Optimisation log file here
| summary data | convergence | Jmol | |||
|---|---|---|---|---|---|

|
         Item               Value     Threshold  Converged?
 Maximum Force            0.000003     0.000015     YES
 RMS     Force            0.000001     0.000010     YES
 Maximum Displacement     0.000049     0.000060     YES
 RMS     Displacement     0.000021     0.000040     YES
 Predicted change in Energy=-1.204289D-10
 Optimization completed.
    -- Stationary point found.
|
|
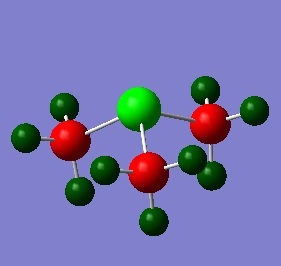
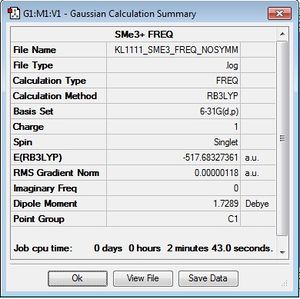
In a similar way to the [N(CH3)4]+ and [P(CH3)4]+ optimisation, the [S(CH3)s]+ cation was optimised using the B3LYP/6-31G (d,p) method and the additional keywords "integral=grid=ultrafine scf=conver=9 nosymm" were used for high accuracy to find the lowest energy structure. The calculation was checked for completion by checking the gradient and convergence of forces. It can be seen here that the calculation has gone to completion.
Frequency file here
| summary data | low modes |
|---|---|
|
Low frequencies --- -10.3846 -3.1325 0.0040 0.0043 0.0048 5.1965 Low frequencies --- 162.2665 200.0401 200.7118 |
To check the the minimum energy structure had been reached, a frequency analysis was carried out. All frequencies in the second line are positive and implies that a minimum structure has been reached. The frequencies in the first line are close to zero but are still only within ±20cm-1 of each other, and this is due to the basis set used not being good enough and the fact that there are some very soft vibrational modes.
| C-S bond distance | 1.82 Å |
| C-H bond distance | 1.09 Å |
| C-S-C bond angle | 102.7° |
The computed C-S bond of 1.82 Å is the same as that found in literature.[6] The C-H bond length is analagous to alkane C-H bonds. The C-S-C bond is expected to be 107.0° as expected of trigonal pyramidal structure with a lone pair. However, the resulting bond angle is only 102.7°, much smaller than what it should be, and reasons for this difference will be explained later.
Comparison of bond lengths and angles
| C-X bond distance Å | C-X Bond Angle ° | |
|---|---|---|
| [N(CH3)4]+ | 1.51 | 109.5 |
| [P(CH3)4]+ | 1.82 | 109.5 |
| [S(CH3)3]+ | 1.82 | 102.7 |
The optimisation of [N(CH3)4]+, [P(CH3)4]+ and [S(CH3)3]+ were all carried out using the same method, basis set and additional keywords in order for a valid comparison to be made between those three cations. As mentioned previosuly, the computed bond angles and lengths mostly agreed with literature values, with the exception of [S(CH3)3]+ which had a bond angle smaller than expected.
Bond length is affected by the electronegativity difference and the orbital interaction between two atoms. Of course, one may say that having a large electronegativity difference between two atoms would strengthen bond as one atom pulls the electron density in a bond towards itself and thereby shortening and strengthening the bond as seen in the case of H-F. Due to the larger electronegativity difference between C-P compared to C-N, the C-P bond should be shorter than the C-N bond in which both substituents are close in electronegativity. However, this is not the case and this can be explained by orbital interaction. Due to the large atomic size of P compared to N, its orbitals are also large and diffuse as they are not held so closely to the nucleus. The orbital overlap between the C and P orbitals are therefore not as good as that for C and N and thus a weaker longer C-P bond is seen compared to C-N.
In a similar fashion, S is in the same row as P and thus the C-S bond length should be comparable to C-P and longer than C-N which is the case. However, the computed bond angle for C-S-C is not typical of a trigonal pyramidal structure, such as ammonia which has a bond angle of 107.0°. Ammonia is sp3 hybridised and should have a tetrahedral structure with a bond angle of 109.5°, however, due to its lone pair, it causes repulsion and pushes the bond pair electrons closer together and thus exhibits a smaller bond angle. For an sp3 hybridised atom, one would expect to see s character of 25% and p character of 75%. Analysis of the NBO population for [S(CH3)3]+ showed a different hybridisation content, as seen below.
4. (1.98631) BD ( 1) C   1 - S  13
          ( 48.67%)   0.6976* C   1 s( 19.71%)p 4.07( 80.16%)d 0.01(  0.14%)
          ( 51.33%)   0.7165* S  13 s( 16.95%)p 4.86( 82.41%)d 0.04(  0.63%)
As seen from the table, the sulfur atom is not sp3 hybridised, instead exhibiting a higher p character, at 82.41% compared to 75% in tetrahedral complexes. Becuase p orbitals are perpendicular to one another, a smaller bond angle is displayed.
Population Analysis
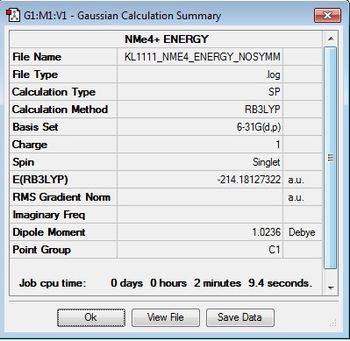
A population analysis was carried out on the cations using the additional keywords "pop=full" and under "full NBO". Population analysis is useful in that information about the electronic contribution from each orbital in a bond can be calculated and a charge can be assigned to an atom to view the overall charge distribution in the molecule. From this calculation, it is possible to view the MO diagrams using the .chk files and carry out a NBO analysis with the .log file.
| [N(CH3)4]+ | [P(CH3)4]+ | [S(CH3)3]+ |
|---|---|---|
| Output file | Output file | Output file |
 |
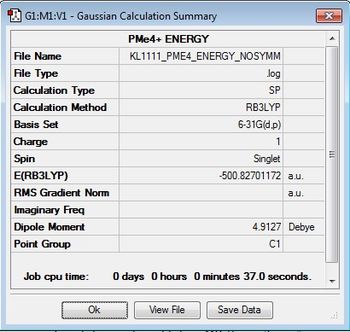 |
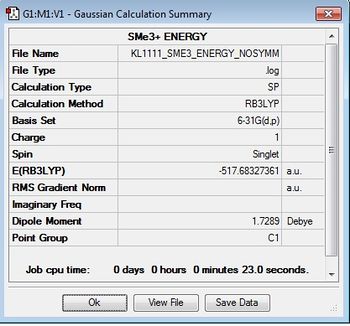
|
Molecular Orbitals of [N(CH3)4]+
5 occupied non-core MOs of [N(CH3)4]+ were analysed by inspection of the interactions occurring within the MOs. A MO can be determined to be overall antibonding or bonding by viewing the interactions between orbitals, with bonding/antibonding interactions being stronger than through space interactions. Nodes signify areas of no electron density.
| Number | Molecular Orbital | Description |
|---|---|---|
| 6 | 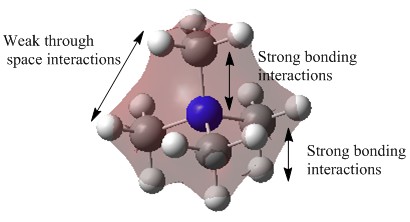 |
This molecular orbital is highly delocalised as the electron density is spread over all atoms. There is strong bonding interactions between the 2s atomic orbitals (AOs) of the nitrogen (N) atom and the 2s AOs of the carbon (C) atom. There is also strong bonding interactions between the 2s AO of C atoms and the 1s AO of the hydrogen (H) atoms. There are also many weak through space bonding interactions occuring in the overall molecule. All s orbitals are in the same phase and thus this MO is overall bonding. |
| 9 | 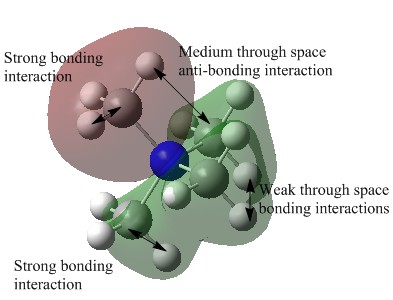 |
This molecular orbital is quite delocalised as the electron density can be seen to be spread over many atoms. There is a single node located at N, indicating that it is interacting via its p orbitals and the other atoms via their s orbitals. There is strong bonding interactions between the 2p orbitals of N and 2s of C atoms and also between the 2s orbital of the C atoms and 1s orbitals of the H atoms. However, for one of the methyl groups, the phase of their respective AOs is different to the rest of the molecule and thus contributes a small amount to the anti-bonding element of the MO, and thus MO9 is overall bonding. |
| 10 | 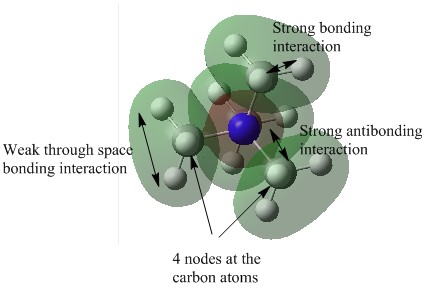 |
This MO is fairly localised as the electron density is only spread over a maximum of three atoms when compared to MO6 and MO9. There are 4 nodes in total, one located at each of the carbon atoms. This would indicate that the carbon atoms are interacting with their neighbouring atoms via their 2p orbitals. There are strong bonding interactions between the 2p atomic orbital of the carbon atom and the 1s atomic orbital of the hydrogen. There is also weak through space bonding interactions between the 1s atomic orbitals of the hydrogen atoms. There is also strong bonding interactions between the 2s AO of nitrogen and the 2p AOs of the carbon atoms. However, because the Nitrogen 2s AO is of a different phase to the C-H AOs, it contributes to the anti-bonding element of the overall MO. |
| 15 | 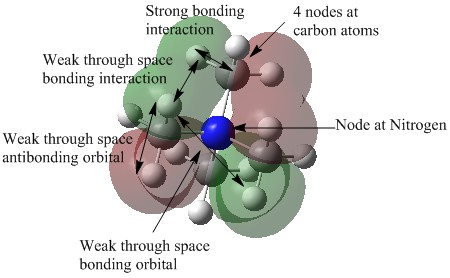 |
This molecular orbital is quite delocalised and the electron density is spread out over a distance. There are 4 nodes located at the carbon atoms and also a node on the central nitrogen atom, corresponding to 2 nodal planes. There are strong bonding interaction seen between the 2p orbitals of the C atoms and the 1s orbital of the H atoms. There are also weak through space bonding interactions seen between the hydrogen atomic orbitals. Since there are 2 nodal planes in the MO, it can be described as being anti-bonding. |
| 17 | 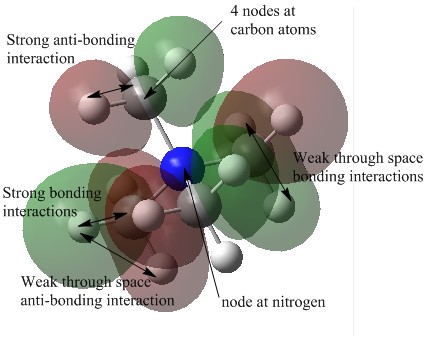 |
This molecular orbital is fairly localised, as the electron density is situated on only one or two atoms. There are 4 nodes located on the carbon atoms and one on the nitrogen atom, equating to a single nodal plane as seen in the diagram. The MO is overall weakly anti-bonding due to the strong bonding interaction between the carbon p orbital and the 1s atomic orbital of the hydrogen atom. There are also many weak through space bonding and anti-bonding interactions between the 1s atomic orbitals of the hydrogen atoms. |
Natural Bond Order Analysis (NBO)
The charge distributions of the three cations was analysed by carrying out an NBO analysis on the output files of the population analysis done in the previous section. The charge range was set to -1.000 to 1.000 in order for a valid comparison to be done on the three cations. The electronegativities of the atoms have been tabulated below to help explain the reason for the difference in charge distribution for the three cations.
| H | C | N | P | S |
|---|---|---|---|---|
| 2.20 | 2.55 | 3.04 | 2.19 | 2.58 |
The charge distributions for the three cations are shown below.
|
|
| ||||||||||||||||||||||||||||||||||||
It can be seen that in all cases, it is the C atom which has the most negative charge on the NBO calculation, despite it being the more electropositive element with respect to N and P.
[N(CH3)4]+
In the formation of the [N(CH3)4]+ cation, the nitrogen atom donates one of its lone pairs to the carbon atom of a methyl group. In this case, it is forming a dative covalent bond and becomes electron deficient compared to the carbon atom. We should therefore see a positive charge on the NBO analysis of the nitrogen atom in [N(CH3)4]+. However, looking at the NBO, we can see that the nitrogen atom is still negatively charged and this is due to it being electronegative compared to the carbon, meaning that it pulls electron density towards itself within the C-N bond. This can be further confirmed by investigating the "(Occupancy) Bond orbital/ Coefficients/ Hybrids" section of the NBO output file.
 4. (1.98452) BD ( 1) C   1 - N  17
                ( 33.65%)   0.5801* C   1 s( 20.78%)p 3.81( 79.06%)d 0.01(  0.16%)
                ( 66.35%)   0.8146* N  17 s( 25.00%)p 3.00( 74.97%)d 0.00(  0.03%)
Looking at the table above, it can be seen that the nitrogen does indeed contribute a larger portion of electron density in the C-N bond, contributing 66.35% electron density compared to 33.65% from the carbon. This proves that nitrogen is indeed the more electronegative element of the two atoms and is pulling the electron density towards itself, and thus meaning that it should have a negative charge.
Although nitrogen is the more electronegative atom, it can be seen that carbon has the most negative charge. This is unusual, since it has been proven that nitrogen is pulling electron density away from it and can only be explained when the carbon electronegativity is compared to that of the hydrogen atoms. Carbon is slightly more electronegative compared to hydrogen, and thus pulls the electron density in the bond towards itself. There are three hydrogen atoms on each carbon, and so carbon can pull a large amount of electron density towards itself, making it quite negatively charged, more so than the nitrogen.
     1. (1.99118) BD ( 1) C   1 - H   2
                ( 63.47%)   0.7967* C   1 s( 26.42%)p 2.78( 73.53%)d 0.00(  0.05%)
                ( 36.53%)   0.6044* H   2 s( 99.95%)p 0.00(  0.05%)
                                            0.9997  0.0006 -0.0227 -0.0018 -0.0032
     2. (1.99118) BD ( 1) C   1 - H   3
                ( 63.47%)   0.7967* C   1 s( 26.42%)p 2.78( 73.53%)d 0.00(  0.05%)
                ( 36.53%)   0.6044* H   3 s( 99.95%)p 0.00(  0.05%)
                                            0.9997  0.0006  0.0059 -0.0221 -0.0032
     3. (1.99118) BD ( 1) C   1 - H   4
                ( 63.47%)   0.7967* C   1 s( 26.42%)p 2.78( 73.53%)d 0.00(  0.05%)
                ( 36.53%)   0.6044* H   4 s( 99.95%)p 0.00(  0.05%)
As shown above, the carbon can be seen to be contributing more electron density towards the C-H bond, thus allowing it to pull electron density towards itself.
[P(CH3)4]+
Similarly, the phosphorus atom donates a lone pair of electrons to the carbon of one of the methyl groups in the formation of a [P(CH3)4]+ cation. The phosphorus atom is then electron deficient and should be positively charged, and this can be seen in the NBO charge distribution, where it has a charge of +1.667 compared to -1.060 as seen in the carbon atom. It's positive charge is further amplified by it being electropositive compared to carbon and so electron density is pulled away from the phosphorus.
     1. (1.98385) BD ( 1) C   1 - H   2
                ( 64.78%)   0.8049* C   1 s( 24.88%)p 3.02( 75.08%)d 0.00(  0.04%)
                ( 35.22%)   0.5934* H   2 s( 99.95%)p 0.00(  0.05%)

     2. (1.98385) BD ( 1) C   1 - H   3
                ( 64.78%)   0.8049* C   1 s( 24.88%)p 3.02( 75.08%)d 0.00(  0.04%)
                ( 35.22%)   0.5934* H   3 s( 99.95%)p 0.00(  0.05%)

     3. (1.98385) BD ( 1) C   1 - H   4
                ( 64.78%)   0.8049* C   1 s( 24.88%)p 3.02( 75.08%)d 0.00(  0.04%)
                ( 35.22%)   0.5934* H   4 s( 99.95%)p 0.00(  0.05%)

     4. (1.98031) BD ( 1) C   1 - P  17
                ( 59.57%)   0.7718* C   1 s( 25.24%)p 2.96( 74.67%)d 0.00(  0.08%)
                ( 40.43%)   0.6358* P  17 s( 25.00%)p 2.97( 74.15%)d 0.03(  0.85%)
Again, carbon is the most negatively charged atom when compared to the rest of the molecule. It is more electronegative than both phosphorus and hydrogen and so contributes a higher amount to the respective bonds, contributing 64.78% in the C-H bond and 59.57% in the C-P bond. It can therefore pull electron density from all four bonds towards itself and the carbon from the [P(CH3)4]+ cation can be seen to be more negatively charged compared to the one on [N(CH3)4]+.
When comparing the difference in charge for both C-N and C-P bonds, it can be seen that there is a greater charge difference in the C-P bond due to the phosphorus orbitals being larger and more diffuse compared to that of nitrogen and so the overlap with carbon orbitals is not as good as it would be for nitrogen with carbon. This means that the nitrogen pulls electron density from the carbon via an inductive effect more effectively than phosphorus would to carbon and this results in the carbon/nitrogen charge distribution to be smaller compared to carbon/phosphorus.
[S(CH3)3]+
Sulfur has 6 valence electrons, 2 are used to bond to two methyl carbon atoms and the other four electrons exist as 2 lone pairs, one of which is donated to the third methyl carbon. This renders the sulfur positively charged and this can be seen in the NBO analysis. The NBO analysis of [S(CH3)3]+ is similar to that for [P(CH3)4]+, with the charge distribution for [S(CH3)3]+ being smaller due to the fact that S is slightly more electronegative than carbon, whereas phosphorus is electropositive with respect to carbon. This means that the sulfur atom pulls electron density away from the carbons and so the charge distribution of C-S is smaller than that of C-P.
     1. (1.98721) BD ( 1) C   1 - H   2
                ( 64.83%)   0.8051* C   1 s( 26.50%)p 2.77( 73.45%)d 0.00(  0.05%)
                ( 35.17%)   0.5931* H   2 s( 99.95%)p 0.00(  0.05%)

     2. (1.99412) BD ( 1) C   1 - H   3
                ( 64.23%)   0.8014* C   1 s( 27.24%)p 2.67( 72.71%)d 0.00(  0.05%)
                ( 35.77%)   0.5981* H   3 s( 99.95%)p 0.00(  0.05%)

     3. (1.98721) BD ( 1) C   1 - H   4
                ( 64.83%)   0.8051* C   1 s( 26.50%)p 2.77( 73.45%)d 0.00(  0.05%)
                ( 35.17%)   0.5931* H   4 s( 99.95%)p 0.00(  0.05%)

     4. (1.98631) BD ( 1) C   1 - S  13
                ( 48.67%)   0.6976* C   1 s( 19.71%)p 4.07( 80.16%)d 0.01(  0.14%)
                ( 51.33%)   0.7165* S  13 s( 16.95%)p 4.86( 82.41%)d 0.04(  0.63%)
Because the electronegativities of sulfur and carbon are very similar, the bond contribution from both elements is almost equal. As sulfur is slightly more electronegative, it contributes slightly more to the bond, at 51.33%.
[NR4]+ (R=alkyl)
[NR34]+ where R=alkyl is often depicted as having a formal positive charge on the nitrogen atom. This positive charge depicts the donation of a pair of electrons from the nitrogen atom to the carbon atom to form a C-N bond, leaving N "electron deficient". However, from our results for NBO anaysis, it can be seen that the hydrogen atoms carry the positive charge, not the nitrogen.
Influence of functional groups
Optimisation and Frequency Analysis
[N(CH3)3(CH2CN)]+
Optimisation File here
| summary data | convergence | Jmol | |||
|---|---|---|---|---|---|

|
         Item               Value     Threshold  Converged?
 Maximum Force            0.000000     0.000015     YES
 RMS     Force            0.000000     0.000010     YES
 Maximum Displacement     0.000012     0.000060     YES
 RMS     Displacement     0.000004     0.000040     YES
 Predicted change in Energy=-2.268931D-12
 Optimization completed.
    -- Stationary point found.
|
|
The cation [N(CH3)3(CH2CN)]+ was optimised using the B3LYP method and 6-31G (d,p) basis set with the additional keywords "integral=grid=ultrafine scf=conver=9 nosymm". The reasons for using these keywords have been explained previously. To confirm that optimisation had completed, the gradient was checked for a value close to zero (in this case, it is 0.00000010 a.u) and the summary output file was checked for complete convergence. As seen above, both requirements are met and thus optimisation is complete.
Frequency file here
| summary data | low modes |
|---|---|
|
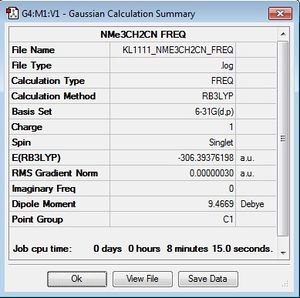
Low frequencies --- -4.9123 -1.8498 0.0009 0.0009 0.0010 5.0556 Low frequencies --- 91.6371 153.9755 211.4780 |
The optimised cation was checked to see if it was a minimum energy structure by observing the low frequencies. All frequencies are within ±15cm-1 of each other and the frequencies are positive, indicating a minimum point has been reached.
[N(CH3)3(CH2OH)]+
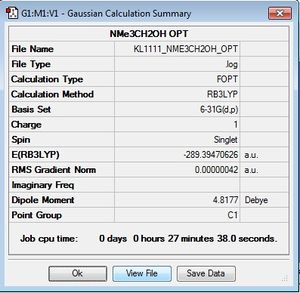
Similarly to [N(CH3)3(CH2CN)]+, the [N(CH3)3(CH2OH)]+ cation was optimised using the same method and basis set for the same reasons. Gradient was found to be close to zero and complete convergence was found, indicating optimisation had gone to completion.
Optimisation File here
| summary data | convergence | Jmol | |||
|---|---|---|---|---|---|
|
         Item               Value     Threshold  Converged?
 Maximum Force            0.000001     0.000015     YES
 RMS     Force            0.000000     0.000010     YES
 Maximum Displacement     0.000010     0.000060     YES
 RMS     Displacement     0.000002     0.000040     YES
 Predicted change in Energy=-4.983682D-12
 Optimization completed.
    -- Stationary point found.
|
|
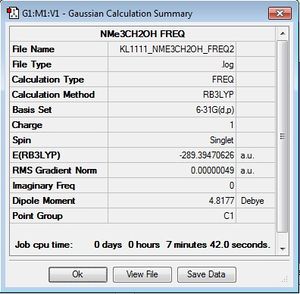
A frequency analysis was carried out to make sure the minimum energy structure was found. All low frequencies were found to be within ±15cm-1 of each other and the frequencies are all positive, indicating a minimum point.
Frequency file here
| summary data | low modes |
|---|---|
|
Low frequencies --- -9.6667 -8.1992 -4.7185 -0.0004 0.0009 0.0009 Low frequencies --- 130.7266 213.6672 255.6324 |
Population Analysis
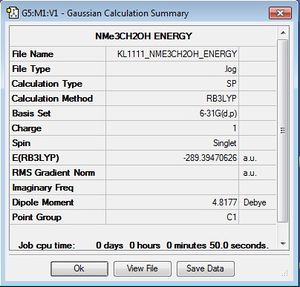
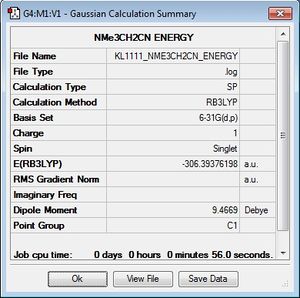
A population analysis was carried out on [N(CH3)3(CH2OH)]+ and [N(CH3)3(CH2CN)]+. The details for the analysis can be seen below:
| [N(CH3)3(CH2OH)]+ | [N(CH3)3(CH2CN)]+ |
|---|---|
| .log file .chk file | .log file .chk file |
|
|
Natural Bond Order Analysis
A natural bond order analysis was carried out on the two cations. The electronegativities of the atoms have been tabulated below to rationalise the charge distribution. The charge range was ±1.000 for all cations.
| H | C | N | O |
|---|---|---|---|
| 2.20 | 2.55 | 3.04 | 3.44 |
[N(CH3)3(CH2OH)]+
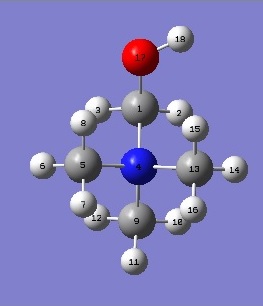
|

|
Nitrogen | Carbon | Hydrogen | Oxygen | ||||
|---|---|---|---|---|---|---|---|---|---|
| (4) | -0.322 | (1) | 0.088 | (2) | 0.237 | (17) | -0.725 | ||
| (5) | -0.491 | (3) | 0.249 | ||||||
| (9) | -0.492 | (14) | 0.262 | ||||||
| (13) | -0.494 | (6), (7), (10) | 0.266 | ||||||
| (12) | 0.269 | ||||||||
| (15) | 0.271 | ||||||||
| (16) | 0.272 | ||||||||
| (11) | 0.274 | ||||||||
| (8) | 0.282 | ||||||||
| (18) | 0.521 | ||||||||
This cation differs from [N(CH3)4]+ by only the presence of a hydroxyl group in place of a hydrogen on a methyl. Due to the presence of the electron donating OH group, the charge distribution has changed immensely, with oxygen becoming the most negatively charged atom in the cation. It thus pulls electron density away from carbon 1 and hydrogen 18, making these atoms more electropositive with respect to the other carbon and hydrogen atoms in the methyl groups. This effect can be seen under the NBO analysis, where oxygen is shown to contribute to 66.10% of the C-O bond and and 76.26% to the O-H bond.
       (Occupancy)   Bond orbital/ Coefficients/ Hybrids
 ---------------------------------------------------------------------------------
     4. (1.99697) BD ( 1) C   1 - O  17
                ( 33.90%)   0.5822* C   1 s( 23.71%)p 3.21( 76.04%)d 0.01(  0.24%)
                ( 66.10%)   0.8130* O  17 s( 32.28%)p 2.10( 67.64%)d 0.00(  0.08%)

    17. (1.98889) BD ( 1) O  17 - H  18
                ( 76.26%)   0.8733* O  17 s( 22.10%)p 3.52( 77.83%)d 0.00(  0.07%)
                ( 23.74%)   0.4872* H  18 s( 99.77%)p 0.00(  0.23%)
The nitrogen atom has donated its lone pair to one of the carbon atoms and form a C-N bond, making it electron deficient. The nitrogen should therefore be positively charged but from the NBO charge distribution, it can be seen that it is actually negatively charged, due to it being more electronegative than the carbon atoms and pulling electron density towards itself in an inductive effect. Both nitrogen and carbon orbitals are similar in size and so the inductive effect is expected to be significant due to good orbital overlap. As seen below, the nitrogen atoms contribute to approximately 66% of the bond, and the minor difference in contributions lead to the carbon atoms having very slight differences in charge.
       (Occupancy)   Bond orbital/ Coefficients/ Hybrids
 ---------------------------------------------------------------------------------
  3. (1.98195) BD ( 1) C   1 - N   4
                ( 32.72%)   0.5720* C   1 s( 20.28%)p 3.92( 79.55%)d 0.01(  0.18%)
                ( 67.28%)   0.8202* N   4 s( 23.48%)p 3.26( 76.49%)d 0.00(  0.03%)
  5. (1.98442) BD ( 1) N   4 - C   5
                ( 66.41%)   0.8149* N   4 s( 25.41%)p 2.93( 74.56%)d 0.00(  0.03%)
                ( 33.59%)   0.5796* C   5 s( 20.43%)p 3.89( 79.40%)d 0.01(  0.16%)
  6. (1.98455) BD ( 1) N   4 - C   9
                ( 65.93%)   0.8120* N   4 s( 25.64%)p 2.90( 74.33%)d 0.00(  0.03%)
                ( 34.07%)   0.5837* C   9 s( 20.99%)p 3.76( 78.85%)d 0.01(  0.16%)
  7. (1.98524) BD ( 1) N   4 - C  13
                ( 65.94%)   0.8120* N   4 s( 25.47%)p 2.92( 74.50%)d 0.00(  0.03%)
                ( 34.06%)   0.5836* C  13 s( 20.81%)p 3.80( 79.03%)d 0.01(  0.16%)
The carbon atoms are again more negatively charged compared to the nitrogen, due to it being more electronegative compared to the hydrogen atoms. The carbon atoms will therefore pull the electron density from 3 hydrogen atoms, making carbon negatively charged. This effect can be seen in carbon numbers 5, 9 and 13 and the bond contributions for carbon 1 have been tablulated below. Carbon 1 contributes to about 64% of the C-H bond and only 33.59% in the C-N bond.
       (Occupancy)   Bond orbital/ Coefficients/ Hybrids
 ---------------------------------------------------------------------------------
     5. (1.98442) BD ( 1) N   4 - C   5
                ( 66.41%)   0.8149* N   4 s( 25.41%)p 2.93( 74.56%)d 0.00(  0.03%)
                ( 33.59%)   0.5796* C   5 s( 20.43%)p 3.89( 79.40%)d 0.01(  0.16%)

     8. (1.99083) BD ( 1) C   5 - H   6
                ( 63.30%)   0.7956* C   5 s( 26.22%)p 2.81( 73.73%)d 0.00(  0.05%)
                ( 36.70%)   0.6058* H   6 s( 99.95%)p 0.00(  0.05%)

     9. (1.99048) BD ( 1) C   5 - H   7
                ( 63.32%)   0.7958* C   5 s( 26.47%)p 2.78( 73.48%)d 0.00(  0.05%)
                ( 36.68%)   0.6056* H   7 s( 99.95%)p 0.00(  0.05%)

    10. (1.99057) BD ( 1) C   5 - H   8
                ( 64.22%)   0.8014* C   5 s( 26.91%)p 2.71( 73.04%)d 0.00(  0.05%)
                ( 35.78%)   0.5982* H   8 s( 99.95%)p 0.00(  0.05%)
The last carbon, carbon 1 is positively charged due to the major electronegative elements nitrogen and oxygen being adjacent to it. Electron density is pulled away from the carbon by both atoms and so it is positively charged with respect to the other carbon atoms. In both cases, carbon only contributes to 32.2% in C-O and 33.90% in the C-N bond, implying that most of its electron density has been shifted over to the other atom in the bond.
       (Occupancy)   Bond orbital/ Coefficients/ Hybrids
 ---------------------------------------------------------------------------------
3. (1.98195) BD ( 1) C   1 - N   4
                ( 32.72%)   0.5720* C   1 s( 20.28%)p 3.92( 79.55%)d 0.01(  0.18%)
                ( 67.28%)   0.8202* N   4 s( 23.48%)p 3.26( 76.49%)d 0.00(  0.03%)
4. (1.99697) BD ( 1) C   1 - O  17
                ( 33.90%)   0.5822* C   1 s( 23.71%)p 3.21( 76.04%)d 0.01(  0.24%)
                ( 66.10%)   0.8130* O  17 s( 32.28%)p 2.10( 67.64%)d 0.00(  0.08%)
Interestingly, hydrogen numbers 2 and 3 are not as positive as one would expect, considering the fact that they are fairly close to the electronegative oxygen atom. By analyzing the Second Order Perturbation Theory Analysis section of the NBO output file, an explanation as to why this can be seen
                                                                            E(2)  E(j)-E(i) F(i,j)
         Donor NBO (i)                     Acceptor NBO (j)                 kcal/mol   a.u.    a.u.
 ===================================================================================================
  24. LP (   1) O  17                /134. BD*(   1) C   1 - H   2            3.97    1.02    0.057
  24. LP (   1) O  17                /135. BD*(   1) C   1 - H   3            1.21    1.04    0.032
  25. LP (   2) O  17                /134. BD*(   1) C   1 - H   2            0.83    0.75    0.023
  25. LP (   2) O  17                /135. BD*(   1) C   1 - H   3            2.97    0.77    0.043
  25. LP (   2) O  17                /136. BD*(   1) C   1 - N   4           18.96    0.51    0.088
  25. LP (   2) O  17                /139. BD*(   1) N   4 - C   9            0.58    0.56    0.016
Here, the oxygen lone pair is being donated into the anti-bonding orbital of C-H(2) and C-H(3) bond, making them more negative than expected. The total energy of these interactions is higher for H2 than H3 and this results in H2 being less positive than H3. There is also an interaction between the oxygen lone pair and the anti-bonding orbital of the C-N bond, implying delocalisation of lone pairs into the overall molecule, as expected of the electron withdrawing group of the hydroxyl group.
[N(CH3)3(CH2CN)]+
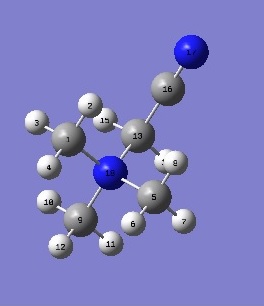
|
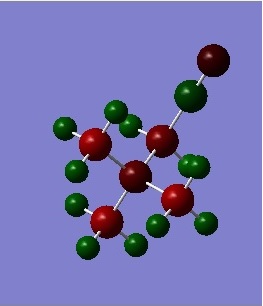
|
Nitrogen | Carbon | Hydrogen | |||
|---|---|---|---|---|---|---|---|
| (18) | -0.289 | (1) | -0.489 | (3),(7) | 0.269 | ||
| (17) | -0.186 | (5) | -0.489 | (10),(11) | 0.271 | ||
| (9) | -0.485 | (4),(6) | 0.274 | ||||
| (13) | -0.358 | (12) | 0.277 | ||||
| (16) | 0.209 | (2),(8) | 0.282 | ||||
| (14),(15) | 0.309 | ||||||
Nitrogen 18 is still the most negatively charged due to reasons explained previously. Nitrogen 17 is more electronegative than carbon 16 and so pulls electron density towards itself and has a charge distribution of -2.89, and it is similar to the nitrogen in [N(CH3)4]+ which was shown to have a charge distribution of -2.95.
              (Occupancy)   Bond orbital/ Coefficients/ Hybrids
 ---------------------------------------------------------------------------------
17. (1.99595) BD ( 1) C  16 - N  17
                ( 42.68%)   0.6533* C  16 s( 47.95%)p 1.09( 52.03%)d 0.00(  0.02%)
                ( 57.32%)   0.7571* N  17 s( 45.15%)p 1.21( 54.49%)d 0.01(  0.36%)
Nitrogen 17 is shown to be contributing to 57.32% of the CN σ bond. One would expect a higher contribution difference due to the electronegativity difference. However, delocalisation of the lone pair on nitrogen to the anti-bonding orbital of the C(13)- C(16) bond, making the nitrogen not as negative as expected.
                                                                            E(2)  E(j)-E(i) F(i,j)
         Donor NBO (i)                     Acceptor NBO (j)                 kcal/mol   a.u.    a.u.
 ===================================================================================================
27. LP (   1) N  17                /156. BD*(   1) C  13 - C  16           12.71    0.94    0.098
Nitrogen 18 draws electron density away from carbon 13 in an inductive effect and it contributes a high 64.52% to the bond, making carbon 13 very positive.
16. (1.97747) BD ( 1) C  13 - N  18
                ( 35.48%)   0.5956* C  13 s( 20.81%)p 3.80( 79.05%)d 0.01(  0.14%)
                ( 64.52%)   0.8033* N  18 s( 24.08%)p 3.15( 75.88%)d 0.00(  0.04%)
Carbon 13 is attached to only 2 hydrogen atomss whearas carbons 1, 5 and 9 are attached to three hydrogen atoms. Carbon 13 therefore draws less electron density compared to the other carbon atoms and thus is more positively charged with respect to them.
HOMO and LUMO comparison
| [N(CH3)4]+ | [N(CH3)3(CH2CN)]+ | [N(CH3)3(CH2OH)]+ | |
|---|---|---|---|
| LUMO | 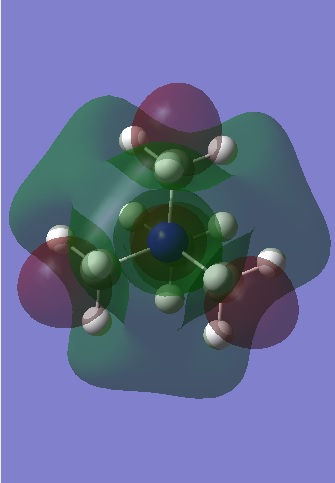
|
|
|
| Energy (a.u) | -0.13302 | -0.18182 | -0.12459 |
| HOMO | 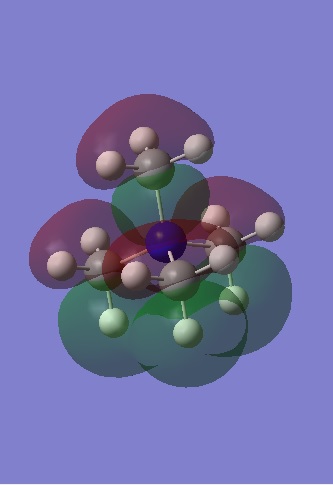
|
|

|
| Energy (a.u) | -0.57934 | -0.50047 | -0.48764 |
| HOMO-LUMO Gap (a.u) | 0.44632 | 0.31865 | 0.36305 |
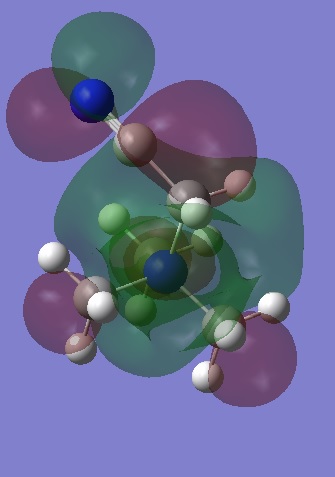
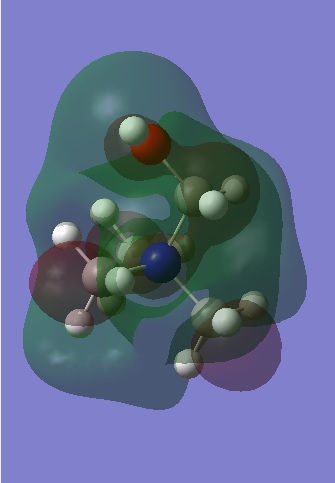
Observation of the LUMOS show that they are very delocalised, with electron density spread over the whole molecule. In [N(CH3)4]+, there are major anti-bonding interactions present and these are focused primarily around the nitrogen atom and the methyl hydrogens. With the [N(CH3) 2CH2CN]+ cation, the presence of the electron withdrawing CN group has changed the shape of the LUMO significantly, with the electron density of the molecule becoming more compact as the CN group draws electron density from the molecule to itself. The anti-bonding interactions seen in the methyl groups are also reduced and this results in the LUMO of [N(CH3) 2CH2CN]+ being the most stable of the three.
In contrast to this, the LUMO has become more diffuse when a hydroxyl group is added to [N(CH3)4]+. This electron donating group is pushing electron density towards the rest of the molecule and an expansion in the green electron density can be seen. There are also weak through space anti-bonding interactions between the central nitrogen, the carbon and the oxygen atoms (N-C-O) and this has increased the energy of the LUMO, making it less stable with respect to the other two cations.
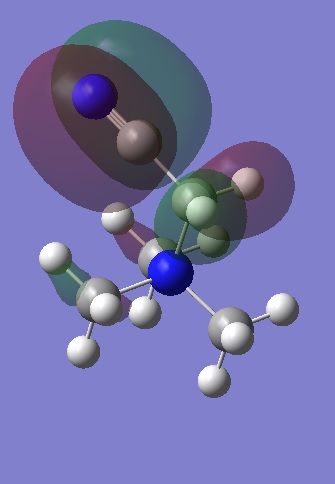
The HOMOs are localised compared to the LUMOs and this is especially true for [N(CH3) 2CH2CN]+ and [N(CH3) 2CH2OH]+ where the presence of the electron donating OH group has resulted in a smaller bonding interaction between the methyl groups and a large anti-bonding interaction between the oxygen lone pair and the CH2 fragment. Although it is an occupied MO, it appears to be anti-bonding and explains why the energy of the cation is less stable than for [N(CH3)4]+. For [N(CH3) 2CH2CN]+, most of the electron density is found on one half of the cation as expected due to the presence of the electron withdrawing CN group. Most of the interactions occurring between the central nitrogen atom and the methyl groups appear to be non-bonding, and so it appears that the strong bonding interaction between the C and N p orbitals contribute more than the weak through space anti-bonding interactions between the CN π bond and the CH2, and may explain why the energy of [N(CH3) 2CH2CN]+ is in between that of the other two cations.
The HOMO-LUMO gap is largest for [N(CH3)4]+, followed by N(CH3) 2CH2OH]+ and N(CH3) 2CH2CN]+. The difference in HOMO-LUMO gap has the biggest impact on the reactivity of the cation, with a larger gap corresponding to a more stable cation. The energy of the LUMO may also change the reactivity, as it is easier to add electron density to cations of lower LUMO energy and would suggest that N(CH3) 2CH2CN]+ is easiest to react with anions.
Conclusions
An optimisation was carried out on the cations [N(CH3)4]+, [P(CH3)4]+ and [S(CH3)3]+ was carried out using the B3LYP method and 6-31G (d,p) basis set. A frequency analysis was then carried out to ensure that a minimum energy structure had been achieved. Most of the frequencies obtained were within 15cm-1 of each other and were postivie, indicating that optimisation was carried out successfully.
The geometries of the three cations were then examined and it was shown that [N(CH3)4]+ had the shortest bond length due to similar electronegativites of N and C, leading to good orbital overlap and shortening of the bond length. Both [N(CH3)4]+ and [P(CH3)4]+ were shown to have a bond angle typical of trigonal planar species but [S(CH3)3]+ did not, instead taking on a form that had a smaller bond angle due to the lone pair on the S atom which causes more repulsion and pushes the bond pair electrons closer to each other.
A population analysis was carried out and from this, the MO and NBO calculations were obtained. For [N(CH3)4]+, the non-core occupied MO were analysed and the energy of the MOs was quantified by the strength of the interaction between orbitals and the delocalisation of electron density within the molecule.
The NBO charge analysis was compared across the three cations and it was shown that N was more electronegative than C so drew electron density away from the neighbouring carbon atoms. The attached carbon atoms were also shown to be negatively charged, despite being bonded to the more electronegative element nitrogen due to the carbon pulling electron density away from three hydrogen atoms. Both P and S were shown to be positively charged due to them being electropositive with respect to carbon. The hydrogen atoms are therefore the atoms on which the positive charge is formally carried on a [NR4]+ cation.
[N(CH3)4]+ was then modified by addition of the electron withdrawing group CN or the electron donating group OH. These cations were optimised as before and a frequency analysis carried out to ensure complete optimisation. The MOs were compared across the three cations and it could be seen that the presence of an electron withdrawing group stabilised the LUMO of the cation, making it more it reactive towards anions. The presence of an electron donating group lead to destabilisation of the LUMO, making it more difficult to add electron density towards it.
These calculations were carried out in order to predict the properties of ionic liquids as designer solvents. Since there are many ions that exist, it is possible to modify the properties of a solvent by use of different combinations of ions. It has been shown that the use of an electron withdrawing group on a cation helps to decrease the energy of the LUMO, and thus making it easier to react with anions. By adjusting these parameters, desirable properties such as being non-flammable, non-volatile and non-toxic can be achieved and so there is major interest in discovering the best combination of ions in order to get the best solvents for a particular reaction.
References
- ↑ I. Newington, J. M. Perez-Arlandis and T. Welton, Org. Lett., 2007, 9, 5247–50.
- ↑ M. Freemantle, An Introduction to Ionic Liquids, 1 edition., 2009.
- ↑ E. a Trush, O. V Shishkin, V. a Trush, I. S. Konovalova and T. Y. Sliva, Acta Crystallogr. Sect. E. Struct. Rep. Online, 2012, 68, o273.
- ↑ J. C. Kotz, G. C. Weaver and P. M. Treichel, Chemistry & Chemical Reactivity: Enhanced Review Edition, 6th ed., 2006.
- ↑ V. P. Schnee, The Characterization of Cationic Pseudostationary Phases for Electrokinetic Chromatography, 2007.
- ↑ 1 F. A. Carey and R. J. Sundberg, Advanced Organic Chemistry: Part A: Structure and Mechanisms, 2008.
- ↑ 7.0 7.1 ARUN, S. (n.d.). Living Science Chemistry 10 (p. 164). Ratna Sagar.

