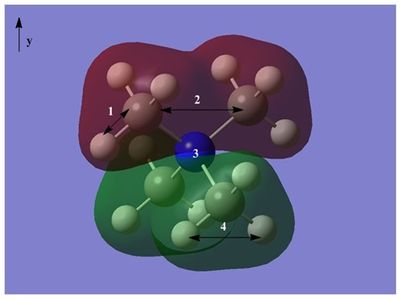
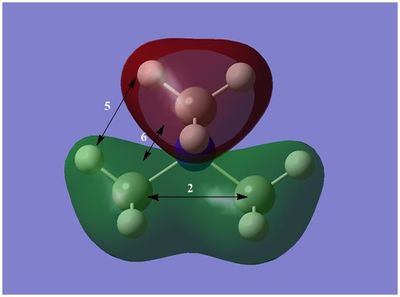
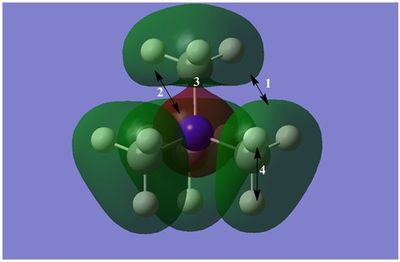
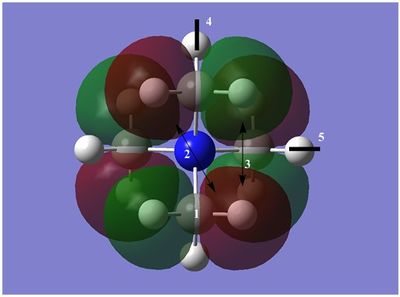
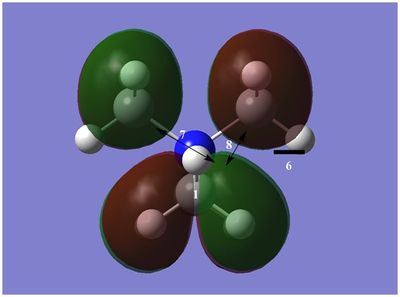
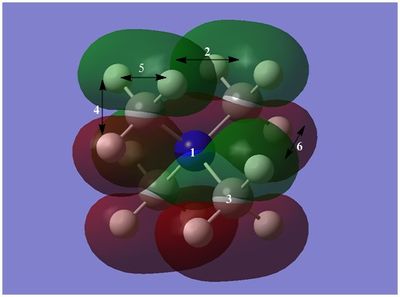
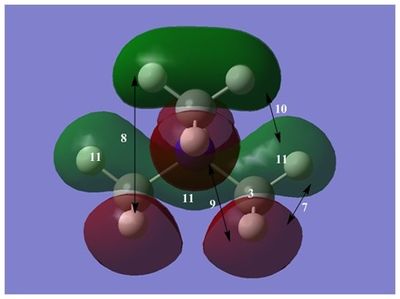
Rep:Mod:kkin1904
Bonding and Molecular Orbitals in Main Group Compounds
In this computational experiment different main group compounds were created in GaussView and then optimised using variety of basis sets. The frequency analysis was carried out on a number of compounds to ensure the minimum energy structure was found. It also provided the IR spectra of these compounnds. The molecular orbitals were also visualised by carrying out populations analysis. The mini project about ionic liquids involved the analysis methods mentioned above.
Creating a Molecule
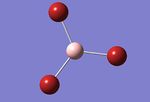
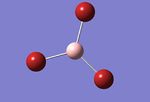
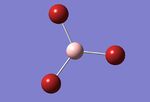
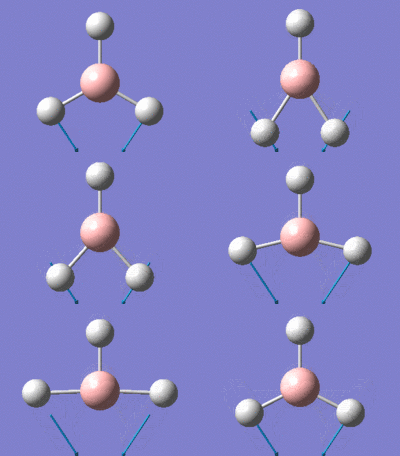
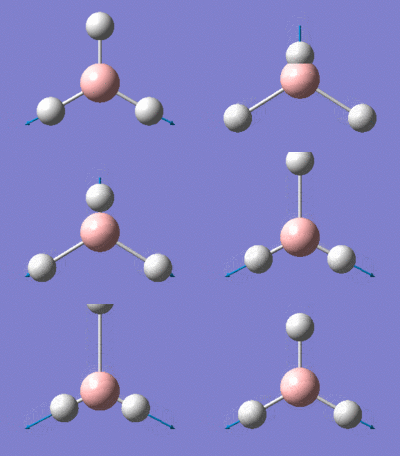
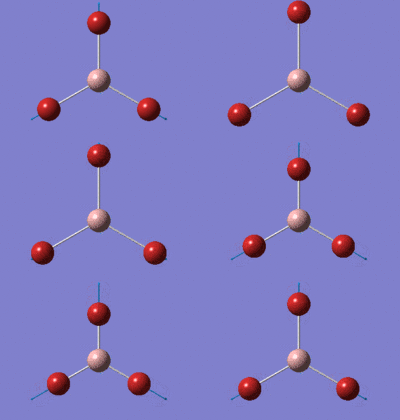
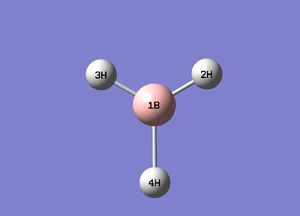
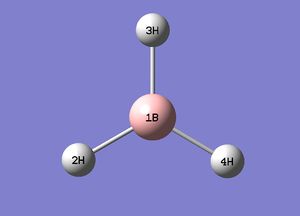
In the first part of this computational experiment, the basic techniques of using GaussView were studied. Borane molecule was created in GaussView and all the main manipulations(rotation, translation, changing size) were tried on the molecule. The bond lengths were also varied. For borane 1, one of the B-H bonds was set to be 1.50 Å. For borane 2, all of the B-H bond lengths were varied.B-H(2) bond was set to 1.53 Å, B-H(3) to 1.54 Å, and B-H(4)to 1.55 Å. The images of borane 1 and borane 2 are given below:
| Borane 1 | Borane 2 |
|---|---|
 |
 |
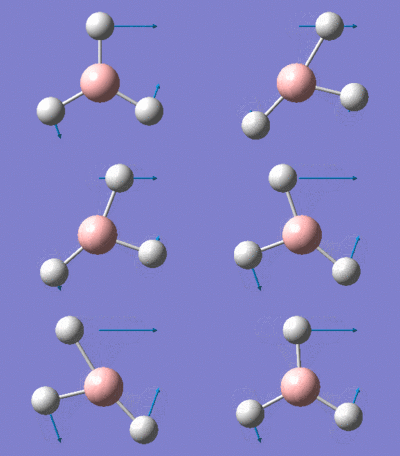
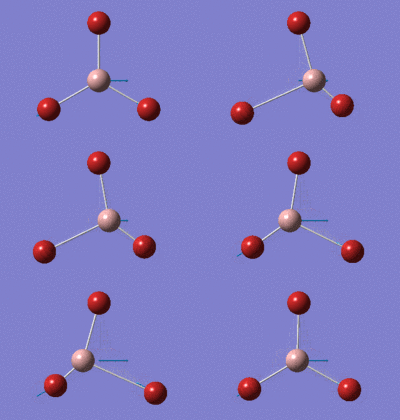
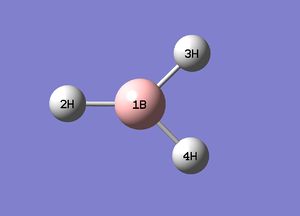
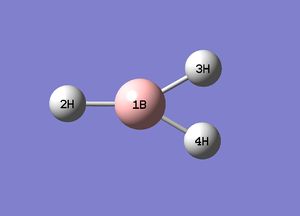
The angle between bonds in borane molecule was also varied. The angle 3H-1B-4H was changed from 120o to 90 and 60o.
| Borane 90o | Borane 60o |
|---|---|
 |
 |
Optimising a Molecule of BH3 and analysing the output
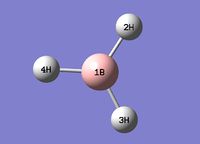
Borane 2 molecule was optimised in Gaussian using B3LYP calculation method and 3-21G basis set. The technique used for calculations is DFT (density functional theory). The optimisation log. file can be found here. The main information about the optimisation results can be viewed here. The optimisation was successful as gradient is close to zero (0.00008855 Hartrees/Bohr) and the stationary point was found with forces and displacements converged(link to converged data). The bond distances and angles were also found for the optimised BH3 molecule. The table which summarises the findings is given:
| Bonds | Bond distances (Å) | Bonds | Bond angles (o) |
|---|---|---|---|
| B-H(2) | 1.19 | H(2)-B-(H(3) | 120.0 |
| B-H(3) | 1.19 | H(2)-B-H(4) | 120.0 |
| B-H(4) | 1.19 | H(3)-B-H(4) | 120.0 |
It is known that the symmetry point group for for BH3 molecule is D3H, but Cs point group was obtained from calculations. This is because the bond distances and angles were slightly different. As a result the symmetry breaking occured and the symmetry was reduced.
Understanding the Optimisation
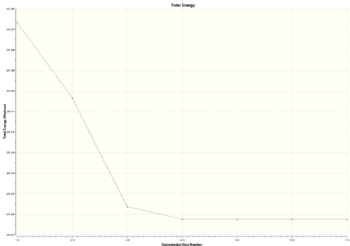
An optimisation is the procedure which tries to find the lowest energy configuration of a particular molecule. It uses a set of wave functions (basis sets) which desribe the orbitals and from which the energy can be calculated. During optimisation the energy is calculated relative to the positions of atoms, and from this the force(first derivative of potential energy surface) on atoms can be calculated. The stationary point is where there are no forces acting on atoms and that is an equilibrium position with the smallest energy . In optimisation the energies and gradients of intermediate structures can also found. Two graphs can be obtained from the optimisation results which show how the total energy and RMS gradient changes at different steps. Seven steps/structures were shown. The graphs look like this:
 |
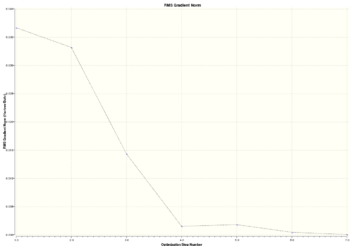 |
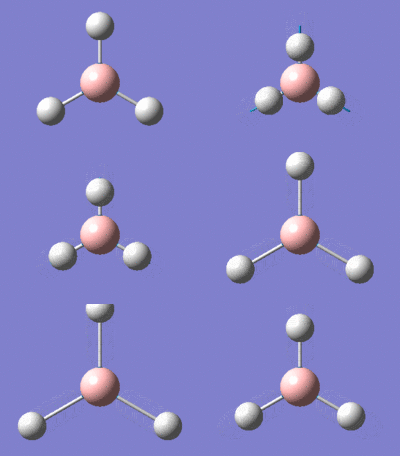
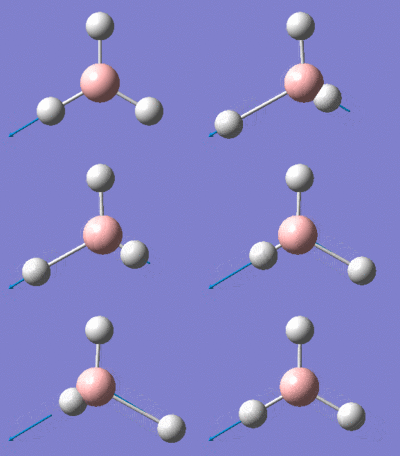
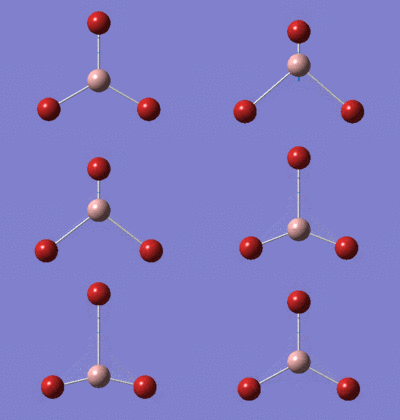
As can be seen in the graphs above, there is a big change of total energy and gradient in the first 4 steps of optimisation. In the first(starting) step the 'bond' lengths are the same as were set for borane 2 molecule(see above). In the second step, the H atoms have moved slightly closer to the B atom by a distance of about 0.09 Å, the electron-nucleus attraction has increased but the energy of molecule has decreased. The RMS gradient has decreased. From the second to the third step there has been a big decrease in B-H radius and that mirrors the decrease in energy and RMS gradient.In the fourth step, the H atoms move even closer to the B atom(distance slighly larger than 1.19Å) decreasing the energy by attraction forces and forming a bond(see images below). During these steps the bond lengths decreased with different rate as starting bond lengths were different. After step 5 the bond lengths decreased even further(below 1.19 Å). However, this time the atoms are experiencing nucleus-nucleus repulsion and energy and gradient increase slightly as can be seen in the table below. After this step, the bond distance increases slightly , energy and gradient decrease and the optimised structure is found at 7th step.
An interesting feature was observed during this optimisation. The structure in step 1 from the table has the same bond lengths as borane 2 which was the starting structure before optimisation. However, the bonds are drawn only for borane 2. Furthermore the structures in the first three steps of optimisation don't have 'bonds'. This leads us to the term - bond. In quantum mechanical terms and in MO theory, the bond can be described as a region of where atomic orbitals overlap and interfere constructively. It means that that there is a high probablity of finding the electron between two nucleus. Another reasonable explanation could be that bond is formed when resulting molecule is lower in energy than the sum of its constituent atoms. An energy is lowered because there is a strong attraction between electrons and nucleus. But why the bonds were not drawn between the B and H atoms? If the bond is not drawn that doesn't necessarily mean that there is no bond. There still may be favourable electrostatics between nucleus and eletrons. The Gaussian programme most probably uses predefined bond distances which are drawn at specific distances between atoms. It could also depend on the method/basis set used, as basis set is a set of wavefunctions which describes the behaviour of the electrons.
Using a better basis for better optimisation of BH3
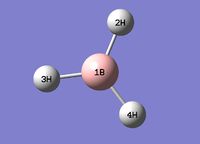
To obtain even more optimised geometry of BH3, higher basis set can be used. First optimisation was carried out using 3-21G basis set. 6-31G(d,p) basis set was used for further optimisation. The log file can be found here. The total energy of the optimised BH3 molecule was -26.61532363 Hartrees. The value of gradient was very close to 0 (0.00000687 Hartrees/Bohr) and forces converged in the final structure, indicating that the optimisation was carried out well and the most stable structure using this basis set was obtained('Item' table). The symmetry point for this structure is also Cs. The summary of results can be found in this link.
As mentioned above, the symmetry of the optimised BH3 molecule is Cs and not D3H. This is because the bond angles and lengths are slightly different and the symmetry breaking occurs lowering the symmetry.
| Bonds | Bond distances (Å) | Bonds | Bond angles (o) |
|---|---|---|---|
| B-H(2) | 1.19 | H(2)-B-(H(3) | 120.0 |
| B-H(3) | 1.19 | H(2)-B-H(4) | 120.0 |
| B-H(4) | 1.19 | H(3)-B-H(4) | 120.0 |
The graphs of total energy and RMS gradient vs steps are given:
 |
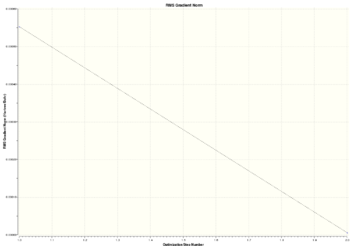 |
The optimisation was done in two steps only. The gradient and energy are lower in second step which means that optimisation was successfull and the optimised structure is more stable. The information about structures from the two steps is given in table:
| Steps | Total energy (Hartree) | RMS Gradient Norm (Hartree/Bohr) | Structure |
|---|---|---|---|
| 1 | -26.61531641 | 0.00055336 |  |
| 2 | -26.61532362 | 0.00000687 |  |
Larger Pseudo-potentials and Larger Basis Sets
Creating and Optimising a Molecule of GaBr3
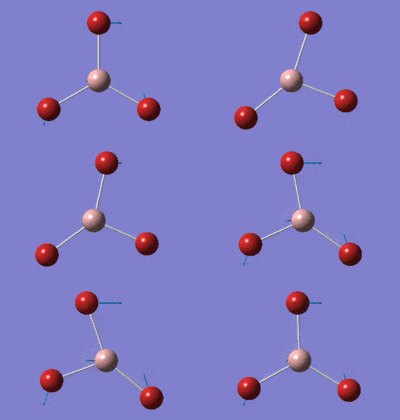
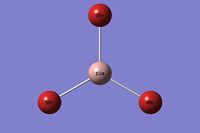
GaBr3 molecule was created in GaussView. Point group D3h was chosen manually and optimisation was run using LanL2DZ basis set. This is a medium level basis set which uses pseudopotentials for elements heavier than 1st row elements. The term pseudopotential basically is the effective core potential and is used to account for the energy differences made by core electrons. It is widely used for heavy atoms where the relativistic effects need to be cosidered.[1] The information about the calculations can be viewed in the log file here. The point group remained D3h as manually chosen and the total energy of resulting structure was -41.70082783 Hartrees. The summary of calculations can be seen here. The optimised structure was obtained successfully in three steps as the forces converged(the table of converged data- link) and gradient was found to be 0.00000016 Hartrees/Bohr.
| Bonds | Bond distances (Å) | Bonds | Bond angles (o) |
|---|---|---|---|
| Ga-Br(2) | 2.35 | Br(2)-Ga-Br(3) | 120.0 |
| Ga-Br(3) | 2.35 | Br(2)-Ga-Br(4) | 120.0 |
| Ga-Br(4) | 2.35 | Br(3)-Ga-Br(4) | 120.0 |
As can be seen from the above table, the bond distances and angles are all the same and no symmtery breaking occurs so molecule adopts D3h point group.
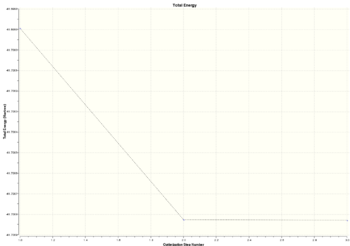 |
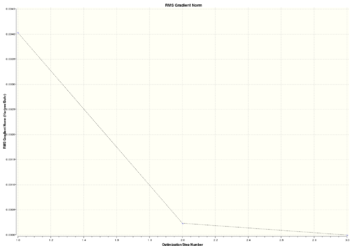 |
The optimisation was done in three steps. Steps 1 to 2 involved the largest difference in energy and gradient. The bond distances between Ga and Br atom in each step decreased and the energy also decreased indicating attraction between nucleus and electrons.
Creating and Optimising a molecule of BBr3
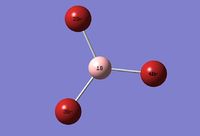
The optimised molecule of BH3(with basis set 6-31G(d,p)) was used to as a starting molecule for creation of BBr3, in other words the H atoms were replaced by Br atoms. The input file using GEN basis set was created and the file was submitted on HPC system(DOI:10042/26106 ). The total energy of the optimised structure was -64.43644995 Hartrees. (the summary of the calculations can be viewed here). The small gradient of 0.00001175 Hartrees/Bohr. indicates that a stationary point was found and the most stable structure was obtained using this specific basis set. Forces and displacements converged (link).
The bond distances and angles can be found in the table below:
| Bonds | Bond distances (a.u.) | Bonds | Bond angles (o) |
|---|---|---|---|
| B-Br(2) | 1.93 | Br(2)-B-Br(3) | 120.0 |
| B-Br(3) | 1.93 | Br(2)-B-Br(4) | 120.0 |
| B-Br(4) | 1.93 | Br(3)-B-Br(4) | 120.0 |
Bond distances and angles vary slightly between different bonds and that is the reason why the molecule has Cs point group but not D3h. As with some previous examples, the symmetry braking principle also applies here.
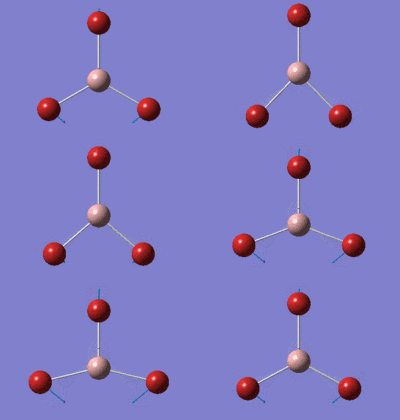
The optimisation consisted of three steps. The graphs of total energy and gradient vs steps are provided to show how these variables change.
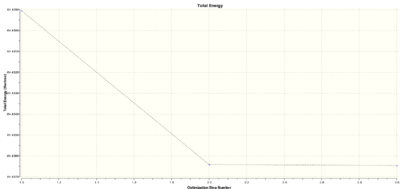 |
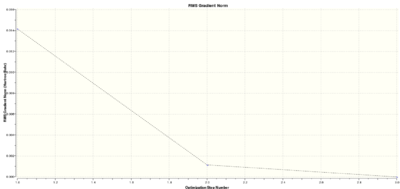 |
The energy, gradient and bond distances decreased in each step, meaning that the attractive interaction between nucleus and electrons increased until the most stable configuration was obtained in the 3rd step.
Analysis of the Results
Three different molecules were optimised using various basis sets. BH3 was optimised using 3-21G and 6-31G(d,p) basis sets. For GaBr3 LanL2DZ basis set was used, but for BBr3-GEN basis set. The bond lengths for each of the molecules were found and they the average bond lengths are summarised in table.
| Molecule | Calculated bond distances (Å) | Literature bond distances (Å) |
|---|---|---|
| BH3(3-21G) | 1.19(5) | 1.19[2] |
| BH3(6-31G) | 1.19(2) | 1.19[2] |
| BBr3 | 1.93 | 1.89[3] |
| GaBr3 | 2.35 | 2.24[4] |
Bond lengths for the molecules in the literature were given in gas phase and also the optimised structures have bond lengths which are the lengths in the gas phase. As can be seen from the table, the literature values are smaller than computed ones. When optimising the structures, the largest basis set were not used and that could be a reason why computed values are slightly different than literature values. Using larger basis sets for calculations would possibly give closer values to the ones found in literature. The quantum mechanical calculations were carried out based on few approximations and that could also affect the outcome. One of them is Born-Oppenheimer approximation in which it is assumed that nuclei are fixed and Schrodinger equation is only solved for electrons. For BBr3 and GaBr3 the pseudopotential approxiamtion is also used as they consist of heavy elements and many electrons. GaBr3 literature and computed values differ the most as this molecule is the largest and consist of the most electrons. As molecules get larger, the calculations get harder and are more affected by approximations.
Another reason could be the interactions between empty central atom p-orbital and ligand orbitals which make the bonds shorter. B and Ga are both electron deficient. In case of BBr3 and GaBr3, the electron deficiency can be partially removed by Br-B π type interactions. This π 2p-2p overlap makes the bonds shorter than expected.
Ligand Effect on Bond Distances
The bond lengths of BH3 and BBr3 molecules are 1.19 Å and 1.93 Å respectively. B is group 13, period 2 element. From VSEPR the BX3 species are trigonal planar. H is group 1, period 1 element but Br is group 17, period 4 element and is much larger than H atom. Both H(1s1) and Br(1s2, 2s2, 2p6, 3s2, 3p6, 3d10, 4s2, 4p5) have 1 unpaired electron in their outer shell. Sigma bond is formed by the overlap of B 2s atomic orbital with 1s orbital of H and s type orbitals of Br. The strongest and shortest bonds are formed when there is a large overlap between the orbitals and the orbitals involved in bonding are dense. The direction of interacting orbitals also are important-more directed overlap gives stronger bonds. So the best overlap is obtained when the interacting orbitals are small and similar size. The Br atom is large and it has large, more diffuse s and p orbitals, the overlap with B 2s and 2p orbitals is worse compared to H 1s orbitals. As a result of poorer overlap, the bonds are weaker and longer. The difference between the bond lengths could be even larger if there wouldn't be additional Br-B π interactions. The σ s type bonding has the largest effect on the bond lengths as this bond is formed from s orbitals which are the most dense and smallest orbitals and gives the largest overlap integral.
The electronegativity of atoms also affect the overlap of atomic orbitals. Large electronegativity difference between atoms means that the interacting orbitals have very different energies, therefore the orbital size is very different and the overlap is poor. For BH3 the electronegativity difference between H and B is small(0.1) and atomic orbitals lie close in energy(see section 'Molecular Orbitals of BH3'). There is quite large difference in electronegativity (0.8) between Br and B. The the B-Br bonds are more polar than B-H bonds because of the electronegativity difference. This means that more electron density is closer to to Br atom in B-Br bond and electron density. The electron distribution in B-Br bond is also affected by quite large polarizabilty of the large Br atom. The polarizabilty makes the Br atomic orbitals less dense and therefore gives poorer overlap with B atomic orbitals.
Central Atom Effect on Bond Distances
The bond distance of BBr3 is 1.93 Å but bond distance of GaBr3 is longer-2.35 Å. As they both have Br ligands the difference in bond lengths can be explained by the nature of central atom. B and Ga are both group 13 elements, B is in period 2 but Ga is in period 4. They both are have trigonal planar structures. The σ bond is formed when B and Ga s type atomic orbitals overlap with Br s and pσ atomic orbitals with the right symmetry. It is difficult to tell without explicit calculations between which two atoms the overlap is better, but the bond lengths show that overlap is better for B-Br bonds. The atomic radii of B is 88 pm, Ga-140 pm but Br 114 pm.[5] The difference in size of radius in both cases is the same(26 ppm) and this is a rough indicator that orbital match in terms of size difference is somehow similar. However,even if the orbital match is roughly the same (neglecting spacing between interacting atomic orbitals),the Ga-Br bonds still should be longer because larger, more diffuse orbitals have less efficient overlap compared to smaller orbitals. The same principles apply to p-p π orbital overlap. Ga also has larger radius so it is further away from Br. The Ga atom is less electronegative than B, so we could expect that energy difference between Ga and Br atomic orbitals is larger compared to B and Br. However, Ga is in the same row as Br and they both have higher energy atomic orbitals than B. In general, it is difficult to say what is the relative ordering of the interacting atomic orbitals(for Br probably the fragment orbitals) without explicit calculations so it is hard to evaluate the effect of electronegativity. But there are some factors that could contribute towards stronger B-Br bond. Firstly it is the quite large electronegativity of Br, which means that its orbitals are much lower energy than Ga orbitals and possibly are quite close to B atomic orbitals. Secondly, the Br atomic orbitals lie close to each other(especially the frontier orbitals) as it is quite polarizable atom. So for Ga and Br the size difference between the overlapping orbitals is larger than for B and Br, therefore poorer overlap is obtained and that results in longer bonds. Ga is more polarizable than B and so the shape of orbitals is more affected by electric field.
Frequency Analysis of BH3
The frequency analysis was carried out on already optimised BH3(6-31G(d,p)) molecule(log. file). The summary of the calculations can be found here. The spectrum is given in next section ('Comparison between BH3 and GaBr3 vibrational frequencies').
In optimisation the stationary point on potential energy surface is found but that doesn't necessarily mean that this stationary point is the minimum point. The optimisation could also found a saddle point(transition state). Frequency analysis can be used as a check if the found point is not a transition state. Frequency is a second derivative of the potential energy surface and if the computed frequencies are positive then the minimum point was found but if negative-the transition state. It can also further optimise the structure. It is very useful because it provides the information about vibrational modes and gives IR and Raman spectra which can be used for comparison with spectra obtained in laboratory.
The frequency analysis was carried out on already optimised structure with the same basis set and method. Vibrational analyis can only be carried out when the minimum point is found with gradient 0. So vibrational analysis is highly dependent on the optimisation and the basis set used. As mentioned above, in optimisation the minimum energy of the molecule can be found but this minimum energy may not necessarily be the energy of the global minimum stationary point(the lowest energy structure). Optimisation stops when a stationary point is found. This means that there could be local and global minimum points. For example, if the local minimum point is found using specific method/basis set when optimising, different minimum point(e.g. global) could be found using different method/basis set. The frequency analysis is carried out around the minimum point so it is important to use the same method/basis set for optimisation and frequency analysis.
The low frequency values from calculation are provided below:
Low frequencies --- -0.9429 -0.8599 -0.0054 5.7534 11.7286 11.7665
Low frequencies --- 1162.9964 1213.1826 1213.1853
The top line of the 'low frequencies' lines tells how the centre of mass moves. It represents the translational and rotational modes of the molecule. The 3 smallest frequencies of the top line could represent translational motion of the molecule as a whole, but 3 largest of the top line could be rotational modes of the molecule. All the frequencies from the top line should be close to 0, if they are smaller than 0, that only means that frequencies are imaginary. The bottom line of the two 'low frequencies' lines shows the lowest real frequencies. These have to compared to the real frequencies given later in the log file. If they differ then these vibrational modes consist of some rotational/translational modes.
All frequency values were positive, which means that most stable ground state structure was found. The table which summarises the information from vibrational analysis is given (calculated frequencies).
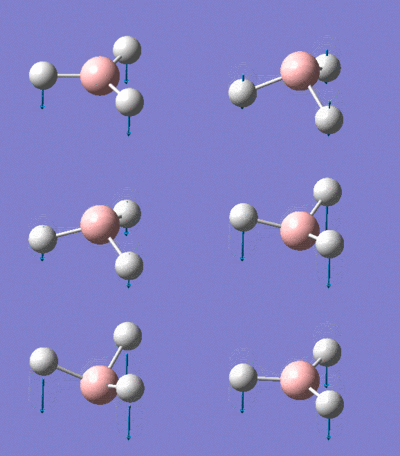
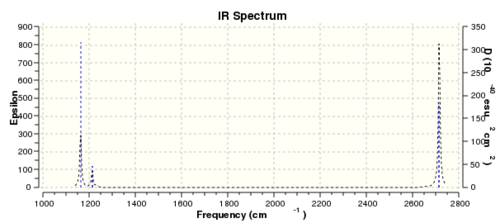
As BH3 is non-linear molecule with N=4 it has 3N-6=6 normal vibrational modes. Six vibrational modes were also obtained from computer calculations. However, only three modes can be observed in IR spectrum above. The selection rule for modes to be IR active requires the change in dipole moment when the atoms are displaced relative to each other. Vibrational mode 4 is IR inactive and has 0 intensity because the stretches are symmetric and dipole moments cancel out. There also are some degenerate vibrational modes-2 and 3; 5 and 6. Each of the doubly degenerate modes have the same intensity and frequency, therefore they are shown as a single peak in IR spectrum. Only three peaks are observed in IR spectrum because there are two pairs of degenerate modes and one IR inactive mode.
Frequency Analysis of GaBr3
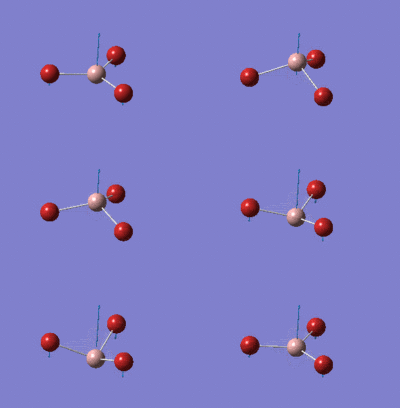
The previously optimised structure of GaBr3(with LanL2DZ basis set) was used for frequency analysis(log. file can be found here). All the main information about the optimised structure can be viewed in this link. As for BH3 all the frequencies were positive(they can be found here). The spectrum is given in next section ('Comparison between BH3 and GaBr3 vibrational frequencies').
The low frequency values varied only slightly. The obtained values are given below:
Low frequencies --- -0.5252 -0.5247 -0.0024 -0.0010 0.0235 1.2010
Low frequencies --- 76.3744 76.3753 99.6982
The lowest energy vibrational modes are degenerate asymmetric bending modes with frequency of 76 cm-1.
In general, the modes of GaBr3 are very similar to the BH3 vibrational modes. The main difference is that Ga atom is vibrating in much larger amplitude compared B atom. This could be because Br atoms are heavy atoms and they tend to move less than ligther atoms. B is heavier than H and so it also moves less than H atoms.
Comparison between BH3 and GaBr3 vibrational frequencies
| Number | Frequency of BH3(cm-1) | Symmetry label BH3 | Frequency of GaBr3(cm-1) | Symmetry label GaBr3 |
|---|---|---|---|---|
| 1 | 1163 | A2" | 76 | E' |
| 2 | 1213 | E' | 76 | E' |
| 3 | 1213 | E' | 100 | A2" |
| 4 | 2582 | A1' | 197 | A1' |
| 5 | 2715 | E' | 316 | E' |
| 6 | 2715 | E' | 316 | E' |
The table above summarises the frequencies and symmetry labels of the frequencies. The frequencies of BH3 are much larger compared to NH3. Some theory has to be considered in order to explain this. The molecular vibrations can be described by harmonic and anharmonic oscillators. The simplest model which describes the vibrations is for diatomic molecules and is modeled as harmonic oscillator. But it still can be used to explain the large differences in frequnecies for both spectra. The formula is given below:
The formula describes the energy difference between 2 vibrational levels which gives rise to the spectral lines in spectra. The components which affect the energy of the transitions are kf(force constant;measure of the strength of the bond) and meff(effective mass). In the case of BH3 it becomes more complicated because now the force constant and effective mass can be defined for each specific mode. The meff is a complicated function of the masses of the atoms. For diatomic molecule meff=m1m2/(m1+m2),so larger atoms should give larger meff. From the formula larger meff gives smaller energy. So using this simple model, it can be explained why Ga-Br had smaller frequencies. Another factor is kf.It was earlier found that B-H bond distance is 1.19 Å but Ga-Br is 2.35 Å. This means that Ga-Br bonds are much weaker than B-H bonds and has smaller kf. Smaller kf gives smaller frequencies hence the difference in spectra between BH3 and GaBr3. For species with weak bonds the vibronic levels are closely separated therefore smaller frequencies are observed.
 |
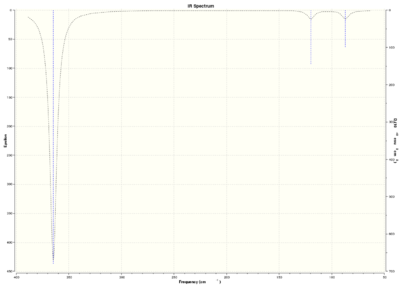 |
The BH3 and GaBr3 both are trigonal planar molecules with the same number of atoms so the number of normal modes are 6. For both species there is one inactive mode(symmetric strecth) and two pairs of degenerate modes. The vibrational modes also have the same symmetry labels. Three peaks are observed in both spectra. The highest frequency and largest intensity peak in both cases is observed for the asymmetric stretching modes of degenerate modes(E').
There also are some differences. The reasons for big difference in frequencies between two species were already discussed. There also has been reordering of vibrational modes. For BH3 the out-of-plane bending(A2") is lower frequency than degenerate asymmetric bending modes(E'), but the opposite is true for GaBr3. This could be explained by the fact that relative sizes between central atom and ligands are different in both cases. Br ligands are larger than central Ga atom but H atoms are smaller than central B atom. Larger atoms tend to move slower than lighter atoms, therefore there are different relative vibrations between central atom and ligands which could lead to reorganisation of vibrational modes. The energy difference between the E'and A2" is also relatively small. This can also be observed in spectra where the larger intensity out-of-plane bending peak is left(lower frequency) from asymmetric bending peak at higher frequency but lower intensity; in GaBr3 spectrum the lowest intensity peak asymmetric bending peak comes first. The peaks in GaBr3 spectrum are slighly broader than in BH3. This could possibly be due to two reasons(or looks broader because of the scale). Firstly, the low frequency values(top line) were not zero showing that centre of mass is not stationary and is moving. Secondly, the vibronic levels are more closely separated compared to BH3 due to the weak bond. This could give vibrational excitations very similar in energy thus giving broader peaks. This is despite the fact that BH3 molecule had larger lower frequencies, but has sronger bonds.
There is a general trend in both spectra that the three lowest frequency modes(one of E' and A2") are much lower frequency than three highest vibrational modes(A1'and second pair of E'). The lowest energy vibrational modes are bending modes but three highest modes are stretching modes. Stretching modes are larger energy modes compared to the bending ones. This could be explained using the formula above.The bending usually requires 3 atoms(angle is defined by three atoms) so the mass associated with bending is bigger compared to stretching modes where only two atoms are involved, and as described above larger masses give smaller energies and therefore also frequencies.
A small note on intensities: the intensities of vibrational modes are dependent on the number of molecules in each excited state and is described by Boltzmann distribution os the largest intensity modes are more populated.
Molecular Oritals of BH3
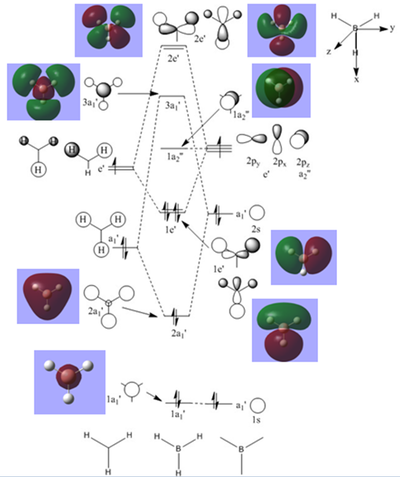
Another important information that can be obtained from calculations is related to bonding. In this case, molecular orbitals were computed for the optimised BH3 (6-31G(d,p)) molecule(additional keywords used pop=full). The results from the completed population analysis can be found in the log file here. The summary of the calculations can be found in this link.
Molecular orbitals can give a useful information about the bonding in molecule and also shows how the electron density is distributed(population analysis). The LCAO approach is very useful qualitative method to form molecular orbitals and look at the bonding in molecule but it doesn't provide us with much quantitative analysis. In population analysis the energies of molecular orbitals are also found. The energies of the molecular orbitals can be viewed here.
The diagram on the right shows the LCAO MOs and computed MOs. When the MOs are drawn, the size(coefficients) of the AOs contributing to MOs are only guessed based on elecronegativity and other factors. However, the coefficiens are calculated in the population analysis. In the computed MOs the real electron density (isodensity surface) can be seen ,and the electron 'cloud' has much larger volume compared to the drawn MOs. In addition, no explicit bonds can be seen in real MOs because the electron density is delocalised over the structure. The 2a1' MO is a very interesting MO where the electron density is distributed in triangular shape. The nodes can also be very well observed in real MOs. In general, the ordering of LCAO MOs can be deduced correctly from the closeness of the interacting AOs energy levels and the extent of overlap, but sometimes it could be hard to order them. In the case of BH3,it is difficult to work out the ordering of 3a1' and 2e'. 3a1' could be higher in energy than 2e' because the s-s interactions are stronger than s-p, but it also could be lower in energy as the AOs forming this MO are lower in energy than AOs forming 2e' MO(it also depends on spacing between AOs). The calculations showed that the energies of these MOs are very similar: energy of 3a1' is 0.16839068 but 2e' is 0.17928978 Hartrees. So the population analysis is very useful in determining the ordering of energy levels which sometimes could be hard with LCAO approach. An interesting shape of electron cloud can be observed for strongly antibonding 2e' MOs. For the computed MO on the left the p type electron cloud is highly distorted compared to the drawn one. For the MO on the right there is no distinct p-type orbital anymore but there is one in LCAO MO. This means that not always drawn MOs are similar to the computed ones and the shape may vary quite significantly. When drawing MOs, the core electrons are usually ignored because they are much lower in energy. The calculations showed that energy difference between the non-bonding core electron MO and lowest bonding MO is very large -6.77139993 and -0.51253691 Hartrees respectively. The electrons also were put in the same orbitals in both cases.
Qualitatively the LCAO MO approach is good to predict the rough shape of real MOs and ordering of the energy levels. The computational analysis is needed in order to find the exact ordering of MOs close in energy and it also gives the energies of the MOs. It also shows the electron distribution for MOs so representing the real shape of them.
Analysis of NH3
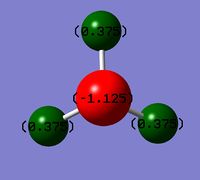
Molecule of ammonia was created in GaussView and was optimised using 6-31G(d,p) basis set and B3LYP calculation method. At first the calculations were carried out using only key word-nosymm. Using only this keyword the low frequency values varied quite significantly, so additional keywords were added-opt=tight, int=ultrafine,scf=conver=9. Point group of C3v was also specified for calculations. The optimised structure had gradient close to 0, and also the forces and displacements converged so the stationary point was found. C1 point group was obtained instead of C3v. Bond lengths were all the same to the significant figures given but one of the H-N-H angles was different from others. This factor possibly lowered the symmetry of molecule. All the information of calculations is here:log file, converged data, summary.
Frequency analysis was also carried out to ensure that minimum was found. All the calculated frequencies were positive therefore the minimum stationary point was found. The important information about the computed data: log file,summary data, low frequencies, positive frequencies.
NBO analysis of NH3
NBO analysis is the analysis of natural bond orbitals. It can be carried out by opening the log file in GaussView. This is slightly different than with molecular orbitals were .chk format file is used(the .log file can be found here, summary file). The charge distribution was analysed. The image of charge distribution of ammonia is given. The red atom is nitrogen(-1.125) and as expected it is highly negatively charged compared to H because it is more electronegative than H. Green atoms are hydrogens(+0.375). The charge range limit is -1.125 to +1.125.
NBO analysis gives us information about the charges on atoms, the details about bond orbitals(orbital coefficients, occupation etc.) and interactions between different MOs.
Association Energies: Ammonia-Borane
|
The goal of this part of experiment was to found association energy when NH3 and BH3 are combined to make NH3BH3. The optimisation of NH3BH3 was first carried out, followed by frequency analysis to ensure the minimum stationary point was found. 6-31G(d,p) basis set and B3LYP method was used for calculations. Additional key words(opt=tight, nosymm, int=ultrafine, scf=conver=9)were also used to get more accurate values. In optimisation the forces and displacements converged and gradient was small.
- The information from frequency analysis: log file, summary, low frequencies, positive frequencies.
The frequency analysis showed that the minimum ground state structure was found as all the 'real' frequencies were positive.
The calculations for BH3 were repeated because the additional keywords mentioned above were not used in the previous optimisations. In order to compare energies the same calculation details have to be used.
The information about the optimisation and frequency analysis is given below:
- Frequency analysis(log file, summary, low frequencies, positive frequencies).
For BH3 the displacement and forces converged and all real frequencies were positive thus indicating the minimum stationary point was found. Additional keywords changed the energy only slightly(by 0.00000001 larger in magnitude) compared to the previous method where keywords were not used.
To calculate the association energy, the energy of each of the components need to be known:
| Molecule | Calculated energy (Hartrees) |
|---|---|
| BH3 | -26.61532364 |
| NH3 | -56.55776872 |
| NH3BH3 | -83.22468911 |
To find the association energy the following formula has to be used:
ΔE=E(NH3BH3)-E(NH3)-E(BH3)=-83.22468911+56.55776872+26.61532364= -0.05159675 Hartrees.
1 Hartree = 2 625.5 kJ/mol, so ΔE= -135.47 kJ/mol.
So the calculated bond energy (dissociation energy) of B-N is 135.47 kJ/mol. The literature value of this bond is 30.9 kcal/mol(experimental estimate) which is equal to about 129.29 kJ/mol.[6] This shows that the calculations were carried out well. This is also a very weak bond. For example, typical H-NH2 bond energy is 460.00 kJ/mol which is much stronger than B-N bond. This B-N bond is even weaker F-F bond which is known for its abnormally weak bond(155 kJ/mol).[7] This is possibly due to the nature of bonds-dative vs covalent.
Ionic Liquids: Designer Solvents
Part 1: Comparison of selected 'onium' cations
The optimisation and frequency analysis were carried out on three onium cations: [N(CH3)4]+, [P(CH3)4]+ and [S(CH3)3]+. The optimisation and frequency analysis was carried out using 6-31G(d,p) basis set together with additional keywords(opt=tight,int=ultrafine,scf=conver=9) to improve the outcome of calculations.
The optimisation and frequency analysis of [N(CH3)4]+
The optimisation was first carried out on this molecule using 6-31G(d,p) basis set and the keywords specified above. The point group Td was also specified for computational analysis. The log file can be found here.
The summary of optimisation:
Filename = //ic.ac.uk/homes/kk2311/Desktop/Ionic liquids/new opt N/KK_N_OPT_NEW.LOG

KK_N(CH3)4
File Name = KK_N_OPT_NEW
File Type = .log
Calculation Type = FOPT
Calculation Method = RB3LYP
Basis Set = 6-31G(d,p)
Charge = 1
Spin = Singlet
E(RB3LYP) = -214.18128421 a.u.
RMS Gradient Norm = 0.00000062 a.u.
Imaginary Freq =
Dipole Moment = 0.0000 Debye
Point Group = TD
Job cpu time: 0 days 0 hours 0 minutes 48.0 seconds.
As can be seen above the RMS gradient is very close to 0 and so the stationary point on the potential energy was found. The forces and displacements also converged (full file) indicating that optimisation was successful.
The summary of frequency analysis is shown below(LOG):
Filename = //ic.ac.uk/homes/kk2311/Desktop/Ionic liquids/New freq N/KK_N_OPT_NEW_FREQ.LOG

KK_N(CH3)4_freq_new
File Name = KK_N_OPT_NEW_FREQ
File Type = .log
Calculation Type = FREQ
Calculation Method = RB3LYP
Basis Set = 6-31G(d,p)
Charge = 1
Spin = Singlet
E(RB3LYP) = -214.18128421 a.u.
RMS Gradient Norm = 0.00000077 a.u.
Imaginary Freq = 0
Dipole Moment = 0.0000 Debye
Point Group = TD
Job cpu time: 0 days 0 hours 2 minutes 25.0 seconds.
Energy is the same as obtained in optimisation. Gradient is slightly different but small. The low frequencies are also given:
Low frequencies --- 0.0006 0.0007 0.0010 21.4522 21.4522 21.4522
Low frequencies --- 188.4829 292.6160 292.6160
The magnitude of low frequencies is larger than +/- 15 cm-1 because the basis set is not good enough for these molecules as they are larger and consist of more atoms/electrons compared, for example, to BH3. All the real frequencies were positive and they can be viewed here.
The optimisation and frequency analysis of [P(CH3)4]+
The optimisation and frequency analysis was computed using the same method as with [N(CH3)4]+(LOG file). The summary of optimisation is shown below:
Filename = //ic.ac.uk/homes/kk2311/Desktop/Ionic liquids/P/opt/KK_P_OPT1_POINT_REAL.LOG

KK_P_opt1_pointgroup_real
File Name = KK_P_OPT1_POINT_REAL
File Type = .log
Calculation Type = FOPT
Calculation Method = RB3LYP
Basis Set = 6-31G(d,p)
Charge = 1
Spin = Singlet
E(RB3LYP) = -500.82703039 a.u.
RMS Gradient Norm = 0.00000637 a.u.
Imaginary Freq =
Dipole Moment = 0.0000 Debye
Point Group = TD
Job cpu time: 0 days 0 hours 0 minutes 46.0 seconds.
The gradient of optimised structure is small and close to 0, and forces and displacements converged meaning that the minimum stationary point was found. The file which shows that forces and displacements converged can be seen here.
The frequencies also were calculated for this molecule(LOG). The summary of this analysis is given:
Filename = //ic.ac.uk/homes/kk2311/Desktop/Ionic liquids/P/freq/KK_P_OPT1_POINT_FREQ.LOG

KK_P_opt1_pointgroup_freq
File Name = KK_P_OPT1_POINT_FREQ
File Type = .log
Calculation Type = FREQ
Calculation Method = RB3LYP
Basis Set = 6-31G(d,p)
Charge = 1
Spin = Singlet
E(RB3LYP) = -500.82703039 a.u.
RMS Gradient Norm = 0.00000622 a.u.
Imaginary Freq = 0
Dipole Moment = 0.0000 Debye
Point Group = TD
Job cpu time: 0 days 0 hours 2 minutes 10.0 seconds.
The energy of this analysis match the energy calculated in the optimisation so frequnecy analysis hasn't improved the stucture. The low frequency values are also not within +/- 15 cm-1, larger basis set has to be used to obtain smaller zero frequencies. all the positive frequencies were positive(link).
Low frequencies --- -0.0010 -0.0004 0.0010 24.8161 24.8161 24.8162
Low frequencies --- 160.0068 194.7479 194.7479
The optimisation and frequency analysis of [S(CH3)3]+
The 6-31G(d,p) basis set was also used for analysis of this cation. The optimisation was successful because the forces and displacements converged and gradient was very small(LOG file, 'converged' data). The summary of calculations is given:
Filename = //ic.ac.uk/homes/kk2311/Desktop/Ionic liquids/S/opt/KK_S_OPT1_POINTGROUP_REAL.LOG

KK_S_opt2_pointgroup_REAL
File Name = KK_S_OPT1_POINTGROUP_REAL
File Type = .log
Calculation Type = FOPT
Calculation Method = RB3LYP
Basis Set = 6-31G(d,p)
Charge = 1
Spin = Singlet
E(RB3LYP) = -517.68327302 a.u.
RMS Gradient Norm = 0.00000076 a.u.
Imaginary Freq =
Dipole Moment = 0.9651 Debye
Point Group = C3V
Job cpu time: 0 days 0 hours 0 minutes 19.0 seconds.
The results from frequency analysis:
Filename = //ic.ac.uk/homes/kk2311/Desktop/Ionic liquids/S/freq/KK_S_OPT1_POINTGROUP_REAL_FREQ.LOG

KK_S_opt2_pointgroup_freq
File Name = KK_S_OPT1_POINTGROUP_REAL_FREQ
File Type = .log
Calculation Type = FREQ
Calculation Method = RB3LYP
Basis Set = 6-31G(d,p)
Charge = 1
Spin = Singlet
E(RB3LYP) = -517.68327302 a.u.
RMS Gradient Norm = 0.00000076 a.u.
Imaginary Freq = 0
Dipole Moment = 0.9651 Debye
Point Group = C3V
Job cpu time: 0 days 0 hours 1 minutes 45.0 seconds.
As can be seen from the summary information, the point group of this molecule is C3v not Td. The frequency analysis was also carried out well because low frequencies were in quite a low range and all the real frequencies were positive(LOG, 'positive' frequencies).
Low frequencies --- -7.9634 -7.5872 -7.5839 0.0032 0.0043 0.0101
Low frequencies --- 162.0301 199.6996 199.6996
Comparison of the Structures of Cations
The table which summarises the bond lengths and angles between the atoms is given:
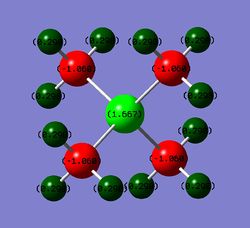
| Variables | [N(CH3)4]+ | [P(CH3)4]+ | [S(CH3)3]+ | |||||||||
|---|---|---|---|---|---|---|---|---|---|---|---|---|
| Structures |
|
|
| |||||||||
| Central atom-C bond length(Å) | 1.51 | 1.82 | 1.82 | |||||||||
| C-H bond length(Å) | 1.09 | 1.09 | 1.09 | |||||||||
| Bond angles(o) | 109.5 | 109.5 | 102.7 | |||||||||
| Point group(o) | Td | Td | C3v |
The central atoms N and P are both group 15 elements. The N is in period 2 but P is in period 3. The structure of these species can be rationalised by the VSEPR theory.
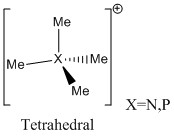
N and P have 5 electrons in valence shell so have 5 electrons for bonding. Each CH3 group has 7 electrons but 6 electrons are used for 3 C-H bonds, so 1 electron is left for methyl group to bond with central atom(X). In total 9 electrons(5e from X and 4 from Me) are left but there also is a +1 charge on ion which has to be accounted for. So 8 electrons(4 electron pairs) are left for bonding. They have to arranged such that electron repulsions are minimised. The shape of the structures in this case is tetrahedral.
The same approach can be used for S. S is in group 6 and have 6 electrons in the valence shell. As 3 Me groups are attached to S that gives extra 3 electrons for bonding. When one electron is subtracted from 9 to account for the +1 charge, we are left with 8 electrons for bonding. 6 electrons are used for S-C bonds so 1 electron pair is not used to form bonds and it remains as lone pair on S. Ligands have to arranged around central S atom such that the resulting structure has minimum electron repulsion. Tetrahedral pseudostructure is obtained if lone pair is used. The ion [S(CH3)3]+ has trigonal pyramidal structure.
 |
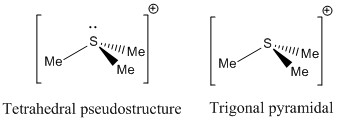 |
The point groups also are the characteristic point groups of the shapes determined by VSEPR-Td for [X(CH3)4]+ and C3v for [S(CH3)3]+.
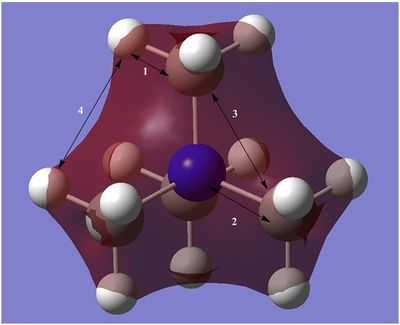
N and P have tetrahedral geometries around them but S is trigonal pyramidal. Although the P and N ions are both tetrahedral and come from the same group, their bond distances from central atom to carbon are quite different. The N-C bond is 0.31 Å shorter than P-C bond. Short bond means that overlap of atomic orbitals forming this bond is very good, whereas for longer bond this means that overlap is poorer. The σ type orbital overlaps contribute the most to the bonding and the bond length, because the best and most directed overlap is obtained. The σ symmetry orbitals are mainly formed by the overlap of corresponding s or pσ atomic orbitals. As P is in period 3(compared to N which is in period 2) it uses larger, more diffuse orbitals for bonding with C atomic orbitals. More diffuse orbitals have poorer overlap, therefore weaker and longer bonds are formed. N and C are in the same period so overlap between the atomic orbitals of these atoms is better. This also correlates with the atomic radii of atoms-C 77, N 74 and P 110 pm.[5] The same principles apply to π symmetry orbitals. The electronegativity also affects the bond lengths because that influences the energy of atomic orbitals contributing to the overlap. Larger difference in energy between the interacting atomic orbitals gives poorer overlap and weaker bonds. The electronegativity in series N>C>P decreases but it is difficult to say where the energy levels will be without the calculations. But in general, more electron density in C-N bond should be closer to N atom, but in P-C bond the density could me shared more equally with slight preference towards C. In addition, P atom is more polarizable than N atom and there the electron density could be distorted more easily giving less directed, less denser overlap.
The bond lengths of C-P and C-S bonds are the same to two decimal places(C-S slightly longer when 3 decimal places used). Both of these bonds are longer than C-N bond. S and P are both in period 3. However the atomic radius of S is smaller than P because S atom is more electronegative and that results in smaller orbitals. This means that S s and pσ atomic orbitals should have better overlap with C orbitals compared to P hence having shorter bonds. However, S cation adopts different geometry and a lone pair(in non-bonding orbital). The non-bonding electrons usually occupy larger space and repel the other orbitals because they are not involved in bonding. This offsets the relatively good overlap of C and S orbitals. C-S bonds are the least polar of these series and electron density in the bonds is distributed evenly.
Bond angle(C-X-X) of P and N is typical tetrahedral angle of 109.5o. This angle is larger compared to the C-S-C angle which is 102.7o. This is because the non-bonding orbitals occupy larger space and therefore the angle is distorted from the ideal tetrahedral angle of 109.5o to 102.7o. The C-H bond lengths were all the same and shorter than all the other bonds indicating that the overlap of H 1s and C s type orbitals is very good.
Molecular Orbitals of [N(CH3)4]+
The population analysis was carried out for the three cations using the checkpoint file from optimisations. The B3LYP method, 6-31G(d,p) basis set and pop=full keywords were used. The corresponding files can be find below:
In total, 21 fully occupied MOs were found for this cation. First 5 MOs were core MOs and they were non-bonding as the energy of them was much lower compared to occupied non-core orbitals(highest core had energy of -10.41433 but lowest non-core -1.19645 Hartrees). There also was no delocalisation of electron density of these MOs because the AOs didn't overlap with any other AOs. All the non-core (16) orbitals were visualised and 5 of them were chosen for further analysis.
NBO Analysis of the Ions
In this section the information from NBO analysis is used to compare and contrast the three cations. All the information about NBOs is contained by the log files from MO analysis.
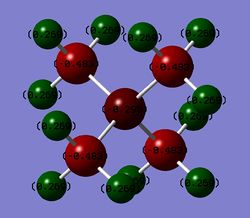
Comparison of the Charge Distribution
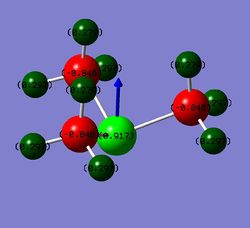
In this part the NBO charge distribution across the three ions was analysed. The table is provided for easier comparison(the charge range was set from -1.000 to +1.000):
In NBO analysis the natural atomic orbitals for each element are found. It also provides the information about the occupancy of these orbitals by calculating the number of electrons in core and valance shells. The number of electrons depends on the molecule and the environment the atom is in. The the charge distribution over the whole molecule can be found. The charges given above are the natural atomic charges. They can be calculated subtracting nuclear charge from the total electron population on that atom. The summary table of natural population analysis for [N(CH3)4]+ is given below to illustrate how the natural charge can be calculated.
Summary of Natural Population Analysis:

                                       Natural Population
                Natural  -----------------------------------------------
    Atom  No    Charge         Core      Valence    Rydberg      Total
 -----------------------------------------------------------------------
      C    1   -0.48340      1.99947     4.46944    0.01450     6.48340
      H    2    0.26906      0.00000     0.72994    0.00100     0.73094
      H    3    0.26906      0.00000     0.72994    0.00100     0.73094
      H    4    0.26906      0.00000     0.72994    0.00100     0.73094
      C    5   -0.48340      1.99947     4.46944    0.01450     6.48340
      C    6   -0.48340      1.99947     4.46944    0.01450     6.48340
      H    7    0.26906      0.00000     0.72994    0.00100     0.73094
      H    8    0.26906      0.00000     0.72994    0.00100     0.73094
      H    9    0.26906      0.00000     0.72994    0.00100     0.73094
      H   10    0.26906      0.00000     0.72994    0.00100     0.73094
      H   11    0.26906      0.00000     0.72994    0.00100     0.73094
      H   12    0.26906      0.00000     0.72994    0.00100     0.73094
      C   13   -0.48340      1.99947     4.46944    0.01450     6.48340
      H   14    0.26906      0.00000     0.72994    0.00100     0.73094
      H   15    0.26906      0.00000     0.72994    0.00100     0.73094
      H   16    0.26906      0.00000     0.72994    0.00100     0.73094
      N   17   -0.29509      1.99950     5.28968    0.00591     7.29509
 =======================================================================
   * Total *    1.00000      9.99736    31.92671    0.07593    42.00000
We know that nuclear charge of N is 7. The total natural electron population on N is 7.29509 so the natural charge is 7-7.29509=-0.29509. This can be done similarly for any atom.
Before the analysis it is worth listing the electronegativities(Pauling) of the atoms(in increasing order): P 2.19, H 2.20, C 2.55, S 2.58 and N 3.04.[5] The charge on the central atom increases in series N<S<P. This correlates with electronegativity where the most electronegative atom should have the the most negative charge as it attracts electrons the most and holds to them most strongly. The electronegativity(Pauling) increases in series P<S<N. So it is obvious from this that one charge distribution depends on electronegatvity-more electronegative atom has more electrons around it and has more negative natural charge.
The charge on C increases in series P<S<N, where the most negative carbon is in P species. This also follows electronegativity. The electronegativity difference between P and C is the biggest in these series hence the most negative C. C is the least negatively charged when it is bound to the very electronegative N.
The same principle applies to H. The natural charge on H increases in series N<S<P. P being the least electronegative (even less electronegative than H) in the series attracts the electrons from H the least. S attracts the electrons slightly better than P because there is only 0.001 charge difference. N is very electronegative and attracts electrons strongly thus reducing the charge on H the most.
An interesting observation was made when comparing the natural charges. If for P species it is reasonable that C has more negative charge, then for S and ,especially, for N species this unusual. N is more electronegative than C so it should have more negative natural charge, but the opposite is true-C has more negative charge compared N(the same for C-S pair). To explain this a table is provided which shows the relative contribution of C and H towards the C-H bond:
| Ions | Contribution from C (%) | Contribution from H (%) |
|---|---|---|
| [N(CH3)4]+ | 63 | 37 |
| [P(CH3)4]+ | 65 | 35 |
| [S(CH3)3]+ | 64 | 36 |
As can be seen in the table the contribution towards the C-H bond is more than 60 %. C also is more electronegative than H. This means that more more electron density is closer to C atom and that increases the natural population of C. The central atoms are not bonded to H atoms so they are limited mainly to central atom-carbon bond electrons. The C atoms have more negative natural charge compared to central atoms, especially N, because they can gain extra electron density from H atoms which are only bonded to the carbons.
There is one major difference between [S(CH3)3]+ ion and other two ions. There is a dipole moment on [S(CH3)3]+ but it is absent on N and P species. This is because first two structures are symmetric and dipole moments cancel out but S ion has lone pair which reduce the symmetry and enhance the polarity.
Relative Contribution of the Carbon and Central Element to the Bond
The MO theory describes the bonding by delocalised MOs. Different shape orbitals are formed during MO analysis but the shape of the orbitals can also be produced differently. The NBO analysis transform the MOs into more localised orbitals(hybrid type orbitals). The NBO analyis of these orbitals is carried out in this section. The table shows the relative contributions of C and central atom(X) towards the C-X bond.
| Ions | Contribution from the central atom (%) | Central atom hybrids (orbital %) | Contribution from C (%) | C hybrids (orbital %) |
|---|---|---|---|---|
| [N(CH3)4]+ | 66 | s(25) and p(75) | 34 | s(21) and p(79) |
| [P(CH3)4]+ | 40 | s(25) and p(75) | 60 | s(25) and p(75) |
| [S(CH3)3]+ | 51 | s(17),p(82) and d(1) | 49 | s(20) and p(80) |
The contribution of the central atom towards the C-X bond increases in series P<S<N. The electronegativity increases in series P<C<S<N thus the trend is that the contribution of the central atom towards the C-X bond increases with increasing electronegativty of the central atom.
- N is much more electronegative than C so it pulls the electron density towards it very strongly. The C-N bond is made from N sp3 and C sp3.8 hybrid orbitals for which the N contributes 66 % but C 34 %.
- P is less electronegative than C which means that C contributes more to the C-X bond. That can also be observed in the table above. The P-C bond is formed by overlapping P sp3 and C sp3 orbitals and the contributions to the bond are 40 and 60 % respectively.
- The electronegativity of C and S are very similar-2.55 for C and 2.58 for S. This mirrors the values obtained from NBO analysis where S has slightly larger contribution towards the bond. 51 % of the bond is contributed from the S sp4.8(ignored d) orbitals but the remaining 49 % is contributed from C sp4 orbitals.
Most of the atoms use sp3 hybrid orbital for bonding but for S the hybridisation is very unusual. The S orbitals have reduced s character and this observation could be rationalised by the fact that 2 s electrons are not involved in bonding (lone pair).
There is a correlation between this analysis and charge distribution analysis carried out in the previous section. Central atom which contributes the most to the C-X bond also has the most negative natural charge. This in the series of these 3 ions, N contributes the most to the bond and has the most negative charge. As mentioned before this can be rationalised by electronegativty of the atoms. The charge distribution in C-X bond can also be compared to relative contributions towards the bond. The relative contribution of atoms towards C-X bond should correlate with natural charge distributions which means that more negative charge should be closer to the atom which contributes to the bond the most. That is observed for P-C bond where C is more negative and also contributes to the bond the most. However, this trend is not observed for C-N and C-S bonds. In the 'Contribution' table it was given that N and S contribute more to the C-X bond but the charge distribution shows that more negative charge is located on C compared to the central atom. This is affected by the C-H bonds and it was discussed in the previous section.
Positive Charge on [NR4]+

The formal charge is the charge given to an atom by ignoring the relative electronegativities of the atoms and assuming that the two electrons forming the bond are shared equally between the two atoms. The structure of [N(CH3)4]+ is given on right where N has +1 formal charge. The structure was found by VSEPR theory(discussed above).
The formal charge can be found by the following rules:
- The number of bonds to the atom: for N it is 4, for C 4 but H 1;
- Lone pairs and single electrons have to be added to the number of bonds to get the total number of electrons. As these atoms have no lone pairs or single electrons, the total number of electrons associated with these atoms are: N=4, C=4 and H=1;
- The number of valence electrons are: N=5, C=4 and H=1;
- The formal charge on atom is=valence electrons - total number of electrons: N=(5-4)=+1, C=(4-4)=0 and H=(1-1)=0.[8]
The formal charge on N means that N in this particular structure has 1 electron less than it has when it is neutral. An isolated N atom has 5 valence electrons but here it has only 4 (4 bonds=8 electrons;electrons are shared equally so N has 4 electrons in this structure), so it means that N is missing 1 electron and therefore has +1 formal charge.
It the charge analysis it was found that the atoms have following natural charges: -0.295 on N, -0.483 on C and 0.269 on H. It follows from this that the positive charge would be located on H atoms. N would be essentially neutral but C atoms would be negative.
Part2: Influence of Functional Groups
One of the H atoms of [N(CH3)4]+ was substituted with OH or CN functional groups to give the following cations-[N(CH3)3(CH2OH)]+ and [N(CH3)3(CH2CN)]+. The effects of the substitution were investigated by carrying out population analysis. The results were compared to the [N(CH3)4]+.
Optimisation and Frequency Analysis of [N(CH3)3(CH2OH)]+

The optimisation was carried out on this ion to find the most stable configuration. 6-31G(d,p) basis set and B3LYP calculation method and additional keywords(opt=tight int=ultrafine scf=conver=9) were used for calculations.
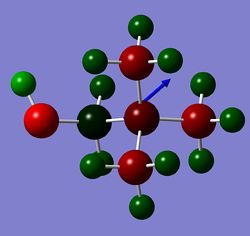
Initially, the structure of N(CH3)3(CH2OH)]+ was optimised(LOG) as given in GaussView(H from O-H group gauche to 2 protons of CH2 group). As the forces and displacements converged, the analysis was continued with frequency analysis. However, the frequency analysis(LOG) gave negative (imaginary) real frequencies which indicates that transition state was found. As can be seen in the movie on right, this frequency mode is bending of O-H bond only. This is a transition state because the this vibrational mode is 'trapped' at the top of the saddle point and H atom can't 'decide' which way to go. Because of this the most stable configuration couldn't be found. The energy of this TS was -289.39321905 Hartrees (summary) and we will later see that this is higher in energy than the energy of the most stable configuration. The table which shows the real negative frequency is shown:
 Low frequencies --- -121.4464   -3.1157   -0.0014   -0.0009   -0.0006    4.0173
 Low frequencies ---    5.0773  129.6686  217.5190
 ******    1 imaginary frequencies (negative Signs) ******
 Diagonal vibrational polarizability:
        8.5492486       3.0464205     274.5955980
 Harmonic frequencies (cm**-1), IR intensities (KM/Mole), Raman scattering
 activities (A**4/AMU), depolarization ratios for plane and unpolarized
 incident light, reduced masses (AMU), force constants (mDyne/A),
 and normal coordinates:
                      1                      2                      3
                      A                      A                      A
 Frequencies --   -121.4457               129.6683               217.5185
To solve this problem, the H atom was manually rotated to break the symmetry so that the optimisation could be carried downhill the transition state.
The optimisation and frequency analysis was repeated with the new configuration. The same method and keywords were used. The forces and displacements converged so the stationary point was found(LOG, 'Item' table). The summary of the optimisation is shown below:
Filename = //ic.ac.uk/homes/kk2311/Desktop/OH/REAL opt/KK_OH_OPT3.LOG

KK_OH_opt3
File Name = KK_OH_OPT3
File Type = .log
Calculation Type = FOPT
Calculation Method = RB3LYP
Basis Set = 6-31G(d,p)
Charge = 1
Spin = Singlet
E(RB3LYP) = -289.39470724 a.u.
RMS Gradient Norm = 0.00000115 a.u.
Imaginary Freq =
Dipole Moment = 2.1357 Debye
Point Group = C1
Job cpu time:       0 days  0 hours  1 minutes 33.0 seconds.
The frequency analysis showed that minimum was found because all the real frequencies were positive(LOG,positive frequencies). The low frequency values were reasonably small meaning that the centre of mass wasn't moving a lot.
 Low frequencies ---   -8.4892   -5.0180   -1.0246    0.0005    0.0006    0.0009
 Low frequencies ---  131.1067  213.4673  255.7148
The summary of calculations:
Filename = //ic.ac.uk/homes/kk2311/Desktop/OH/Real freq/KK_OH_FREQ.LOG

KK_OH_freq
File Name = KK_OH_FREQ
File Type = .log
Calculation Type = FREQ
Calculation Method = RB3LYP
Basis Set = 6-31G(d,p)
Charge = 1
Spin = Singlet
E(RB3LYP) = -289.39470724 a.u.
RMS Gradient Norm = 0.00000115 a.u.
Imaginary Freq = 0
Dipole Moment = 2.1357 Debye
Point Group = C1
Job cpu time:       0 days  0 hours 12 minutes 44.0 seconds.
The energy obtained for TS structure was -289.39321905 Hartrees but for the stable structure it was -289.39470724 Hartrees. This shows that initial structure was in TS.
Optimisation and Frequency Analysis of [N(CH3)3(CH2CN)]+
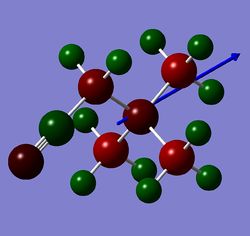
The optimisation and frequency analysis of this ion were carried using the method described in the previous section. For this molecule there were no problems with TS because the CN substituent is linear. In the optimisation the stationary point was found because the forces and placements converged(LOG, 'Item' table). The summary of results is also shown:
Filename = //ic.ac.uk/homes/kk2311/Desktop/CN/KK_CN_OPT2.LOG

KK_CN_opt2
File Name = KK_CN_OPT2
File Type = .log
Calculation Type = FOPT
Calculation Method = RB3LYP
Basis Set = 6-31G(d,p)
Charge = 1
Spin = Singlet
E(RB3LYP) = -306.39376217 a.u.
RMS Gradient Norm = 0.00000119 a.u.
Imaginary Freq =
Dipole Moment = 5.7643 Debye
Point Group = CS
Job cpu time:       0 days  0 hours  5 minutes 28.0 seconds.
As can be seen this ion has Cs (2 operations:E and σ) point group which is a bit higher symmetry point group compared to the previous structure(C1: 1 operation-E). This is because the O-H froup was bent to obtain normal real frequencies.
The frequency analysis was also carried out(LOG). All the real frequencies were positive and they can be found here. The low frequency values were very low:
 Low frequencies ---   -3.5737   -0.0006    0.0004    0.0005    2.7971    3.9001
 Low frequencies ---   91.8719  153.9649  212.1354
The small values on the top line means that this ion feels very little effect from rotations and translations. The summary of frequency analysis can be viewed below:
Filename = //ic.ac.uk/homes/kk2311/Desktop/CN/freq/KK_CN_FREQ.LOG

KK_CN_freq
File Name = KK_CN_FREQ
File Type = .log
Calculation Type = FREQ
Calculation Method = RB3LYP
Basis Set = 6-31G(d,p)
Charge = 1
Spin = Singlet
E(RB3LYP) = -306.39376217 a.u.
RMS Gradient Norm = 0.00000122 a.u.
Imaginary Freq = 0
Dipole Moment = 5.7643 Debye
Point Group = CS
Job cpu time:       0 days  0 hours  9 minutes  2.0 seconds.
The structures of both ions are shown in the table:
| [N(CH3)3(CH2OH)]+ | N(CH3)3(CH2CN)]+ | ||||||
|---|---|---|---|---|---|---|---|
|
|
MO and NBO Analysis
The checkpoint files from the optimisation were used to run population analysis for these cations. The method used was very similar to the one applied for optimisation and frequency analysis but with additional keywords 'pop=full'.
The output files from the population analysis:
The functional group influence on the charge distribution will be analysed in next section.
Functional Group Influence on Charge Distribution
To find the natural charges on atoms the natural bond analysis was done. The table summarises the findings from the analysis(charge range -1.000 to +1.000):
OH is known as electron donating group but CN is known as electron withdrawing group. For comparison the data for the [N(CH3)4]+ is given. The charge values and bond distances varied for the substituted ions but the average values were given in table so that all three structures can be compared.
The charge on central atom. The negative charge on N increases in series CN<H<OH. This reflects the nature of substituent. As predicted, the most negative N is from 'OH' species because OH is electron donating group. In 'CN' cation the N has the least negative charge because the electron density is removed by strong electron withdrawing ability of CN. The N in 'H' species has more negative charge than in 'CN' species.
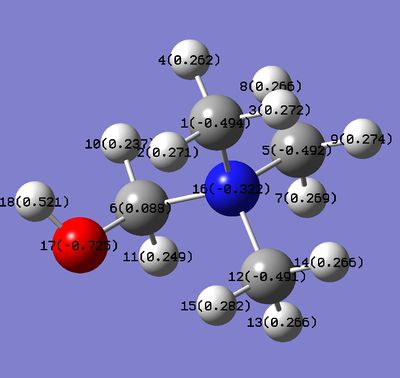
The charge on carbons. The same trend is not observed in this case. There could be few reasons for that. Firstly, the average C charge was calculated, however the charge varies between the carbons, especially the carbon next to functional group. Secondly, the carbons are further away from the functional group compared to N(apart from C next to the functional group). The most negative carbons are in 'H' ion. This is because the C is more electronegative than H. It is also the most negative in these series because no carbons are affected by functional groups. The least negative C is observed in 'OH' ion and is less negative than C in 'CN' species. This doesn't follow the trend that most negative charge should be on atoms from 'OH' species. Possibly, it is not correct to compare the average charge on C because the charge distribution across carbons varies. To understand more about the charge distribution, the two images are given below:
 |
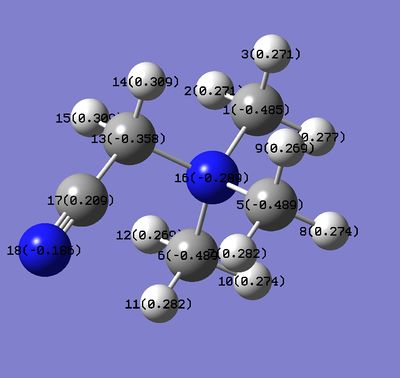 |
It can be seen that charges on carbons for both ions, except for the C next to functional group, have very similar values and these values are also very similar to the ones observed on 'H' ion. The C atoms(except the one next to functional group) are slightly more negatively charged in 'OH' species than they are in CN. This reflects the nature of OH and CN functional groups. OH is electron donating so the carbons have more negative natural charge compared to C's from 'CN' ion where electron density is withdrawn by CN. The carbons next to the functional groups have very different charges compared to other carbons. The C(6) next to the OH group has natural charge of 0.088 but the C(13) next to CN group has charge -0.358. The charge on C in 'H' ion is -0.483.
The C(13) next to the CN group has less negative charge than other carbons in this structure and also less negative than C atom in 'H' species. This mirrors the CN electron withdrawing nature. This carbon is also attached the electronegative N atom which also decreases the electron density on that carbon(electrons from this carbon are pulled from both sides). The H atoms on this C are more positive than Hs in 'H' and 'OH' species for the same reasons just discussed.
The C(6) from 'OH' species is much more positive than other carbons on this structure and also carbons from other 2 ions. OH is donating group and it should mean that this carbon is more negatively charged than other carbons but this carbon is also attached to electronegative N. So two effects take place at this carbon-OH donates but N withdraws the electrons and the net effect is that carbon remains nearly neutral. Similar principle applies to the hydrogens attached to this carbon.
Charge on hydrogens. The average positive charge on hydrogens increases in series OH<H<CN. This reflects the nature of substituents attached. The most positive hydrogens are the ones from 'CN' ion but the least positive on 'OH' ion.
Charge on functional groups. The most electronegative atom in the functional group had the most negative natural charge. In OH, the O atom is much more negatively charged than H. This H atom is also much more positive than other hydrogens on the structure. In CN, N is more electronegative than C and thus have more negative charge on it. This C also is more positive than other carobs on the structure.
Overall, the electron donating and withdrawing effects were observed. Atoms in 'CN' species were more positive than atoms in other two cations because CN is electron withdrawing group. The opposite is true for 'OH' ion where atoms are more negative because of OH electron donating ability.
Different bond lengths were observed for C-(functional) bond. this bond length increases in series H<OH<CN. The C-H bond is the shortest because there is very good and directed overlap of H 1s and C s orbitals. The summary of contributions towards bonds is given which could help to explain the difference:
Contributions towards H-O-C-N bond: H-O(76% O(sp3.52) and 24 % H(s)), O-C ( 34 % C(sp3.21) and 66 % O(sp2.10)), C-N ( 33 % C(sp3.92) and 67 % N(sp3.26)), another C-N bond ( 34 % C and 66 % N).
Contributions towards N-C-C-N: Nitrile N-C ( 51 % N(p) and 49 % C(p)), (N)C-C ( 49 % (N)C(sp0.92) and 51 % C(sp2.70)), C-N ( 35 % C(sp3.80) and 65 % N(sp3.15)), another C-N bond( 33 % C and 67 % N).
The bonds we are interested in are O-C and (N)C-C bonds. For O-C bond, the O contributes to the bond the most because it is more electronegative(If thinking in terms of MO theory, O is more electronegative than C so its AO is lower in energy compared to the AO of C. This means that O has larger contribution towards the bonding MO but C has more contribution towards the antibonding MO). However, the natural bond orbitals uses the principles of 2c-2e bonds. So we could try and describe the bonding in terms of hybrid orbitals. C essentially uses sp3 hybrid orbitals but O uses sp2 type hybrid orbitals. For C-C bond, both carbons have nearly the same contribution towards the bond. This bond is formed by overlapping C(from nitrile) sp orbitals and C sp3 hybrid orbitals. At first it may seem that C-C bonds should be stronger than C-O bonds because the same atom AOs are used to form a bond(a good match in size). However, the O has smaller AOs so it could also possibly give good overlap. The same principle of orbital overlap can also be used when considering hybrid orbitals. There is larger difference in orbital hybridisation for C-C(sp3 and sp) bond than there is for C-O(sp3 and sp2) bond. The match of orbital overlap is poorer in C-C bond therefore the bond is longer.
The hybridisation also shows that nitrile C-N (triple)bond is formed only by p orbitals and H-C bond is formed from sp3 O orbitals and s H orbital. The relative contribution towards these bonds depends on the electronegativity of the atoms, the more electronegative atom contributes more to the bond(good correlation to the values given above).
HOMO and LUMO
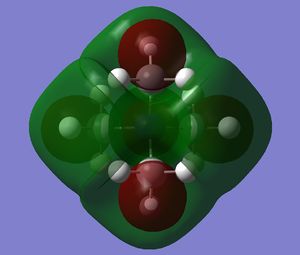
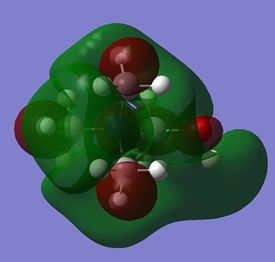
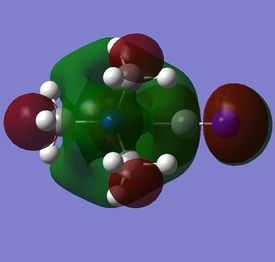
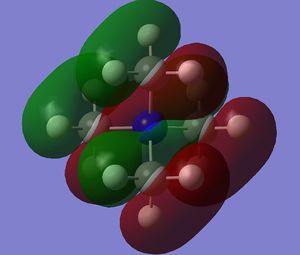
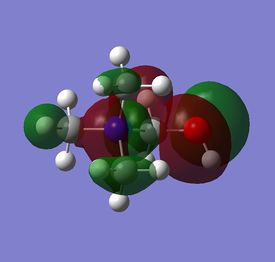
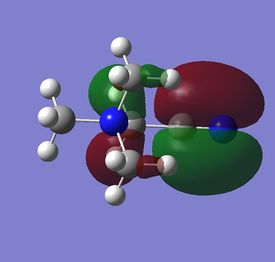
HOMO and LUMO orbitals of each of these cations were visualised and compared in this section. The images of orbitals are given below:
Comparison of LUMOs.
The LUMO orbitals of the cations have a very similar round shape. They all are also very diffuse. The LUMO of 'H' and 'CN' ions is more symmetric with respect to shape than LUMO of 'OH' ion. As can be seen the 'OH' LUMO is more distorted and this distortion is mainly affected by electronegative OH group(symmetry of this group with respect to the overall structure was reduced(OH was rotated) to avoid imaginary frequencies). It can be seen that most distortion occurs near the O atom. In all LUMOs, the central N contributes to the antibonding character significantly by its s AO. In the LUMOs there are p-type lobes pointing up from all the methyl groups-this is also observed for all the ions. The LUMOs gets less diffuse in the series H<OH<CN.
Comparison of HOMOs.
The HOMOs gets less diffuse in series H<OH<CN. The central N atom in 'H' and 'OH' species contributes p AOs for bonding but the central N from 'CN' ion does not contribute to the overall bonding. There are less nodes 'CN' ion than there are in other two HOMOs. HOMO of 'H' ion has more bonding character compared to other two HOMOs because there are many bonding p-s and p-p AO interactions. Strong π interactions are observed for 'OH' and ' CN' species in the functional group region and could be attributed to p AO interactions.
The energies of HOMO and LUMO orbitals are given in the table:
| Variables | [N(CH3)4]+ | [N(CH3)3(CH2OH)]+ | [N(CH3)3(CH2CN)]+ |
|---|---|---|---|
| HOMO energy (Hartrees) | -0.57934 | -0.48763 | -0.50047 |
| LUMO energy (Hartrees) | -0.13303 | -0.12459 | -0.18183 |
| HOMO-LUMO gap (Hartrees) | 0.44631 | 0.36304 | 0.31864 |
There HOMO-LUMO gap is different across the series. The HOMO level is destabilised for substituted species because there are less bonding interactions than for non-substituted species. It is hard to deduce the relative ordering of LUMO levels qualitatively but the relative energies of LUMOs show that LUMO is more stabilised for 'CN' species(relative to 'H' species).
The biggest energy gap is observed for non-substituted cation. Upon substitution the gap has changed. The HOMO-LUMO gap energy difference decreases in series H>OH>CN. So the 'CN' cation has the smallest energy gap.
The HOMO and the LUMO orbitals are sometimes called frontier orbitals. They are the main orbitals which contribute to the reactivity of the molecule. when different species react with each other the HOMO-LUMO gap determines how and whether they will react. Smaller HOMO-LUMO gap reduces the possibility of reacting with other species.
References
- ↑ P. Schwerdtfeger, "The Pseudopotential Approximation in Electronic Structure Theory", Chem. Phys. Chem., 2011, 12, 3143.DOI:10.1002/cphc.201100387
- ↑ 2.0 2.1 K. Kawaguchi, "Fourier transform infrared spectroscopy of the BH3 ν3 band", J. Chem. Phys.,1992, 96, 3411.DOI:10.1063/1.461942
- ↑ S. S. Batsanov, "Calculation of van der Waals radii of atoms from bond distances", J. Mol. Chem. Struc.:THEOCHEM,1999, 468, 151-159.DOI:10.1016/S0166-1280(99)00077-9
- ↑ Y. S. Ezhov, "Force constants and characteristics of the structure of trihalides", Russ. J. Phys. Chem.,1992,66, 748.
- ↑ 5.0 5.1 5.2 P. W. Atkins, T. L. Overton, J. P. Rourke, M.T. Weller, and F. A. Armstrong, Shriver and Atkins Inorganic Chemistry, Oxford University Press, New York, USA, 2010, 23-30. Cite error: Invalid
<ref>tag; name "inorganic1" defined multiple times with different content - ↑ H. Umeyama and K. Morokuma, "Molecular Orbital Studies of Electron Donor-Acceptor Complexes. 3. Energy and Charge DecompositionAnalyses for Several Strong Complexes: OC-BH3, H3N-BH3, CH3H2N-BH3, (CH3)3N-BH3, and H3N-BF3 ", J. Am. Chem. Soc.,1976, 98, 7208–7220.DOI:10.1021/ja00439a018
- ↑ P. Atkins, J. de Paula, Atkins' Physical Chemistry, Oxford University Press, New York, USA, 2010, 932.
- ↑ J. Keeler and P. Wothers, Chemical Structure and Reactivity: an integrated approach, Oxford University Press, New York, USA, 2008, 315.


