
Rep:Mod:kjoreport
NH3
3D molecule model
Ammonia molecule |
Method and obtained data
| Ammonia data | |
|---|---|
| Point group | C3V |
| Calculation method | RB3LYP |
| Basis set | 6-31G(d,p) |
| N-H bond length | 1.018Å |
| H-N-H bond angle | 105.7° |
| Final energy | -56.55777a.u. |
| RMS gradient | 0.0003244a.u. |
File and 'Item' table
This is the .LOG file comtaining all the relevant data:File:KJO3118 CO2 OPTIMISED.LOG, and the 'Item' table from this file is:
Item               Value     Threshold  Converged?
 Maximum Force            0.000024     0.000450     YES
 RMS     Force            0.000017     0.000300     YES
 Maximum Displacement     0.000021     0.001800     YES
 RMS     Displacement     0.000015     0.001200     YES
Vibrations
Vibrational modes

Vibrational modes table
According to the 3N-6 rule for non-linear molecules, there is an expected number of 6 vibrational modes for a NH3 molecule. 3 of these are bending vibrations (one mode with wavenumber 1090cm-1 and two degenerate modes 1694cm-1), and 3 are stretching vibrations (one mode with wavenumber 3461cm-1 and two degenerate modes 3590cm-1). The first mode shown in the table (wavenumber 1090cm-1) is known as the 'umbrella' mode, and the mode with wavenumber 3461cm-1 is highly symmetric. These modes are shown in the table below:
| Vibrational data | ||||||
|---|---|---|---|---|---|---|
| Bending modes | ||||||
| Wavenumber/cm-1 | 1090 | 1694 | 1694 | |||
| Intensity/arbitrary | 145 | 14 | 14 | |||
| Symmetry | A1 | E | E | |||
| Visualisation |  |
 |

| |||
| Stretching modes | ||||||
| Wavenumber/cm-1 | 3461 | 3590 | 3590 | |||
| Intensity/arbitrary | 1.06 | 0.27 | 0.27 | |||
| Symmetry | A1 | E | E | |||
| Visualisation |  |
 |

| |||
IR spectrum
In an IR spectrum of gaseous ammonia 4 peaks are visible (starting from the left):
- first one due to the 'umbrella' bending mode;
- second peak due to the other two degenerate, asymmetric bending modes;
- third, very faint peak, due to the 3461 cm-1 stretch;
- fourth, again very faint peak, due to both degenerate 3590cm-1 modes.

Charge distribution in NH3
In a NH3 molecule, the nitrogen is more electronegative than hydrogen (3.04 for Nitrogen[1] vs 2.20 for Hydrogen [2] on the Pauling scale). Therfore the N-H bonds are polarised, with a slight negative charge on the nitrogen atom, and a partial positive charge on each hydrogen atom:

H2 and N2
3D molecule models
Nitrogen molecule |
Hydrogen molecule |
Method and obtained data
| Obtained data | ||
|---|---|---|
| Nitrogen | Hydrogen | |
| Point group | D∞h | D∞h |
| Calculation method | RB3LYP | RB3LYP |
| Basis set | 6-31G(d,p) | 6-31G(d,p) |
| Bond length | 1.106Å | 0.743Å |
| Final energy | -109.52413a.u. | -1.17854a.u. |
| RMS gradient | 0.0000006a.u. | 0.00000007a.u. |
Bond angles are not included, since a di-atomic molecule cannot have a bond angle (for an angle, mathematically, 3 points are required). However, this angle can be taken to be 180.0°.
Files and 'Item' tables
This is the .LOG file comtaining all the relevant data for nitrogen:File:KJO3118 N2 OPTIMISED.LOG, and the .LOG file for hydrogen: File:KJO3118 H2 OPTIMISED.LOG. The 'Item' table for nitrogen:
Item               Value     Threshold  Converged?
 Maximum Force            0.000001     0.000450     YES
 RMS     Force            0.000001     0.000300     YES
 Maximum Displacement     0.000000     0.001800     YES
 RMS     Displacement     0.000000     0.001200     YES
And for hydrogen:
Item               Value     Threshold  Converged?
 Maximum Force            0.000000     0.000450     YES
 RMS     Force            0.000000     0.000300     YES
 Maximum Displacement     0.000000     0.001800     YES
 RMS     Displacement     0.000001     0.001200     YES
Vibrations
N2 vibrational modes

N2 vibrational modes table
According to the 3N-5 rule for linear molecules, only one vibrational mode is present in a N2 molecule. It is a stretching vibration mode:
| Vibrational data | ||||||
|---|---|---|---|---|---|---|
| Stretching mode | ||||||
| Wavenumber/cm-1 | 2457 | |||||
| Intensity/arbitrary | 0 | |||||
| Symmetry | SGG | |||||
| Visualisation | 
| |||||
H2 vibrational modes

H2 vibrational modes table
According to the 3N-5 rule for linear molecules, only one vibrational mode is present in a H2 molecule. It is a stretching vibration mode:
| Vibrational data | ||||||
|---|---|---|---|---|---|---|
| Stretching mode | ||||||
| Wavenumber/cm-1 | 4466 | |||||
| Intensity/arbitrary | 0 | |||||
| Symmetry | SGG | |||||
| Visualisation | 
| |||||
Charge distribution
Both N2 and H2 are symmetric, 100% covalent molecules, therefore there is no permanent charge separation on the atoms:
N2

H2

N2 in a transition metal complex

I found [DOCTUM], a Cobalt metal complex in the CDC, using conquest. The N-N bond length in the complex was found to be 1.112Å, which is very close to the computed and modelled value of 1.106Å. However, it is experimentally measure to be slightly longer. This is likely because in the calculation only an N2 molecule is considered, with no other species in the surroundings. In the case of the complex, there would be a large delocalised electron system on the complex, making it very likely that some electron density would be placed into the π* antibonding orbitals of N2, increasing the bond length. This could be confirmed by checking the Raman absorption spectrum: for the longer bond, its stiffness would be less, therefore showing an absorption peak at a lower wavenumber[3].
Energetics of the Harbor process
N2+3H2->2NH3
| Energies table | ||||||
|---|---|---|---|---|---|---|
| E(NH3)=-56.55777 a.u. | ||||||
| 2*E(NH3)=-113.11554 a.u. | ||||||
| E(N2)=-109.52413 a.u. | ||||||
| E(H2)=-1.17854 a.u. | ||||||
| 3*E(H2)=-3.53562 a.u. | ||||||
| ΔE=2*E(NH3)-[E(N2)+3*E(H2)]=-0.05579 a.u.= -146.5 kJ/mol | ||||||
Since the reaction is exothermic, the products are thermodynamically more stable, at a lower energy.
CO2-chosen molecule
3D molecule model
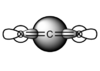
Carbon dioxide molecule |
Method and obtained data
| Ammonia data | |
|---|---|
| Point group | D∞h |
| Calculation method | RB3LYP |
| Basis set | 6-31G(d,p) |
| C=O bond length | 1.169Å |
| O-C-O bond angle | 180.0° |
| Final energy | -188.58094a.u. |
| RMS gradient | 0.00001154a.u. |
File and 'Item' table
This is the .LOG file comtaining all the relevant data:File:Kjo3118nh3opt.LOG, and the 'Item' table from this file is:
Item               Value     Threshold  Converged?
 Maximum Force            0.000004     0.000450     YES
 RMS     Force            0.000004     0.000300     YES
 Maximum Displacement     0.000072     0.001800     YES
 RMS     Displacement     0.000035     0.001200     YES
Vibrations
Vibrational modes

Vibrational modes table
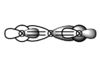
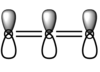
According to the 3N-5 rule for linear molecules, there is an expected number of 4 vibrational modes for a CO2 molecule. 2 of these are bending vibrations, these are degenaerate with a wavenumber of 640cm-1, and 2 are stretching vibrations (one mode with wavenumber 1372cm-1 and one with 2436cm-1). These modes are shown in the table below:
| Vibrational data | ||||
|---|---|---|---|---|
| Bending modes | ||||
| Wavenumber/cm-1 | 640 | 640 | ||
| Intensity/arbitrary | 30 | 30 | ||
| Symmetry | PIU | PIU | ||
| Visualisation |  |

| ||
| Stretching modes | ||||
| Wavenumber/cm-1 | 1372 | 2436 | ||
| Intensity/arbitrary | 0 | 546 | ||
| Symmetry | SGG | SGG | ||
| Visualisation |  |

| ||
The images are .gif files. MAKE SURE YOU CLICK ON THEM TO VIEW THE ANIMATION.
IR spectrum
In an IR spectrum of gaseous carbon dioxide 2 peaks are visible (starting from the left):
- first one due to the two degenerate bending modes, at 640cm-1;
- second peak due to the one IR active asymmetric stretching mode;

Charge distribution in CO2
In a CO2 molecule, there is a difference in electronegativity on the atoms present: Carbon has electronegativity of 2.55[4] and oxygen has an elecrtonegativity of 3.44[5]. Therfore the C=O bonds are polarised, with a slight negative charge on the oxygen atoms, and a partial positive charge on each carbon atom:

CO2 molecular orbitals
- The first molecular orbital chosen is a mixture of many orbitals in varying degrees: 1s,2s and 3s from carbon and 2s, 2p, 3s, and 3p from oxygen.
 This orbital is full and it is one of the orbitals relatively close to the HOMO in energy. Since these overals are all 'head on' this orbital contributes to the σ bonding of the molecule.


- The next MO chosen is again a mixture of many orbitals: 2p, 3p on carbon and 2s, 2p, 3s, 3p on oxygen:
 . This orbital also contributes to the σ bonding.


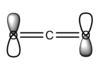
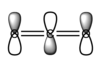
- The next two chosen MOs are a product of 2p and 3p, to a smaller degree than 2p, orbitals from both oxygens and the carbon interacting constructively, in phase, resulting in a bonding π orbital, which is full. this comtributes to the 'double' bonds between carbon and ocygen. It can be shown on this simple diagram:
 Note that the orbital visualisations look almost exactly the same - they only differ in orientation, they are orthogonal to each other (they are also degenerate):


- The next pair or MOs chosen arises when the 2p and 3p, to a smaller degree than 2p,orbitals on oxygen atoms interfere out of phase:
 . These two orbitals are the highest occupied molecular orbitals (HOMO). As with the previous case, these are degenerate, only differing in the orientation.


- The last pair of MOs chosen are a result of 2p and 3p orbitals on all 3 atoms interfering out of phase:
 . This creates the lowest unoccupied molecular orbital (LUMO), which in this case is a π* antibonding orbital. Again these two orbitals are are degenerate and only differ in the orientation.


CO2 HOMO-LUMO transition energy gap
From my molecular orbital model i found that the HOMO has an energy of -0.36997a.u. and the LUMO has an energy of 0.02992. This gives the energy gap between HOMO and LUMO to be 0.39989a.u., which is 10.9 eV.
The HOMO-LUMO transition can be observed experimentally by spectroscopy. According to an absorption or emission peak wavenumber, the energy gap between the orbitals can be estimated. This value is found to be 9.9eV[6].
Our compiled value is not exact, but does provide an estimate of the size of the HOMO-LUMO energy gap in a carbon dioxide molecule (the difference is only 10.1%).
.
Marking
Note: All grades and comments are provisional and subject to change until your grades are officially returned via blackboard. Please do not contact anyone about anything to do with the marking of this lab until you have received your grade from blackboard.
Wiki structure and presentation 1/1
Is your wiki page clear and easy to follow, with consistent formatting?
YES
Do you effectively use tables, figures and subheadings to communicate your work?
YES
NH3 1/1
Have you completed the calculation and given a link to the file?
YES
Have you included summary and item tables in your wiki?
YES
Have you included a 3d jmol file or an image of the finished structure?
YES
Have you included the bond lengths and angles asked for?
YES
Have you included the “display vibrations” table?
YES
Have you added a table to your wiki listing the wavenumber and intensity of each vibration?
YES
Did you do the optional extra of adding images of the vibrations?
YES
Have you included answers to the questions about vibrations and charges in the lab script?
YES
N2 and H2 0.5/0.5
Have you completed the calculations and included all relevant information? (summary, item table, structural information, jmol image, vibrations and charges)
YES
You were correct to not include a bond angle. You are incorrect to say: "this angle can be taken to be 180.0°."
Crystal structure comparison 0.5/0.5
Have you included a link to a structure from the CCDC that includes a coordinated N2 or H2 molecule?
YES
Have you compared your optimised bond distance to the crystal structure bond distance?
YES
Haber-Bosch reaction energy calculation 1/1
Have you correctly calculated the energies asked for? ΔE=2*E(NH3)-[E(N2)+3*E(H2)]
YES
Have you reported your answers to the correct number of decimal places?
YES
Do your energies have the correct +/- sign?
YES
Have you answered the question, Identify which is more stable the gaseous reactants or the ammonia product?
YES
Your choice of small molecule 5/5
Have you completed the calculation and included all relevant information?
YES
Have you added information about MOs and charges on atoms?
YES - very good explanations and wiki overall, well done.
See this wiki page for more details on the CO2 MOs.
Independence 1/1
If you have finished everything else and have spare time in the lab you could:
Check one of your results against the literature, or
You checked you HOMO-LUMO gap against the literature, well done!
Do an extra calculation on another small molecule, or
Do some deeper analysis on your results so far
- ↑ Mark Winter, U. (2019). WebElements Periodic Table » Nitrogen » electronegativity. [online] Webelements.com. Available at: https://www.webelements.com/nitrogen/electronegativity.html [Accessed 8 Mar. 2019].
- ↑ Mark Winter, U. (2019). WebElements Periodic Table » Hydrogen » electronegativity. [online] Webelements.com. Available at: https://www.webelements.com/hydrogen/electronegativity.html [Accessed 8 Mar. 2019].
- ↑ Cavigliasso, G., Wilson, L., McAlpine, S., Attar, M., Stranger, R. and Yates, B. (2010). Activation and cleavage of the N–N bond in side-on bound [L2M-NN-ML2] (L = NH2, NMe2, NiPr2, C5H5, C5Me4H) dinitrogen complexes of transition metals from groups 4 through 9. Dalton Transactions, 39(19), p.4529.
- ↑ Mark Winter, U. (2019). WebElements Periodic Table » Carbon » electronegativity. [online] Webelements.com. Available at: https://www.webelements.com/carbon/electronegativity.html [Accessed 8 Mar. 2019].
- ↑ Mark Winter, U. (2019). WebElements Periodic Table » Oxygen » electronegativity. [online] Webelements.com. Available at: https://www.webelements.com/oxygen/electronegativity.html [Accessed 8 Mar. 2019].
- ↑ Zhan, C., Nichols, J. and Dixon, D. (2003). Ionization Potential, Electron Affinity, Electronegativity, Hardness, and Electron Excitation Energy: Molecular Properties from Density Functional Theory Orbital Energies. The Journal of Physical Chemistry A, 107(20), pp.4184-4195.