Rep:Mod:khlmod2
Introduction
Computational Molecular Modelling Analysis of BH3
BH3 Optimisation
Borane is a small, simple molecule which very symmetric and therefore can be computationally modelled fairly accurately. BH3 was drawn out in Gaussian view 5.0 and each B-H bond length was set as 1.5 Å. Before conducting further calculations it was essential to optimise the molecule first. To optimise BH3 the DFT/B3LYP method with a 3-12g basis set was used. The results from this optimisation is summarised below.
File Name = BH3 OPTIMISATION
File Type = .log
Calculation Type = FOPT
Calculation Method = RB3LYP
Basis Set = 3-21G
Charge = 0
Spin = Singlet
Total Energy = -26.46226338 a.u
RMS Gradient Norm = 0.00020672 a.u
Imaginary Freq = -
Dipole Moment = 0.0000 Debye
Point Group = D3H
Job cpu time: 0 days 0 hours 0 minutes 7.0 seconds
The symmetry of the molecule is reflected by the confirmation that borane belongs to the D3h point group and has a dipole moment of 0. The overall energy of the minimised molecule was found to be -26.46 a.u (-0.01 kJ mol-1). It is possible to see that the molecule has been fully optimised by looking at the root mean square (RMS) gradient which is less than 0.001 which indicates that the minimum (the equilibrium point) on the potential energy surface graph has been obtained. The simplicity of the molecule is reflected by the limited time period the optimisation required (7 seconds).
By looking at the section taken below from the text file from the resultant molecule, one can see that all the parameters converged, indicating that the calculation was successful and completed. One can also see from the optimised parameters the bond angles and bond lengths. The bond length for each B-H bond was calculated to be 1.19 Å and the bond angle was calculated to be 120.0°. The calculated bond lengths were found to agree with the literature values of 1.19 Å and 120° and the point group of D3h.
Item               Value     Threshold  Converged?
 Maximum Force            0.000413     0.000450     YES
 RMS     Force            0.000271     0.000300     YES
 Maximum Displacement     0.001610     0.001800     YES
 RMS     Displacement     0.001054     0.001200     YES
 Predicted change in Energy=-1.071764D-06
 Optimization completed.
    -- Stationary point found.
                           ----------------------------
                           !   Optimized Parameters   !
                           ! (Angstroms and Degrees)  !
 --------------------------                            --------------------------
 ! Name  Definition              Value          Derivative Info.                !
 --------------------------------------------------------------------------------
! R1    R(1,2)                  1.1935         -DE/DX =    0.0004               !
! R2    R(1,3)                  1.1935         -DE/DX =    0.0004               !
! R3    R(1,4)                  1.1935         -DE/DX =    0.0004               !
! A1    A(2,1,3)                120.0          -DE/DX =    0.0                  !
! A2    A(2,1,4)                120.0          -DE/DX =    0.0                  !
! A3    A(3,1,4)                120.0          -DE/DX =    0.0                  !
! D1    D(2,1,4,3)              180.0          -DE/DX =    0.0                  !
 --------------------------------------------------------------------------------
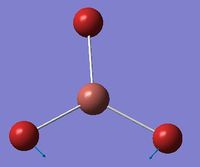
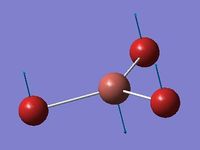
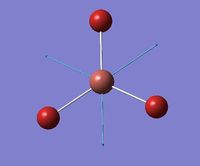
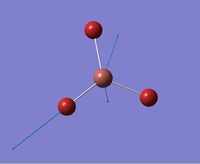
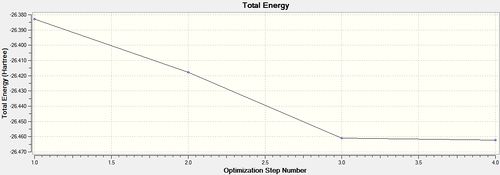
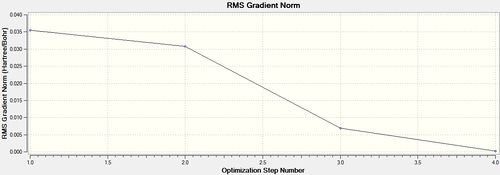
From the optimised BH3 molecule it was then possible to view a graphical representation of the energy and the energy gradient. The graphical representation of the energy illustrates the successive decrease in energy as Guassian alters the positions of the nuclei in order to obtain the arrangement corresponding to the minima of the potential energy surface curve. The graphs illustrated that it took a total of four steps to achieve the minima, and during each of the four iterations the energy of molecule successively decreased, in concurrence with a potential energy surface curve. At the fourth iteration the BH3 molecule reached its minimum energy. The representations of BH3 at each step provided by Gaussian are shown below.
| Optimisation Step 1 | Optimisation Step 2 | Optimisation Step 3 | Optimisation Step 4 |
|---|---|---|---|
 |
 |
 |
 |
The graphs obtained from the optimisation of BH3 displaying the minimisation of energy and the energy gradient as the energy of the molecule is minimised, are shown below.
BH3 Vibrational Analysis
Vibrational analysis was subsequently carried out on the obtained optimised BH3 molecule. This was carried out using the same method and basis set as for the optimisation, but the job type was altered to ‘frequency’ and additional key words “pop=full,nbo” were added. This calculation essentially yielded the 2nd derivative and allowed one to determine whether the optimised molecule obtained was in fact in the ground state or in the transition state. If the optimised BH3 molecule were in the transition sate the vibrational analysis would yield negative frequencies, indicating that the optimisation was unsuccessful /incomplete while optimised BH3 in the ground state would yield only positive frequencies. From the absence of any negative frequencies it could be concluded that the optimisation of BH3 was indeed successful and was in the ground state, and this was confirmed by obtaining literature values, which likewise didn’t illustrate any negative frequencies.
Low frequencies ---  -66.7625  -66.3592  -66.3589   -0.0020    0.0031    0.2123
 Low frequencies --- 1144.1483 1203.6413 1203.6424
 Harmonic frequencies (cm**-1), IR intensities (KM/Mole), Raman scattering
 activities (A**4/AMU), depolarization ratios for plane and unpolarized
 incident light, reduced masses (AMU), force constants (mDyne/A),
 and normal coordinates:
                     1                      2                      3
                    A"                     E'                     E'
 Frequencies --  1144.1483              1203.6413              1203.6424
 Red. masses --     1.2531                 1.1085                 1.1085
 Frc consts  --     0.9665                 0.9462                 0.9462
 IR Inten    --    92.8665                12.3148                12.3173
  Atom  AN      X      Y      Z        X      Y      Z        X      Y      Z
     1   5     0.00   0.00   0.16     0.00   0.10   0.00    -0.10   0.00   0.00
     2   1     0.00   0.00  -0.57     0.00   0.08   0.00     0.81   0.00   0.00
     3   1     0.00   0.00  -0.57    -0.38  -0.59   0.00     0.14   0.38   0.00
     4   1     0.00   0.00  -0.57     0.38  -0.59   0.00     0.14  -0.38   0.00
The information above has been taken from the resulting text file from the vibrational analysis of BH3. The information most valuable are the numbers displayed next to the heading “Low Frequencies”. These correspond to 3N-6 vibrational frequencies which are motions of the centre of mass of the molecule and are found in all molecules. The first row of “Low Frequencies” should display lower values than the second row, which is the case here. Usually, one would expect these six frequencies to be within 10 cm-1 of each other if the calculation is accurate. In this case the calculation was not particularly accurate as shown by the gap between the figures; this is due to the low level method used. The vibrational Spectrum obtained is shown below.
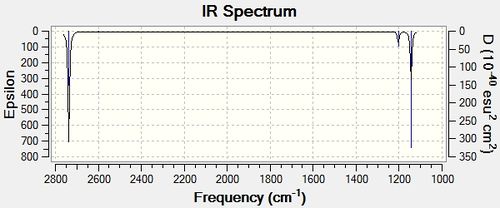
The vibrational analysis identified six different vibrational modes which all contribute to the IR spectrum. These vibrations are tabulated below, shown next to the corresponding values found in literature.
Despite vibrational analysis predicting six vibrational modes for BH3, the IR spectrum obtained only illustrates three. This discrepancy between the spectra and the frequencies identified can be explained by the fact that there are two sets of vibrations which have the same frequencies and therefore correspond to the same vibrational mode. There are two vibrations at 1203.64 cm-1 and two vibrations at 2737.44 cm-1, therefore four of the vibrational modes identified actually contribute to two of the vibrational modes seen in the IR spectrum. The vibrational mode found at 1203.64 cm-1 is due to two degenerate vibrational modes, with symmetry E’, and likewise the vibrational mode at 2737.44 cm-1 is a consequence of two degenerate vibrational modes again with symmetry E’. Furthermore, one of the vibrational modes identified by the vibrational analysis has an intensity of 0.0000 and therefore exhibits no dipole moment. This vibrational mode has A1’ symmetry and is therefore totally symmetric and therefore will have no dipole moment. This vibrational mode is therefore IR inactive and will not be observed in the IR spectrum. The computational predictions for the vibrational modes of BH3 were found to be very consistent with the literature values, with a very marginal error associated on average between the calculated values and the literature values.
BH3 Molecular Orbital Analysis
The quantitative molecular orbitals of BH3 were calculated using Gausseview 5.0. The checkpoint file from the optimisation of BH3 was opened and a duplicate file was saved for the Mo calculation. To calculate the Mo orbitals by talking into account the electronic structure of the molecule the job type was altered to ‘Energy NBO’ and ‘Full NBO’ was selected in the NBO tab. This was submitted to scan and the checkpoint file was then opened and the molecular orbitals calculated could be visualised and therefore analysed. To access the accuracy of these calculations the qualitative molecular orbitals were represented in the qualitative Mo diagram. The MO diagram was drawn in ChemDraw. The LACO method was used to draw the Mo diagram due to the simplicity of the molecule. The molecule is split into molecular fragments (B and H3) and by using the reduction and projection formulae it was then possible to determine the trigonal planar H3 fragment orbitals. The relative electronegativies of the two fragments was then accessed in order to determine the placing of the H3 fragment orbitals relative to the boron atomic orbitals. The electropositivity of boron and hydrogen is very similar but boron is very slightly more electropositive and therefore lies higher in energy than the fragment orbitals of H3. The symmetry labels were determined and it was then possible to determine the correct mixing. Finally, electrons were then added. The short comings of this qualitative technique for the analysis of the molecular orbitals of a molecule is that it is very difficult to accurately determine the relative energy gaps between MOs and fragment orbitals, although estimation is obviously possible. In order to gain a more precise ‘picture’ computational analysis is needed to gain quantitative information. The two qualitative and quantitative methods of determining the molecular orbitals of a molecule can then be best compared by attempting to match the qualitative MOs drawn with those calculated by computational methods. Obviously, those calculated via computational methods will not necessarily have the distinct p-orbital or s-orbital shapes and therefore one must just try and match them by eye, although it is possible to gain some idea from the general shape of the charge distribution.
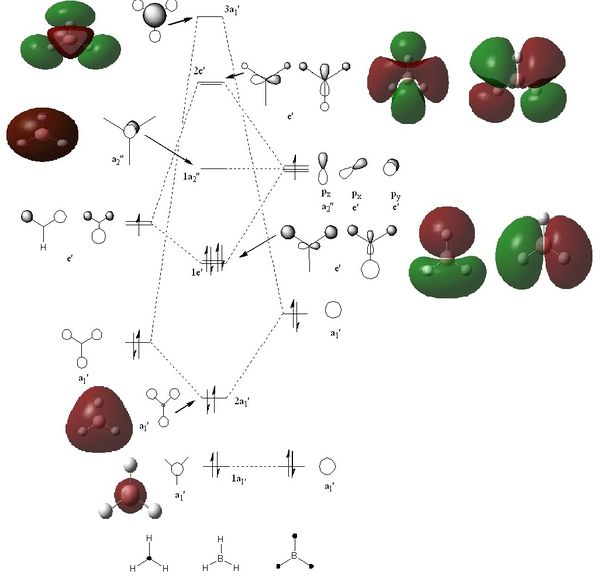
The predicted ordering or molecular orbitals in the qualitative Mo diagram matched the calculated molecular orbitals energies. However, there are two plausible arguments for the ordering of 3a1’ and e’. the ordering of the atomic/fragment orbitals that are mixed to form the 3a1’ are lower than those that mix to form the e’ molecular orbital, presenting the possibility that the e’ mixed molecular orbital could be higher in energy than the 3a1’ mixed molecular orbital. On the other hand, s-s overlap is far stronger than s-p overlap and therefore in that respect one would expect the 3a1’ molecular orbital to be higher than the e’ molecular orbital. The calculated energies of the BH3 molecular orbitals correlate with the qualitative prediction, since the 3a1’ MO is higher in energy than the e’ MO (0.19236 versus 0.18879 respectively). To determine the ordering of these orbitals without computational analysis one would have to conduct further mathematical calculations. Therefore, from this analysis one can see that qualitative molecular analysis is fairly accurate and produces a useful representation of molecular orbitals. However, to gain a better indication of the electronic molecular effects on the molecular orbitals and quantitative information, computational analysis would provide a more comprehensive ‘picture’.
BH3 Charge distribution Analysis (NBO analysis)
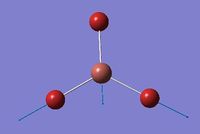
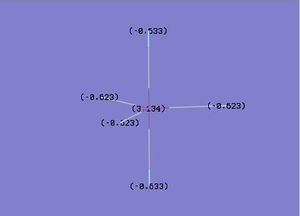
From the same file produced by the Mo calculations for BH3 it is possible to view the charge distribution in the molecule. Initially this is represented using colours but it also possible to illustrate the charge distribution in numbers. Both representations of the charge distribution of BH3 are shown below. In the picture depicting charge distribution using colours, green represents positive regions and red represents negative regions.
 |
 |
Therefore, as one would expect BH3 consists of a highly electron deficient central boron atom surrounded by three equally negatively charged hydride ions. One would expect boron to be highly electron deficient since it is Lewis acidic since it has an empty low lying p-orbital.
The Summary of Natural Population Analysis taken from the log. file from the NBO analysis is shown below. the values under the heading 'Natural charge' corresponds charge the numbers displayed on teh image above where charge distribution is illustrated numerically.
Summary of Natural Population Analysis:

                                       Natural Population
                Natural  -----------------------------------------------
    Atom  No    Charge         Core      Valence    Rydberg      Total
 -----------------------------------------------------------------------
      B    1    0.33161      1.99903     2.66935    0.00000     4.66839
      H    2   -0.11054      0.00000     1.11021    0.00032     1.11054
      H    3   -0.11054      0.00000     1.11021    0.00032     1.11054
      H    4   -0.11054      0.00000     1.11021    0.00032     1.11054
 =======================================================================
   * Total *    0.00000      1.99903     6.00000    0.00097     8.00000
The data shown below illustrates the bonding of the molecular orbitals and effect of orbital contributions (s and p) on the molecular obrtials.
       (Occupancy)   Bond orbital/ Coefficients/ Hybrids
 ---------------------------------------------------------------------------------
     1. (1.99853) BD ( 1) B   1 - H   2
                ( 44.48%)   0.6669* B   1 s( 33.33%)p 2.00( 66.67%)
                                            0.0000  0.5774  0.0000  0.0000  0.0000
                                            0.8165  0.0000  0.0000  0.0000
                ( 55.52%)   0.7451* H   2 s(100.00%)
                                            1.0000  0.0000
     2. (1.99853) BD ( 1) B   1 - H   3
                ( 44.48%)   0.6669* B   1 s( 33.33%)p 2.00( 66.67%)
                                            0.0000  0.5774  0.0000  0.7071  0.0000
                                           -0.4082  0.0000  0.0000  0.0000
                ( 55.52%)   0.7451* H   3 s(100.00%)
                                            1.0000  0.0000
     3. (1.99853) BD ( 1) B   1 - H   4
                ( 44.48%)   0.6669* B   1 s( 33.33%)p 2.00( 66.67%)
                                            0.0000  0.5774  0.0000 -0.7071  0.0000
                                           -0.4082  0.0000  0.0000  0.0000
                ( 55.52%)   0.7451* H   4 s(100.00%)
                                            1.0000  0.0000
     4. (1.99903) CR ( 1) B   1           s(100.00%)
                                            1.0000  0.0000  0.0000  0.0000  0.0000
                                            0.0000  0.0000  0.0000  0.0000
     5. (0.00000) LP*( 1) B   1           s(100.00%)
     6. (0.00000) RY*( 1) B   1           s(  0.00%)p 1.00(100.00%)
     7. (0.00000) RY*( 2) B   1           s(  0.00%)p 1.00(100.00%)
     8. (0.00000) RY*( 3) B   1           s(  0.00%)p 1.00(100.00%)
Normal 0 false false false EN-GB X-NONE X-NONE [4]
The first three NBOs involve the central boron atom and one hydrogen atom. The boron atom contributes 44.48% to each MO where 33.33% is s-character and 66.67% is p-character. The hydrogen atom contributes 55.52% to each MO (where 100% is s-character). Therefore the first three molecular orbitals are sp2 hybridised. The fourth NBO is the s atomic orbital of boron and therefore the boron atom contributes 100% to the MO and it is 100% s-character. This does not match the qualitative MO prediction, which places the fourth NBO as a non-bonding pz orbital, which would there be 100% p-character. The fifth NBO corresponds to the boron unoccupied lone pair and therefore should have 100% p-character; however the computational calculations indicate that it is 100% s-character which is obviously wrong. This discrepancy between the calculated outcome and the qualitative prediction demonstrates that although computational modelling and analysis does at times give quantitative information that would have to otherwise mathematically calculated, it is not always accurate.
the Second Order Pertubation Theory Analysis demonstrates the mixing that occurs between molecular orbitals. there is no molecular orbital mixing in BH3 and therefore the information below just demonstrates that NBO analysis allows one to obtain such information which is important for other molecules.
Second Order Perturbation Theory Analysis of Fock Matrix in NBO Basis

     Threshold for printing:   0.50 kcal/mol
                                                                              E(2)  E(j)-E(i) F(i,j)
         Donor NBO (i)                     Acceptor NBO (j)                 kcal/mol   a.u.    a.u.
 ===================================================================================================

 within unit  1
   4. CR (   1) B   1                / 10. RY*(   1) H   2                    1.51    7.54    0.095
   4. CR (   1) B   1                / 11. RY*(   1) H   3                    1.51    7.54    0.095
   4. CR (   1) B   1                / 12. RY*(   1) H   4                    1.51    7.54    0.095
The Natural Bond Anaylsis deomonstrates the energy and populatin or occupation of the B-H bond and the boron lone pair (LP*)
 Natural Bond Orbitals (Summary):

                                                            Principal Delocalizations
           NBO                        Occupancy    Energy   (geminal,vicinal,remote)
 ====================================================================================
 Molecular unit  1  (H3B)
     1. BD (   1) B   1 - H   2          1.99853    -0.43712
     2. BD (   1) B   1 - H   3          1.99853    -0.43712
     3. BD (   1) B   1 - H   4          1.99853    -0.43712
     4. CR (   1) B   1                  1.99903    -6.64476  10(v),11(v),12(v)
     5. LP*(   1) B   1                  0.00000     0.67666
     6. RY*(   1) B   1                  0.00000     0.37177
     7. RY*(   2) B   1                  0.00000     0.37177
     8. RY*(   3) B   1                  0.00000    -0.04532
     9. RY*(   4) B   1                  0.00000     0.43446
    10. RY*(   1) H   2                  0.00032     0.90016
    11. RY*(   1) H   3                  0.00032     0.90016
    12. RY*(   1) H   4                  0.00032     0.90016
    13. BD*(   1) B   1 - H   2          0.00147     0.41201
    14. BD*(   1) B   1 - H   3          0.00147     0.41201
    15. BD*(   1) B   1 - H   4          0.00147     0.41201
       -------------------------------
              Total Lewis    7.99463  ( 99.9329%)
        Valence non-Lewis    0.00441  (  0.0551%)
        Rydberg non-Lewis    0.00097  (  0.0121%)
       -------------------------------
            Total unit  1    8.00000  (100.0000%)
           Charge unit  1    0.00000
Computational Molecular Modelling Analysis of TlBr3
TlBr3 Optimisation
TlBr3, similarly to BH3 is drawn suing Gaussview 5.0 and optimised. It is optimised using the optimisation job type, with the B3YP method and the LAND2DZ basis set which is used on heavier atoms. Unlike BH3, TlBr3 is a much more complex molecule with a much larger/heavier central atom and essentially far more electrons (181 electrons). Therefore in order to speed-up this calculation the point group of TlBr3 was restricted to D3h and the tolerance was increased to ‘very tight (0.0001)’, which also helped prevent the optimisation leading to the transition state or a false minima. The calculation was submitted to scan and the results were obtained swiftly. The results of optimised TlBr3 molecule are summarised below.
File Name = TlBr3_OPTIMISATION KHL
File Type = .log
Calculation Type = FOPT
Calculation Method = RB3LYP
Basis Set = LANL2DZ
Charge = 0
Spin = Singlet
Total Energy = -91.211812851 a.u
RMS Gradient Norm = 0.00000090 a.u
Imaginary Freq = -
Dipole Moment = 0.0000 Debye
Point Group = D3H
Job cpu time: 0 days 0 hours 0 minutes 10.0 seconds
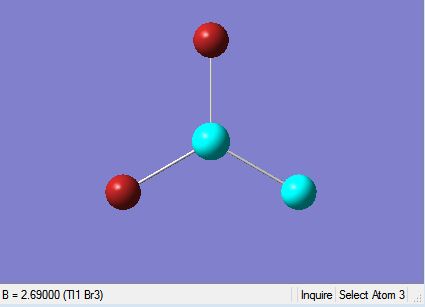
| Tl-Br Bond Length in TlBr3 | Br-Tl-Br Bond Angle in TlBr3 |
|---|---|
 |
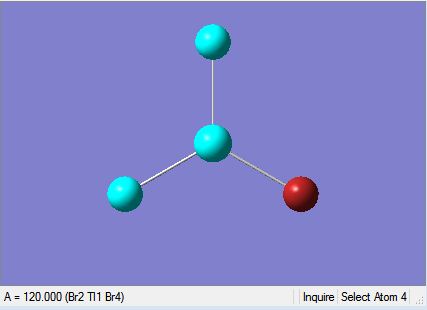 |
The results are also illustrated in the two images above. The optimised molecule was found to have a Tl-Br bond length of 2.65 Å and a Br-Tl-Br bond angle of 120°, which corresponds to trigonal planar geometry. The symmetrical nature of the molecule is echoed by the dipole moment, which is zero. The bond lengths and bond angle hold up well against literature values where the Tl-Br bond length 2.55 Å is and the Br-Tl-Br bond angle is 120°.
The data taken from the log file below shows the bond lengths and bond angles seen in the molecule in the raw data. The data below also illustrates that the optimisation of TlBr3 was successful since everything converged and the RMS gradient is very close to 0.00, indicating that the molecule reached the minima on the PES curve. This minimum was achieved in three iterations and the decrease in total energy of the molecule after each successively is illustrated by the total energy graph below. The energy gradient graph is also shown below.
 Item               Value     Threshold  Converged?
 Maximum Force            0.000002     0.000450     YES
 RMS     Force            0.000001     0.000300     YES
 Maximum Displacement     0.000022     0.001800     YES
 RMS     Displacement     0.000014     0.001200     YES
 Predicted change in Energy=-6.083913D-11
 Optimization completed.
    -- Stationary point found.
                           ----------------------------
                           !   Optimized Parameters   !
                           ! (Angstroms and Degrees)  !
 --------------------------                            --------------------------
 ! Name  Definition              Value          Derivative Info.                !
 --------------------------------------------------------------------------------
 ! R1    R(1,2)                  2.651          -DE/DX =    0.0                 !
 ! R2    R(1,3)                  2.651          -DE/DX =    0.0                 !
 ! R3    R(1,4)                  2.651          -DE/DX =    0.0                 !
 ! A1    A(2,1,3)              120.0            -DE/DX =    0.0                 !
 ! A2    A(2,1,4)              120.0            -DE/DX =    0.0                 !
 ! A3    A(3,1,4)              120.0            -DE/DX =    0.0                 !
 ! D1    D(2,1,4,3)            180.0            -DE/DX =    0.0                 !
 --------------------------------------------------------------------------------
 GradGradGradGradGradGradGradGradGradGradGradGradGradGradGradGradGradGrad
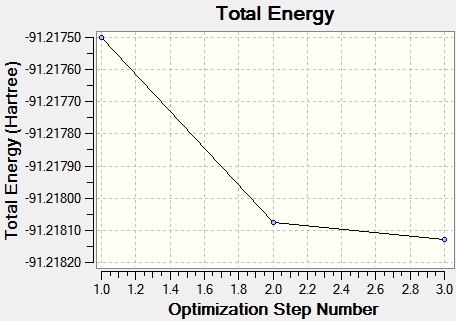
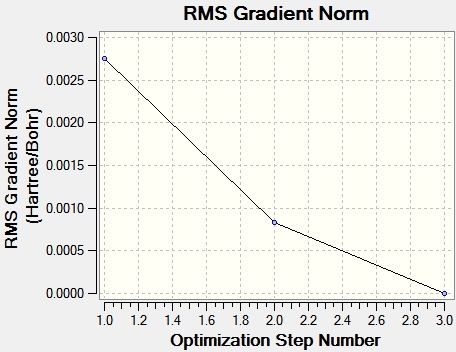
TlBr3 Vibrational Analysis
In order to provide confirmation that the global minimum has indeed been found through optimisation vibrational analysis was conducted. This was conducted by doing a frequency job type calculation, again using the B3LYP method with the LANL2DZ basis set. If a low level optimisation is conducted before vibrational analysis it is possible that the PES minima has not been found, this is demonstrated by negative frequencies when the vibrational analysis is undertaken.
File Name = TlBr3_Freq_IR_khl
File Type = .log
Calculation Type = FREQ
Calculation Method = RB3LYP
Basis Set = LANL2DZ
Charge = 0
Spin = Singlet
Total Energy = -91.211812851 a.u
RMS Gradient Norm = 0.00000088 a.u
Imaginary Freq = -
Dipole Moment = 0.0000 Debye
Point Group = D3H
Job cpu time: 0 days 0 hours 0 minutes 19.0 seconds
By looking at the log file one can obtain the ‘low frequencies’. The lowest ‘real’ frequency is however 46.489 cm-1 which is positive. No real significant negative frequencies were found from the vibrational analysis and therefore the optimisation previously conducted can be deemed acceptable and to have reached the global minimum.
Low frequencies ---   -3.4213   -0.0026   -0.0004    0.0015    3.9367    3.9367
 Low frequencies ---   46.4289   46.4292   52.1449
 Harmonic frequencies (cm**-1), IR intensities (KM/Mole), Raman scattering
 activities (A**4/AMU), depolarization ratios for plane and unpolarized
 incident light, reduced masses (AMU), force constants (mDyne/A),
 and normal coordinates:
                     1                      2                      3
                    E'                     E'                     A2"
 Frequencies --    46.4289                46.4292                52.1449
 Red. masses --    88.4613                88.4613               117.7209
 Frc consts  --     0.1124                 0.1124                 0.1886
 IR Inten    --     3.6867                 3.6867                 5.8466
  Atom  AN      X      Y      Z        X      Y      Z        X      Y      Z
     1  81     0.00   0.28   0.00    -0.28   0.00   0.00     0.00   0.00   0.55
     2  35     0.00   0.26   0.00     0.74   0.00   0.00     0.00   0.00  -0.48
     3  35     0.43  -0.49   0.00    -0.01  -0.43   0.00     0.00   0.00  -0.48
     4  35    -0.43  -0.49   0.00    -0.01   0.43   0.00     0.00   0.00  -0.48
Vibrational analysis of TlBr3 found six vibrational modes, which are tabulated below.

Gaussview determines the existence of a bond between atoms by the distance between two atoms. This generally does work well; however, when the distance between atoms exceeds what Gaussview deems reasonable for a bond to exist, no bond is shown. This is a short coming of Gaussview, and perhaps a measure of electron density between the two atoms would be a better parameter for determining the presence of a bond rather than distance. This occurred either, where on optimisation of BH3 there appeared to be no bonding between the central Boron atom and the hydride ions; however, despite the lack of actual bonds one can see from the graphical MOs that there is still significant bonding interaction between these atoms. Therefore, one can determine that Gaussview uses a very simplistic approach when characterising the bonding between atoms and therefore one should be sceptical when a Gaussview optimises a molecule that it deems has no bonds.
A bond can be defined as an attractive force that binds atoms or substituents in a molecule together. Bonds can be categorised in a very general manner as covalent, metallic, or ionic. Essentially a bond is an area of high electron density, where attractive forces between atoms are high, forming a bond. One can qualitatively look at bonding to decipher the type of bonding that may exist between atoms, however computational analysis allows one to game a quantitative idea of the bonding that exists in molecules by allowing one to gain a numerical illustration of bonding and molecular orbitals which allow one to visually see the areas of electron density within the molecule.
Computational Analysis of Mo(CO)4(PCl3)2 using Molecular Modelling
Mo(CO)4(PCl3)2 Optimisation
| Optimised Cis-Mo Complex | Optimised Trans-Mo Complex | |
|---|---|---|
 |
 | |
| Jmol | Jmol |
Initially the cis and trans isomer of Mo(CO)4(PCl3)2 was drawn using Gaussview. This is complex is not dissimilar to Mo(CO)4(PPh3)2, however it is less computational demanding. Nevertheless, Mo(CO)4(PCl3)2 is still a complex molecule to model computationally, since it is a large molecule with a large number of electrons and requires pseudo potentials (due to the heavy Cl atoms). In order to optimise this molecule correctly it was optimised three times using different methods, with each successive method conducting a higher level calculation on the molecule to ensure the global minimum was found. Initially one started with a ‘loose’ optimisation by using an optimisation job type with the B3LYP method, the LANL2MB pseudo-potential and additional key words, opt=loose. These calculations were run on SCAN. The summary of the results for the cis and trans isomers are shown below.
File Name = khl_cis-MoComplex_LooseOpt File Type = .log Calculation Type = FOPT Calculation Method = RB3LYP Basis Set = LANL2MB Charge = 0 Spin = Singlet Total Energy = -617.52510215 a.u RMS Gradient Norm = 0.00001129 a.u Imaginary Freq = - Dipole Moment = 8.6236 Debye Point Group = C1 Job cpu time: 0 days 1 hours 4 minutes 8.5 seconds |
File Name = khl_trans-MoComplex_LooseOpt File Type = .log Calculation Type = FOPT Calculation Method = RB3LYP Basis Set = LANL2MB Charge = 0 Spin = Singlet Total Energy = -617.52205801 a.u RMS Gradient Norm = 0.00006169 a.u Imaginary Freq = - Dipole Moment = 0.0000 Debye Point Group = C1 Job cpu time: 0 days 0 hours 8 minutes 7.0 seconds |
The ‘loose’ optimisation yielded some reasonable bond angles and bond lengths but the dihedral angle and the orientation of the two PCl3 groups relative to each other appeared to be wrong. Therefore, it was then necessary to adjust the dihedral angle manually. For the cis isomer the dihedral angle between one of the Cl atoms on a PCl3 group was set to 0° with respect to the carbonyl, so that one Cl atoms is positioned up, parallel to the axial bond and a Cl atom on the other PCl3 group points down , in the opposite direction along the same angle. For the trans isomer the dihedral angle was altered by rotating one of the PCl3 groups so that it was exactly matching up with the opposite PCl3 group to ensure the two PCL3 ligands were eclipsed, with one Cl atom from each ligand positioned parallel to a Mo-C bond.
Therefore, these ‘loose’ optimisations were then built upon by optimising the isomers again using LANL2DZ basis set, accompanied by the key words, int=ultrafine scf=conver=9. The LANL2DZ is a much higher basis set and therefore requires these additional key words to provide a tighter convergence criteria. The LANL2DZ includes pseudo-potentials that take into account heavier atoms, such as Cl in this case. This gives a much more accurate determination of the bond lengths, bond angles and optimised geometry of the molecule. The summary of the results of the cis and trans isomers are shown below.
File Name = khl_cis-MoComplex_LANL2DZOpt File Type = .log Calculation Type = FOPT Calculation Method = RB3LYP Basis Set = LANL2DZ Charge = 0 Spin = Singlet Total Energy = -623.57707176 a.u RMS Gradient Norm = 0.00004673 a.u Imaginary Freq = - Dipole Moment = 1.3074 Debye Point Group = C1 Job cpu time: 0 days 0 hours 42 minutes 35.7 seconds |
File Name = khl_trans-MoComplex_LANL2DZOpt File Type = .log Calculation Type = FOPT Calculation Method = RB3LYP Basis Set = LANL2DZ Charge = 0 Spin = Singlet Total Energy = -623.57592251 a.u RMS Gradient Norm = 0.00001372 a.u Imaginary Freq = - Dipole Moment = 0.0000 Debye Point Group = C1 Job cpu time: 0 days 0 hours 32 minutes 10.4 seconds |
The results above show a much more accurate optimisation of the two isomers. However, this optimisation has not taken into account the presence of Phosphorus’s low lying d-orbitals, since P likes to be hypervalent and often uses its low lying dAOs. Therefore, the input file is modified for the last time to take into account the present of dAOs and the summary of results for this final optimisation for both isomers is shown below.
File Name = khl_cis-MoComplex_addingpAOinteraction File Type = .log Calculation Type = FOPT Calculation Method = RB3LYP Basis Set = GEN Charge = 0 Spin = Singlet Total Energy = -623.69291226 a.u RMS Gradient Norm = 0.00002100 a.u Imaginary Freq = - Dipole Moment = 0.0737 Debye Point Group = C1 Job cpu time: 0 days 0 hours 32 minutes 5.0 seconds |
File Name = khl_trans-MoComplex_addingPAOinteraction File Type = .log Calculation Type = FOPT Calculation Method = RB3LYP Basis Set = Gen Charge = 0 Spin = Singlet Total Energy = -623.69396833 a.u RMS Gradient Norm = 0.00002422 a.u Imaginary Freq = - Dipole Moment = 0.0000 Debye Point Group = C1 Job cpu time: 0 days 0 hours 34 minutes 52.3 seconds |
From the results summaries above one can see that as the optimisation calculations became tighter and took into account the heavy atoms (pseudo potentials) and the low lying dAOs the optimisation of the isomers improved. The ‘loose’ optimisation yielded energies of -617.525 a.u and -617.522 a.u for the cis and trans isomers respectively, thus with an energy difference of 0.003. The LANL2DZ optimisation yielded energies of -623.577 a.u and -623.576 a.u for the cis and trans isomers respectively, therefore with an energy difference of 0.001. The LANL2DZ optimisation, taking into account the presence of low lying dAOs yielded energies of -623.693 a.u -623.694 a.u, therefore with an energy difference of 0.001. Therefore, as the optimisation calculations tightened, the energy of the isomers decreased, with the energy gap between the two isomers decreasing to a very small, unsubstantial quantity, which perhaps is untrue of the actual difference in energies experimentally.
| Bond Type | Optimised Cis-Mo Complex Bond Lengths (A) | Optimised Trans-Mo Complex Bond Lengths (A) |
|---|---|---|
| Mo-C | 2.02 | 2.06 |
| C=O | 1.18 | 1.17 |
| Mo-P | 2.48 | 2.42 |
| P-Cl | 2.12 | 2.12 |
Once optimised, it is possible to find the bond lengths within the isomers. The table above shows the bond lengths found in the optimised molecules. The largest difference in bond lengths is observed in the Mo-P bond lengths which differ by 0.06 A, where the cis isomer has a longer Mo-P bond length. This may be rationalised by the bulky Cl atoms in the PCl3 groups which may cause the bond to lengthen in order to reduce steric strain. The steric strain in the cis isomer may be one of the factors contributing to the increased stability of the trans isomer relative to the cis isomer. It is also worth commenting on the Mo-C bond distances which alos differ slightly. The Mo-C bond in the cis isomer is slightly shorter than the Mo-C bond in the trans isomer (a difference of 0.04 A). One could rationalise this with the trans-effect by taking into to account the positioning of the Co ligands in the cis isomer, which are trans to the PCl3 ligands. This effect could be caused by donation of electron density from the Phosphorous lone pair into the metal, thus decreasing the bond strength of then Mo-C bond trans to it.
Mo(CO)4(PCl3)2 Vibrational Analysis
In order to determine whether the global minimum was found during optimisation vibrational analysis was conducted to determine whether there were any negative frequencies, which would indicate that the molecule had been optimised to its transition state or to an untrue minimum. The summary from the output log file is shown below.
File Name = khl_cis-MoComplex_Freq1
File Type = .log
Calculation Type = FREQ
Calculation Method = RB3LYP
Basis Set = LANL2DZ
Charge = 0
Spin = Singlet
Total Energy = -623.57707195 a.u
RMS Gradient Norm = 0.00000499 a.u
Imaginary Freq = -
Dipole Moment = 1.3101 Debye
Point Group = C1
Job cpu time: 0 days 0 hours 28 minutes 55.5 seconds
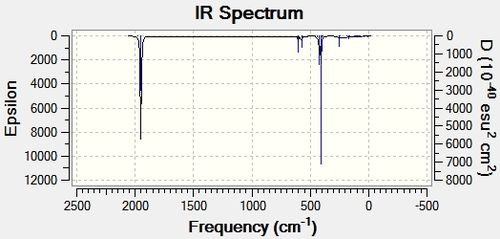
From the results below one can see that there were no negative frequencies, indicating that the two isomers had reached their global minimum during optimisation. Looking closely at the frequencies and the IR spectra for the cis isomer one can see that the vibrational analysis has predicted there for be four vibrational modes within the C=O stretching region. According to the predicted IR the vibrational modes occur at 1945.42 cm-1, 1948.63 cm-1, 1958.38 cm-1 and 2023.30 cm-1. This correlates with the literature found. The trans isomer only has one distinct vibrational mode in the carbonyl since two of the frequencies are predicted to be degenerate (1950.29 cm-1 and 1950.91 cm-1, Eu symmetry) and therefore only one peak would be observed. The remaining two frequencies identified have very low intensities so it is assumed they are IR inactive and are not observed.
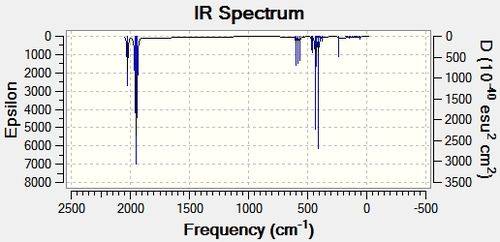
| Vibration | Symmetry | Vibrational Mode Description | Frequency (cm-1) | Intensity | Literature Frequency (cm-1) |
|---|---|---|---|---|---|
| 1 | b2' | 1945.34 | 763.5186 | ||
| 2 | b2 | 1948.64 | 1497.7282 | ||
| 3 | a1' | 1958.38 | 632.1413 | ||
| 4 | a1' | 2023.30 | 598.3762 |
File Name = khl_cis-MoComplex_Freq1
File Type = .log
Calculation Type = FREQ
Calculation Method = RB3LYP
Basis Set = LANL2DZ
Charge = 0
Spin = Singlet
Total Energy = -623.577603112 a.u
RMS Gradient Norm = 0.00000144 a.u
Imaginary Freq = -
Dipole Moment = 0.3044 Debye
Point Group = C1
Job cpu time: 0 days 0 hours 29 minutes 1.6 seconds
| Vibration | Symmetry | Frequency (cm-1) | Intensity |
|---|---|---|---|
| 1 | eu | 1950.29 | 1475.3917 |
| 2 | eu | 1950.91 | 1466.7906 |
| 3 | b1g | 1977.20 | 0.6554 |
| 4 | a1g | 2030.98 | 3.7873 |
The vibrtaional analysis yeidled frequencies that correlated with the literature, therefore, one can conclude that Gaussview provided an accurate prediction of the IR spectra of these two isomers.
Mini Project
- This mini project aims to:
- - Compare the relative stability and overall energies of SbF3 and SbF5 and SbCl3 and SbCl5
- - Compare axial versus equatorial bond distances
- - Compare the MOs of Sbf3 and SbF5, which will have a similar trend to comparing SbCl3 and SbCl5 but easier to model due to the size and the addition of a heavy atom.
- - Using NBO analysis one can look at the contributions by low lying dAOs to the bonding in SbF5 molecules.
Optimisation
Normal 0 false false false EN-GB X-NONE X-NONE
Initially one starts by drawing the four molecules in Gaussview. Each molecule was then subsequently optimised. Sb is a heavy atom and therefore requires its own individual basis set and pseudo-potential. Rather than using LANL2DZ basis set, I have used an explicit basis set and an explicit pseudo-potential for Sb. For all other atoms (F or Cl) I have used B3LYP/6-311G(d,p) as before. The initial optimisation was therefore done using the ‘GEN’ method with the DFT/B3LYP basis set, under a optimisation job type. The additional words, "pseudo=cards gfinput" were also used so that the explicit basis set and explicit PP could be added to the input file.
The explicit basis set for Sb was:
Sb     0

S   2   1.00

      0.5863000             -4.7537662

      0.4293000              5.1096593

S   1   1.00

      0.1078000              1.0000000

P   2   1.00

      1.1110000             -0.1811707

      0.2365000              1.0791649

P   1   1.00

      0.0800000              1.0000000

P   1   1.00

      0.0220000              1.0000000

D   1   1.00

      0.2070000              1.0000000
The explicit pseudo-potential for Sb was:
SB     0

SB-ECP     3     46

f potential

  6

0    227.2723558             -0.0692261

1     77.1429882            -31.5434712

2     26.0116501           -115.8407306

2      9.1421159            -42.0224212

2      2.9281082            -20.0463938

2      0.9231136             -2.8796028

s-f potential

  5

0    116.0010888              2.9331303

1     59.6755065             44.1104819

2     27.6135849            228.0198050

2      7.8045081             92.5610162

2      1.6934418             31.2537244

p-f potential

  5

0     27.8050796              4.9947369

1     10.3929685             38.0223860

2      3.6381067             62.0520654

2      1.9839681            -49.5489389

2      1.5546562             51.3666000

d-f potential

  5

0     83.2183030              2.9738470

1     30.3070501             41.6495825

2     13.2014120            104.5919562

2      3.6961611             42.3187857

2      0.7711144              7.9413503
Despite following all the instructions given on wiki my molecules often broke down during optimisation. The main problem was with SbF3 and SbCl3, this is because Gaussview assumed the symmetry, which was wrong, and therefore when the molecule underwent vibrational analysis negative frequencies were observed. Negative frequencies occurred because the molecule was forced into a point group that didn’t fit the molecule and therefore the molecule was trying to vibrate out of the constraints of the point group that Gasussview had assigned it. Essentially, Sb is a large molecule and in the case of SbX3, like NH3, it has a lone pair. This lone pair meant that rather than having a D3h point group and having trigonal planar geometry, it should be in the C3v point group and have trigonal pyramidal geometry. It was obvious that the optimisation had not worked just from looking at the molecule, because logically one can deduce what the molecule should look like just frm basic principles. However, on checking the output file much of the out put file seemed to indicate that the calculation had been successful. There was ‘normal termination’ at the bottom of every file, all parameters converged and the RMS was low suggesting that it had reached it global minima. However on doing vibrational analysis negative frequencies appeared and the bond angles were all 120° which is not what one would expect. Therefore, in addition to the explicit basis set and the explicit PP, more additional words were added to the input file. Additional key words, int=ultrafine and scf=conver= 9 were added to the file, since one is using a highly specific basis set and PP therefore these addition words are needed to tighten up convergence criteria. The same result occurred and therefore one had to think again. I then tried adding another additional key word to the input file, “nosymm”, this restricts Gaussview from forming a symmetrical molecule (such as a trigonal planar geometry). This again didn’t work, which was very frustrating. Therefore, one then has to break the symmetry manually. This is a bit like guesswork and involves changing the connectivity information (the first section whereby each atom has a set of coordinates). It is guessed which coordinates to change and each coordinate was changed very very slightly (a couple of decimal points). This did finally work. However more problems later were encountered because the molecule required its own explicit basis set and PP the file often wiped itself for some unknown reason and therefore the ‘link’ would then immediately die once submitted to SCAN.
The results summaries for each optimisation and subsequent vibrational analysis follows.
SbF3
SbF3 was optimised and the vibrational analysis conducted in one strep by using the 'Opt+Freq' job type. This therefore allowed one to gain access to the vibrational modes which in this case was a very good indicator as to whether the molecule had optimised correctly. as you can see below, all parameters converged and no negative frequencies were found by the vibrational analysis, therefore the optimisation was successful.
File Name = khl_SbF3_Opt1
File Type = .log
Calculation Type = FREQ
Calculation Method = RB3LYP
Basis Set = Gen
Charge = 0
Spin = Singlet
Total Energy = -305.11008006 a.u
RMS Gradient Norm = 0.00002535 a.u
Imaginary Freq = -
Dipole Moment = 4.05760 Debye
Point Group = C1
Job cpu time: 0 days 0 hours 1 minutes 33.0 seconds
 Item               Value     Threshold  Converged?
 Maximum Force            0.000120     0.000450     YES
 RMS     Force            0.000051     0.000300     YES
 Maximum Displacement     0.001021     0.001800     YES
 RMS     Displacement     0.000763     0.001200     YES
 Predicted change in Energy=-6.456859D-08
 Optimization completed.
    -- Stationary point found.
                           ----------------------------
                           !   Optimized Parameters   !
                           ! (Angstroms and Degrees)  !
 --------------------------                            --------------------------
 ! Name  Definition              Value          Derivative Info.                !
 --------------------------------------------------------------------------------
 ! R1    R(1,2)                  1.9151         -DE/DX =    0.0                 !
 ! R2    R(1,3)                  1.9151         -DE/DX =    0.0                 !
 ! R3    R(1,4)                  1.9152         -DE/DX =    0.0                 !
 ! A1    A(2,1,3)               95.488          -DE/DX =    0.0                 !
 ! A2    A(2,1,4)               95.5113         -DE/DX =    0.0                 !
 ! A3    A(3,1,4)               95.5586         -DE/DX =   -0.0001              !
 ! D1    D(2,1,4,3)             96.0805         -DE/DX =    0.0                 !
 --------------------------------------------------------------------------------
Low frequencies ---   -4.2975    0.0001    0.0003    0.0006    1.7768    4.3591
 Low frequencies ---  187.6120  187.7573  238.6821
SbF5
SbF5 was optimised via an optimisation job type and then followed with a vibrational analysis calculation. This therefore allowed one to gain access to the vibrational modes which in this case was a very good indicator as to whether the molecule had optimised correctly. As you can see below, all parameters converged and no negative frequencies were found by the vibrational analysis, therefore the optimisation was successful.
File Name = khl_SbF5_Opt1
File Type = .log
Calculation Type = FOPT
Calculation Method = RB3LYP
Basis Set = Gen
Charge = 0
Spin = Singlet
Total Energy = - a.u
RMS Gradient Norm = 0.0000 a.u
Imaginary Freq = -
Dipole Moment = 0.000 Debye
Point Group = D3h
Job cpu time: 0 days 0 hours 0 minutes 0.0 seconds
Item               Value     Threshold  Converged?
 Maximum Force            0.000139     0.000450     YES
 RMS     Force            0.000053     0.000300     YES
 Maximum Displacement     0.000578     0.001800     YES
 RMS     Displacement     0.000212     0.001200     YES
 Predicted change in Energy=-1.171371D-07
 Optimization completed.
    -- Stationary point found.
                           ----------------------------
                           !   Optimized Parameters   !
                           ! (Angstroms and Degrees)  !
 --------------------------                            --------------------------
 ! Name  Definition              Value          Derivative Info.                !
 --------------------------------------------------------------------------------
 ! R1    R(1,2)                  1.8745         -DE/DX =   -0.0001              !
 ! R2    R(1,3)                  1.8745         -DE/DX =   -0.0001              !
 ! R3    R(1,4)                  1.8745         -DE/DX =   -0.0001              !
 ! R4    R(1,5)                  1.887          -DE/DX =    0.0001              !
 ! R5    R(1,6)                  1.887          -DE/DX =    0.0001              !
 ! A1    A(2,1,3)              120.0            -DE/DX =    0.0                 !
 ! A2    A(2,1,4)              120.0            -DE/DX =    0.0                 !
 ! A3    A(2,1,5)               90.0            -DE/DX =    0.0                 !
 ! A4    A(2,1,6)               90.0            -DE/DX =    0.0                 !
 ! A5    A(3,1,4)              120.0            -DE/DX =    0.0                 !
 ! A6    A(3,1,5)               90.0            -DE/DX =    0.0                 !
 ! A7    A(3,1,6)               90.0            -DE/DX =    0.0                 !
 ! A8    A(4,1,5)               90.0            -DE/DX =    0.0                 !
 ! A9    A(4,1,6)               90.0            -DE/DX =    0.0                 !
 ! D1    D(2,1,4,3)            180.0            -DE/DX =    0.0                 !
 ! D2    D(2,1,5,3)           -120.0            -DE/DX =    0.0                 !
 ! D3    D(2,1,6,3)            120.0            -DE/DX =    0.0                 !
 ! D4    D(2,1,5,4)            120.0            -DE/DX =    0.0                 !
 ! D5    D(2,1,6,4)           -120.0            -DE/DX =    0.0                 !
 ! D6    D(3,1,5,4)           -120.0            -DE/DX =    0.0                 !
 ! D7    D(3,1,6,4)            120.0            -DE/DX =    0.0                 !
 --------------------------------------------------------------------------------
File Name = khl_SbF5_Opt1
File Type = .log
Calculation Type = FREQ
Calculation Method = RB3LYP
Basis Set = Gen
Charge = 0
Spin = Singlet
Total Energy = -504.82588017 a.u
RMS Gradient Norm = 0.00005678 a.u
Imaginary Freq = -
Dipole Moment = 0.0000 Debye
Point Group = D3h
Job cpu time: 0 days 0 hours 1 minutes 2.3 seconds
Low frequencies ---  -11.7348  -11.7203   -0.0275   -0.0085    0.0112   13.1961
 Low frequencies ---   86.5224   86.5226  248.4196
SbCl3
SbCl3 was optimised and the vibrtaional analysis conducted all in one calculation in order to speed up the time taken for calculations.This therefore allowed one to gain access to the vibrational modes which in this case was a very good indicator as to whether the molecule had optimised correctly. As you can see below, all parameters converged and no negative frequencies were found by the vibrational analysis, therefore the optimisation was successful.
File Name = sbcl3_optf2_WORKED
File Type = .log
Calculation Type = FREQ
Calculation Method = RB3LYP
Basis Set = Gen
Charge = 0
Spin = Singlet
Total Energy = -1386.19575913 a.u
RMS Gradient Norm = 0.00007908 a.u
Imaginary Freq = -
Dipole Moment = 3.2794 Debye
Point Group = C1
Job cpu time: 0 days 0 hours 1 minutes 51.9 seconds
Item               Value     Threshold  Converged?
 Maximum Force            0.000197     0.000450     YES
 RMS     Force            0.000083     0.000300     YES
 Maximum Displacement     0.001767     0.001800     YES
 RMS     Displacement     0.000900     0.001200     YES
 Predicted change in Energy=-1.929018D-07
 Optimization completed.
    -- Stationary point found.
                           ----------------------------
                           !   Optimized Parameters   !
                           ! (Angstroms and Degrees)  !
 --------------------------                            --------------------------
 ! Name  Definition              Value          Derivative Info.                !
 --------------------------------------------------------------------------------
 ! R1    R(1,2)                  2.3839         -DE/DX =    0.0                 !
 ! R2    R(1,3)                  2.3839         -DE/DX =    0.0                 !
 ! R3    R(1,4)                  2.3831         -DE/DX =    0.0002              !
 ! A1    A(2,1,3)               97.6287         -DE/DX =    0.0                 !
 ! A2    A(2,1,4)               97.6156         -DE/DX =    0.0                 !
 ! A3    A(3,1,4)               97.58           -DE/DX =    0.0001              !
 ! D1    D(2,1,4,3)             98.7954         -DE/DX =    0.0                 !
 --------------------------------------------------------------------------------
Low frequencies ---   -7.1566   -5.8495   -4.8814   -0.0026   -0.0016   -0.0014
 Low frequencies ---  115.3156  115.4055  143.2591
SbCl5
Again, like SbCl3 as optimised and the vibrtaional analysis conducted all in one calculation in order to speed up the time taken for calculations. This therefore allowed one to gain access to the vibrational modes which in this case was a very good indicator as to whether the molecule had optimised correctly. As you can see below, all parameters converged and no negative frequencies were found by the vibrational analysis, therefore the optimisation was successful.
File Name = sbcl5_optf2_WORKED
File Type = .log
Calculation Type = FREQ
Calculation Method = RB3LYP
Basis Set = Gen
Charge = 0
Spin = Singlet
Total Energy = -2306.62866175 a.u
RMS Gradient Norm = 0.00002802 a.u
Imaginary Freq = -
Dipole Moment = 0.0000 Debye
Point Group = D3h
Job cpu time: 0 days 0 hours 2 minutes 26.2 seconds
Item               Value     Threshold  Converged?
 Maximum Force            0.000084     0.000450     YES
 RMS     Force            0.000026     0.000300     YES
 Maximum Displacement     0.000693     0.001800     YES
 RMS     Displacement     0.000215     0.001200     YES
 Predicted change in Energy=-5.811032D-08
 Optimization completed.
    -- Stationary point found.
                           ----------------------------
                           !   Optimized Parameters   !
                           ! (Angstroms and Degrees)  !
 --------------------------                            --------------------------
 ! Name  Definition              Value          Derivative Info.                !
 --------------------------------------------------------------------------------
 ! R1    R(1,2)                  2.3507         -DE/DX =    0.0                 !
 ! R2    R(1,3)                  2.387          -DE/DX =    0.0001              !
 ! R3    R(1,4)                  2.3507         -DE/DX =    0.0                 !
 ! R4    R(1,5)                  2.3507         -DE/DX =    0.0                 !
 ! R5    R(1,6)                  2.387          -DE/DX =    0.0001              !
 ! A1    A(2,1,3)               90.0            -DE/DX =    0.0                 !
 ! A2    A(2,1,4)              120.0            -DE/DX =    0.0                 !
 ! A3    A(2,1,5)              120.0            -DE/DX =    0.0                 !
 ! A4    A(2,1,6)               90.0            -DE/DX =    0.0                 !
 ! A5    A(3,1,4)               90.0            -DE/DX =    0.0                 !
 ! A6    A(3,1,5)               90.0            -DE/DX =    0.0                 !
 ! A7    A(4,1,5)              120.0            -DE/DX =    0.0                 !
 ! A8    A(4,1,6)               90.0            -DE/DX =    0.0                 !
 ! A9    A(5,1,6)               90.0            -DE/DX =    0.0                 !
 ! D1    D(2,1,4,3)            -90.0            -DE/DX =    0.0                 !
 ! D2    D(2,1,5,3)             90.0            -DE/DX =    0.0                 !
 ! D3    D(2,1,5,4)            180.0            -DE/DX =    0.0                 !
 ! D4    D(2,1,6,4)           -120.0            -DE/DX =    0.0                 !
 ! D5    D(2,1,6,5)            120.0            -DE/DX =    0.0                 !
 ! D6    D(3,1,5,4)             90.0            -DE/DX =    0.0                 !
 ! D7    D(4,1,6,5)           -120.0            -DE/DX =    0.0                 !
 --------------------------------------------------------------------------------
Low frequencies ---   -5.4594   -5.4481   -1.8020   -0.0045   -0.0021    0.0924
 Low frequencies ---   52.5245   52.5257  163.5137
Summarised Results from Optimisation
The results found from the optimisation of each molecule are shown below.
| Molecule | Total Energy (a.u) | Dipole Moment (Debye) | RMS Gradient | Point Group | Sb-X Bond Length (A) | X-Sb-X Bond Angle (Degrees) |
|---|---|---|---|---|---|---|
| SbF3 | -305.11008 | 4.0576 | 0.00002535 | C1 | 1.91516 | 95.559 |
| SbF5 | -504.82588 | 0.0000 | 0.00005684 | D3h | 1.87454 (eq) 1.88704 (ax) | 120.0 (eq/eq) 90 (ax/eq) |
| SbCl3 | -1386.19576 | 3.2794 | 0.00007908 | C1 | 2.38315 | 97.580 |
| SbCl5 | -2306.62866 | 0.0000 | 0.00002802 | D3h | 2.35066 (eq) 2.38702 (ax) | 120.0 (eq/eq) 90 (ax/eq) |
As one can see from the table above one can see that in both cases the SbX5 compound is favoured, for both X=F and X=Cl. However, it is important to point out that the point group in the table above is wrong. Despite manually breaking the symmetry the optimised SbX3 compound both have a point group of C1 which is wrong. Both compounds should have a point group of C3v and therefore, one can assume that the molecule was still not fully optimised and the optimisation was not fully successful, therefore one must treat the results the assumption that they are not fully accurate. More time needs to be spent assessing the input file and trying to find a better basis set perhaps or altering the coordinates of the atoms in the molecule to a greater extent (which requires experience). However, having said this, the RMs gradient is very very low (below 0.0001) which does suggest that the global minimum has been reached, therefore the data does contradict itself somewhat and it difficult to conclusively decipher its accuracy. Interestingly, only the SbX3 molecules have a substantial dipole moment, which is what one would expect, since the orientation of the electronegative X atoms are able to combine to create a bigger dipole, whereas in the SbX5 molecules the X atoms are far apart and their dipole moments will cancel each other out. As expected, the SbF3 molecule has a greater dipole moment than SbCl3, since F is extremely electronegative, more so than chlorine, therefore the accumulation of charge will be greater. Furthermore, it is also interesting to note that in both SbX5 molecules, the Sb-X equatorial bond length is longer than the Sb-X axial bond length and the X(eq)-Sb-X(eq) bond angle is larger (120°) than the X(eq)-Sb-X(ax) bond angle (90°).
NBO Analysis
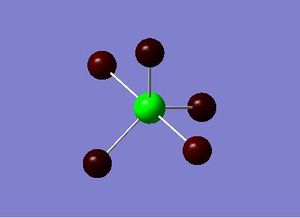
The NBO analysis above illustrates positive charge in green and negative charge in red. Obviously one would expect the halides to show negative charge due to their high electronegativity’s which is shown here. From the NBO analysis above one can see that the very high electronegativity of Fluorine induces a large electron deficiency on the Sb central atom, which is reflected by the large positive natural charge relative to the natural charge on the fluorine. The difference in electronegativity between fluorine and chlorine is also reflected here. Fluorine is the most electronegative element in the periodic table and electronegativity decreases down the group therefore chlorine is less electronegative than fluorine. This is reflected by a less substantial electron deficiency on the Sb central atoms where X=Cl. The natural charge of Sb on SbF5 is nearly double that of SbCl5.
Molecular Orbital Analysis
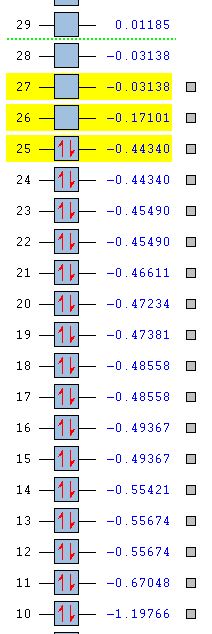
The molecular orbitals calculated mathematically are predicted by computational analysis. this is a quantitative way of determining the energeies and the appearance of MOs, and although it is not always accurate it is a useful way to get an idea of what one would expect. The MOs are found by using the optimised SbX3/SbX5 molecule and changing the job type to an energy calculation, where the method and basis set and PP remain the same but additional key words 'pop=full' are added and the NBO tab is selected for 'Full NBO'. This allows ones to conduct MO and NBO analysis on the molecules. the energies of the HOMO/LUMO and occupied MO's are shown below, where one can see that there is come degeneracy present.

| Molecular Orbital | Birds-Eye View of MO | Side View of MO |
|---|---|---|
| LUMO (2) |  |
 |
| LUMO (1) | 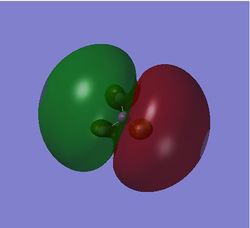 |
 |
| HOMO |  |
 |
| HOMO-1 |  |
 |
| HOMO-2 (1) |  |
 |
| HOMO-2 (2) |  |
 |
| HOMO-3 (1) |  |
 |
| HOMO-3 (2) |  |
 |
| MO1 |  |
 |
| MO2 |  |
 |
| MO4 |  |
 |
Normal 0 false false false EN-GB X-NONE X-NONE
The bonding of a molecule can be investigated quantitatively by looking at the molecular orbitals of a molecule. Also at first glance these orbitals appear far more complex than expected; one can get some idea of the interactions occurring by looking at it by eye.
HOMO MO – by looking at the electron density charge distribution over the MO one can decipher that the MO shows anti-bonding characteristics, however by looking at the quantitative data found by the DFT/B3LYP the energy of -0.34870 suggests otherwise. The appearance of the Mo generated is however not what one would expect. You would expect a sp3 hybridised lone pair, however it appears here that the non bonding pz orbital of Sb is largely displaced across the molecule.
The HOMO-1 MO appears to be antibonding/non-bonding since the electron density distribution across the F atoms seems to take the form of distinctive p orbitals, which are explicitly over each F atom, with no interaction between the charge located on each F atom. This is contradicted by the energy that is calculated by the modelling which indicates the Mo is bonding. This is very confusing since there is not overlap seen.
The HOMO-2 MO appears to illustrate degeneracy. The difference in energy between MO 13 and MO 14 is so unsubstantial that it can be assumed that degeneracy occurs here. For the F3 fragment one would expect to find degenerate fragment orbitals, as is the case of the H3 fragment, so is expected. One bonding interaction is represented here and therefore it is not surprising to find that the quantitative calculations have indicated that it is a bonding Mo, with an energy of -0.40917/-0.40920.
The HOMO-2 MO appears to also infer degeneracy. The difference again between the two MO is so little in energy that one assumes degeneracy occurs here. Despite the negative energy quantitatively calculated, there is no overlap between the Sb and F atoms which one would expect for a bonding MO.
MO1 and MO2 are the MOs that are calculated to have the lowers energy. In order to gain a better interpretation of the charge the isovalue needed to be substantially reduced. These MO interestingly, look very similar to the qualitative prediction one would make for the fragment orbitals of the H3 fragment. Therefore it is possible that these are the fragment orbitals associated with the F3 fragment of SbF3.
The LUMO here is indicated to be doubly degenerate, where again the energies calculated have no substantial difference. This may correspond to the interaction between the degenerate Sb pAOs (px and py) and the degenerate fragment orbitals from the F3 fragment, which both have e’ symmetry. The interaction shown by the LUMO MOs indicate that this is an antibonding/non-bonding interaction, although the energy suggests that the MO is only just deemed non-bonding/antibonding. Looking at the MO one can see some bonding interactions between the F and Sb orbitals. To further rationalise this one could use the reduction and projection formulae to determine the FO of the F3 fragment to determine the qualitative representations of this MO to compare and rationalise this outcome.
| Molecular Orbital | Birds-Eye View of MO | Side View of MO | |
|---|---|---|---|
| LUMO |  |
 |
|
| HOMO (1) |  |
 |
|
| HOMO (2) | 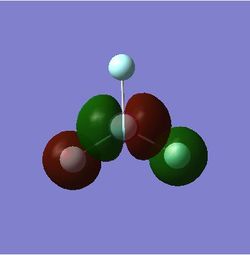 |
 | |
| HOMO-1 (1) | 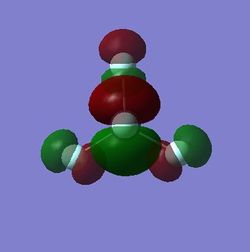 |
 |
|
| HOMO-1 (2) |  |
 |
|
| HOMO-2 |  |
 |
|
| HOMO-3 | 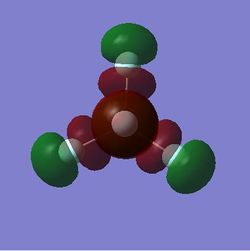 |
 |
|
| MO 6 |  |
 |
|
| Mo 1, MO 2 & MO 3 |  |
 |
 |
| MO 4 & MO 5 |  |
 |
Normal 0 false false false EN-GB X-NONE X-NONE
The molecular analysis for SbX5 is far more interesting and using the NBO analysis one can look at the dAO contributions from the central Sb atom. However, having said this the complexity of the molecule has increase, with more atoms there are more interactions and therefore its more difficult to rationalise.
The HOMO here shows double degeneracy with a no difference in energy between MO 24 and MO 25. Despite the energy indicating that these MOs are bonding it is very difficult any kind of overlap between the Sb and the F atoms, although the charge distribution in some areas is very close so one can assume that there is some interaction perhaps. Interestingly, the HOME-1 is also doubly degenerate with a very small energy difference between the MOs. According to the MO graphical orbitals there doesn’t seem to be any contribution from the low lying dAOs in Sb, however by looking at the NBO analysis output file segment below one can see there is some contribution. In MOs 1-5 the contribution from Sb fluctuates from 10% to 12% approximately and the contribution of d-character fluctuates from 13.7% 29.5% respectively, therefore indicating that the low lying dAOs of Sb does indeed contribute to the bonding/antibonding MOs.
11. (1.99422) LP ( 1) F   2           s( 86.09%)p 0.16( 13.91%)d 0.00(  0.00%)
                                            0.0000  0.9278 -0.0008  0.0000  0.0000
                                            0.0000  0.0000  0.3729 -0.0067  0.0037
                                            0.0000  0.0000  0.0000  0.0000  0.0000
                                            0.0000  0.0021  0.0009
    12. (1.97320) LP ( 2) F   2           s(  0.00%)p 1.00( 99.97%)d 0.00(  0.03%)
                                            0.0000  0.0000  0.0000  0.0000  0.0000
                                            0.0000  0.0000  0.0000  0.0000  0.0000
                                            0.9999 -0.0026 -0.0003  0.0000  0.0000
                                           -0.0162  0.0000  0.0000
    13. (1.95100) LP ( 3) F   2           s(  0.00%)p 1.00( 99.97%)d 0.00(  0.03%)
                                            0.0000  0.0000  0.0000  0.0000  0.9999
                                            0.0008  0.0000  0.0000  0.0000  0.0000
                                            0.0000  0.0000  0.0000 -0.0170  0.0000
                                            0.0000  0.0000  0.0000
    14. (1.99422) LP ( 1) F   3           s( 86.09%)p 0.16( 13.91%)d 0.00(  0.00%)
                                            0.0000  0.9278 -0.0008  0.0000  0.3229
                                           -0.0058  0.0032 -0.1865  0.0034 -0.0018
                                            0.0000  0.0000  0.0000  0.0018  0.0000
                                            0.0000 -0.0010  0.0009
    15. (1.97320) LP ( 2) F   3           s(  0.00%)p 1.00( 99.97%)d 0.00(  0.03%)
                                            0.0000  0.0000  0.0000  0.0000  0.0000
                                            0.0000  0.0000  0.0000  0.0000  0.0000
                                            0.9999 -0.0026 -0.0003  0.0000 -0.0140
                                            0.0081  0.0000  0.0000
    16. (1.95100) LP ( 3) F   3           s(  0.00%)p 1.00( 99.97%)d 0.00(  0.03%)
                                            0.0000  0.0000  0.0000  0.0000  0.4999
                                            0.0004  0.0000  0.8659  0.0007  0.0000
                                            0.0000  0.0000  0.0000 -0.0085  0.0000
                                            0.0000 -0.0147  0.0000
    17. (1.99422) LP ( 1) F   4           s( 86.09%)p 0.16( 13.91%)d 0.00(  0.00%)
                                            0.0000  0.9278 -0.0008  0.0000 -0.3229
                                            0.0058 -0.0032 -0.1865  0.0034 -0.0018
                                            0.0000  0.0000  0.0000 -0.0018  0.0000
                                            0.0000 -0.0010  0.0009
    18. (1.97320) LP ( 2) F   4           s(  0.00%)p 1.00( 99.97%)d 0.00(  0.03%)
                                            0.0000  0.0000  0.0000  0.0000  0.0000
                                            0.0000  0.0000  0.0000  0.0000  0.0000
                                            0.9999 -0.0026 -0.0003  0.0000  0.0140
                                            0.0081  0.0000  0.0000
    19. (1.95100) LP ( 3) F   4           s(  0.00%)p 1.00( 99.97%)d 0.00(  0.03%)
                                            0.0000  0.0000  0.0000  0.0000 -0.4999
                                           -0.0004  0.0000  0.8659  0.0007  0.0000
                                            0.0000  0.0000  0.0000  0.0085  0.0000
                                            0.0000 -0.0147  0.0000
    20. (1.99259) LP ( 1) F   5           s( 86.41%)p 0.16( 13.59%)d 0.00(  0.00%)
                                            0.0000  0.9296 -0.0007  0.0000  0.0000
                                            0.0000  0.0000  0.0000  0.0000  0.0000
                                            0.3685 -0.0064  0.0038  0.0000  0.0000
                                            0.0000  0.0000 -0.0022
    21. (1.96510) LP ( 2) F   5           s(  0.00%)p 1.00( 99.97%)d 0.00(  0.03%)
                                            0.0000  0.0000  0.0000  0.0000  0.9999
                                           -0.0008 -0.0001  0.0000  0.0000  0.0000
                                            0.0000  0.0000  0.0000  0.0000 -0.0161
                                            0.0000  0.0000  0.0000
    22. (1.96510) LP ( 3) F   5           s(  0.00%)p 1.00( 99.97%)d 0.00(  0.03%)
                                            0.0000  0.0000  0.0000  0.0000  0.0000
                                            0.0000  0.0000  0.9999 -0.0008 -0.0001
                                            0.0000  0.0000  0.0000  0.0000  0.0000
                                           -0.0161  0.0000  0.0000
    23. (1.99259) LP ( 1) F   6           s( 86.41%)p 0.16( 13.59%)d 0.00(  0.00%)
                                            0.0000  0.9296 -0.0007  0.0000  0.0000
                                            0.0000  0.0000  0.0000  0.0000  0.0000
                                           -0.3685  0.0064 -0.0038  0.0000  0.0000
                                            0.0000  0.0000 -0.0022
    24. (1.96510) LP ( 2) F   6           s(  0.00%)p 1.00( 99.97%)d 0.00(  0.03%)
                                            0.0000  0.0000  0.0000  0.0000  0.9999
                                           -0.0008 -0.0001  0.0000  0.0000  0.0000
                                            0.0000  0.0000  0.0000  0.0000  0.0161
                                            0.0000  0.0000  0.0000
    25. (1.96510) LP ( 3) F   6           s(  0.00%)p 1.00( 99.97%)d 0.00(  0.03%)
                                            0.0000  0.0000  0.0000  0.0000  0.0000
                                            0.0000  0.0000  0.9999 -0.0008 -0.0001
                                            0.0000  0.0000  0.0000  0.0000  0.0000
                                            0.0161  0.0000  0.0000
1. (1.92916) BD ( 1)Sb   1 - F   2
                ( 12.77%)   0.3574*Sb   1 s( 19.68%)p 3.39( 66.63%)d 0.70( 13.70%)
                                           -0.4435 -0.0075  0.0000  0.0000  0.0000
                                           -0.8137  0.0640  0.0023  0.0000  0.0000
                                            0.0000  0.0000  0.0000  0.0000  0.0198
                                            0.3696
                ( 87.23%)   0.9340* F   2 s( 13.90%)p 6.19( 86.03%)d 0.00(  0.07%)
                                            0.0000 -0.3728  0.0012  0.0001  0.0000
                                            0.0000  0.0000  0.9275  0.0048 -0.0009
                                            0.0000  0.0000  0.0000  0.0000  0.0000
                                            0.0000  0.0221  0.0131
     2. (1.92916) BD ( 1)Sb   1 - F   3
                ( 12.77%)   0.3574*Sb   1 s( 19.68%)p 3.39( 66.63%)d 0.70( 13.70%)
                                           -0.4435 -0.0075 -0.7047  0.0554  0.0020
                                            0.4069 -0.0320 -0.0012  0.0000  0.0000
                                            0.0000  0.0172  0.0000  0.0000 -0.0099
                                            0.3696
                ( 87.23%)   0.9340* F   3 s( 13.90%)p 6.19( 86.03%)d 0.00(  0.07%)
                                            0.0000 -0.3728  0.0012  0.0001  0.8033
                                            0.0042 -0.0008 -0.4638 -0.0024  0.0004
                                            0.0000  0.0000  0.0000  0.0192  0.0000
                                            0.0000 -0.0111  0.0131
     3. (1.92916) BD ( 1)Sb   1 - F   4
                ( 12.77%)   0.3574*Sb   1 s( 19.68%)p 3.39( 66.63%)d 0.70( 13.70%)
                                            0.4435  0.0075 -0.7047  0.0554  0.0020
                                           -0.4069  0.0320  0.0012  0.0000  0.0000
                                            0.0000  0.0172  0.0000  0.0000  0.0099
                                           -0.3696
                ( 87.23%)   0.9340* F   4 s( 13.90%)p 6.19( 86.03%)d 0.00(  0.07%)
                                            0.0000  0.3728 -0.0012 -0.0001  0.8033
                                            0.0042 -0.0008  0.4638  0.0024 -0.0004
                                            0.0000  0.0000  0.0000  0.0192  0.0000
                                            0.0000  0.0111 -0.0131
     4. (1.89567) BD ( 1)Sb   1 - F   5
                ( 10.67%)   0.3266*Sb   1 s( 20.50%)p 2.44( 50.00%)d 1.44( 29.50%)
                                           -0.4527  0.0099  0.0000  0.0000  0.0000
                                            0.0000  0.0000  0.0000 -0.7046  0.0600
                                            0.0006  0.0000  0.0000  0.0000  0.0000
                                           -0.5431
                ( 89.33%)   0.9452* F   5 s( 13.57%)p 6.36( 86.36%)d 0.00(  0.07%)
                                            0.0000 -0.3684  0.0015  0.0000  0.0000
                                            0.0000  0.0000  0.0000  0.0000  0.0000
                                            0.9293  0.0039 -0.0010  0.0000  0.0000
                                            0.0000  0.0000 -0.0257
     5. (1.89567) BD ( 1)Sb   1 - F   6
                ( 10.67%)   0.3266*Sb   1 s( 20.50%)p 2.44( 50.00%)d 1.44( 29.50%)
                                            0.4527 -0.0099  0.0000  0.0000  0.0000
                                            0.0000  0.0000  0.0000 -0.7046  0.0600
                                            0.0006  0.0000  0.0000  0.0000  0.0000
                                            0.5431
                ( 89.33%)   0.9452* F   6 s( 13.57%)p 6.36( 86.36%)d 0.00(  0.07%)
                                            0.0000  0.3684 -0.0015  0.0000  0.0000
                                            0.0000  0.0000  0.0000  0.0000  0.0000
                                            0.9293  0.0039 -0.0010  0.0000  0.0000
                                            0.0000  0.0000  0.0257
Vibrational Analysis of SbF3
The symmetrical nature of the SbX5 molecule, which belongs to the D3h point group, made vibrational analysis useless since their vibrational modes are spin inactive. Therefore, it was deemed most interesting to look at the vibrational spectra of SbF3 (since SbCl3 would be very similar and its more complex, bigger and heavier, so would take longer to calculate). To do this, the optimised file was taken and the input file was set up to calculate the frequency, using a frequency job type and using the DFT/ B3LYP basis set. Since SbX3 is in the C3v point group all of its vibrational modes should be observable in IR spectra.
| Vibrational Mode | Symmetry | Frequency (cm-1) | Intensity |
|---|---|---|---|
| 1 | E' | 187.61 | 6.37891 |
| 2 | E' | 187.76 | 6.3792 |
| 3 | A1' | 238.68 | 29.6391 |
| 4 | E' | 601.43 | 81.2879 |
| 5 | E' | 601.46 | 81.2824 |
| 6 | A1' | 619.05 | 47.5795 |
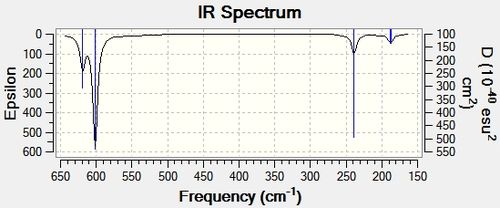
The symmetrical nature of the SbX5 molecule, which belongs to the D3h point group, made vibrational analysis useless since their vibrational modes are spin inactive. Therefore, it was deemed most interesting to look at the vibrational spectra of SbF3 (since SbCl3 would be very similar and its more complex, bigger and heavier, so would take longer to calculate). To do this, the optimised file was taken and the input file was set up to calculate the frequency, using a frequency job type and using the DFT/ B3LYP basis set. Since SbX3 is in the C3v point group all of its vibrational modes should be observable in IR spectra.
The vibrational analysis yielded six vibrational modes. Which are shown above. However, only four vibrational modes will be observed in the IR since there are two sets of degenerate vibrational modes, which would be seen as two single peaks.
References
- ↑ Bh3 opt: http://hdl.handle.net/10042/to-10964
- ↑ Normal 0 false false false EN-GB X-NONE X-NONE Bh3 Freq: http://hdl.handle.net/10042/to-10965
- ↑ Bh3 MO: http://hdl.handle.net/10042/to-10963
- ↑ bh3 MO:http://hdl.handle.net/10042/to-10963
- ↑ TlBr3 Opt: Normal 0 false false false EN-GB X-NONE X-NONE http://hdl.handle.net/10042/to-10966
- ↑ TlBr3 Freq: http://hdl.handle.net/10042/to-10967
- ↑ cis-Mo Complex Loose Opt: Normal 0 false false false EN-GB X-NONE X-NONE http://hdl.handle.net/10042/to-10953
- ↑ trans-Mo Complex Loose Opt: Normal 0 false false false EN-GB X-NONE X-NONE http://hdl.handle.net/10042/to-10952
- ↑ Cis-Mo Complex LanL2DZ Opt:http://hdl.handle.net/10042/to-10954
- ↑ Trans-Mo Complex LanL2DZ Opt:http://hdl.handle.net/10042/to-10955
- ↑ cis-Mo Complex adding dAO:http://hdl.handle.net/10042/to-10958
- ↑ trans-Mo complex adding dAO:http://hdl.handle.net/10042/to-10957
- ↑ cis-Mo complex Opt+freq taking dihedral angle into account:http://hdl.handle.net/10042/to-10961
- ↑ trans-Mo complex Opt taking dihedral angle into account: Normal 0 false false false EN-GB X-NONE X-NONE http://hdl.handle.net/10042/to-10962
- ↑ trans-Mo Complex Freq: Normal 0 false false false EN-GB X-NONE X-NONE http://hdl.handle.net/10042/to-10960
- ↑ Normal 0 false false false EN-GB X-NONE X-NONE Optf SbF3 http://hdl.handle.net/10042/to-10946
- ↑ Normal 0 false false false EN-GB X-NONE X-NONE Opt sbf5 http://hdl.handle.net/10042/to-10947
- ↑ Normal 0 false false false EN-GB X-NONE X-NONE Freq sbf5 http://hdl.handle.net/10042/to-10949
- ↑ Normal 0 false false false EN-GB X-NONE X-NONE Optf SbCl3 http://hdl.handle.net/10042/to-10940
- ↑ Normal 0 false false false EN-GB X-NONE X-NONE Optf SbCl5 http://hdl.handle.net/10042/to-10943
- ↑ Normal 0 false false false EN-GB X-NONE X-NONE SbF3 NBO/MO http://hdl.handle.net/10042/to-10945
- ↑ Normal 0 false false false EN-GB X-NONE X-NONE SbF5 NBO/MO http://hdl.handle.net/10042/to-10951
- ↑ Normal 0 false false false EN-GB X-NONE X-NONE SbCl3 NBO/MO http://hdl.handle.net/10042/to-10938
- ↑ Normal 0 false false false EN-GB X-NONE X-NONE SbCl5 NBO/MO http://hdl.handle.net/10042/to-10944


