Rep:Mod:kga08module2wiki
Quantum Mechanical Computational Studies by Keith Andrews
In this report, quantum mechanical computational models are used to optimise a range of structures, compare the energies of isomers and conformers, and obtain molecular orbitals. The methodology of computational chemistry and to what extent it is useful is considered and any limitations explored.
The calculations are all run in a program called Gaussian, using Gaussview to edit and visualise the input and output structures and data. The programs/procedure works as follows:
- A structure is drawn in Gaussview. Here connectivity, symmetry and geometric features can be defined.
- The coordinates are saved in a Gaussian input file.
- Keywords are added after a hash sign (#) to tell Gaussian what to calculate, such as the calculation type (frequency, energy, optimisation etc...), method (form of calculation), basis set (the form and accuracy of the atomic orbitals considered) and other keywords relating to how the calculations should be solved (loose convergence etc)
- The input file is submitted to Gaussian and Gaussian interprets the atoms and the coordinates given.
- By solving for the position of the nuclei, the optimum structure is found. At each nuclear configuration, the energy is calculated by solving the Schrödinger equation for the electron density. This is where the basis sets used is important. Better basis sets give more accurate energy differences.
- The nuclei are repeatedly moved until a minimum energy point is found. This is initially done by solving the derivative of the energy, and looking for a stationary point - when the first derivative of the energy with respect to nuclear position is zero. This is why a better starting geometry means a faster calculation (less iterations).
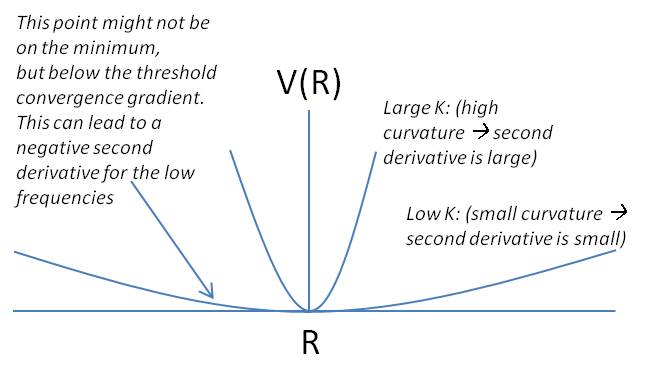
- A frequency analysis is performed, solving the second derivative of the energy with respect to nuclear position. This must be positive to be at a minimum. This derivative is also equal to the force constant, K, so the vibrational energy can be solved for using the reduced mass of the molecule (obtain IR spectra). Ensuring the minima has no negative vibrations means a minimum has been found.
- Energy calculations allow a population analysis to be performed, solving the charge distribution and molecular orbitals.
In general, computational chemistry is very useful, as high throughput calculations allow a large range of different structures to be screened on a basic level for differing criteria, useful in the pharmaceutical and catalyst industries. Here it will be used on specific molecules to compare to the experimental data.
Computational Analysis of the MO/s of BH3
Outline
Gaussian quantum mechanical calculations were used to predict the geometry, IR frequencies and molecular orbitals of the molecule BH3. As shown right (Jmol image), the bond angles were found to be 120o, and the bond lengths 0.119 nm; a recent paper[1] also quotes 0.119 nm and the trigonal planar molecule is expected to have 120o angles.
|
Experimental
A molecule of trigonal planar BH3 was built in Gaussview 3.0 and the bond lengths set to 1.5 Å. This molecule was optimised using Gaussian and a basic STO 3-21g basis set. This translates as a Slater Type Orbital, in which the core orbitals are each defined by 3 Gaussian functions (combined to approximate a Slater Type Orbital), and the valence orbitals are defined by 2 and 1 Gaussian functions respectively in a Pople split-valence type format. This is a relatively low level basis set.
The method used was (Density Functional Theory - DFT) B3LYP and the key word used was opt (optimisation only). The DFT method has a good accuracy/computational costs ratio.
The summary file produced in Gaussview was viewed.
BH3_opt_G3_kga08
File Name = BH3_OPT_G3_KGA08
File Type = .log
Calculation Type = FOPT
Calculation Method = RB3LYP
Basis Set = 3-21G
Charge = 0
Spin = Singlet
E(RB+HF-LYP) = -26.46226438 a.u.
RMS Gradient Norm = 0.00000285 a.u.
Imaginary Freq =
Dipole Moment = 0.0000 Debye
Point Group = D3H
Job cpu time:  0 days  0 hours  0 minutes 14.0 seconds.
This not only summarises the aforementioned information, (basis set, method etc) but also allows a check to make sure sensible data are output. The gradient is very close to zero (less than 0.001) which is a good indication of a stationary point (The optimisation finds a minimum in the first derivative of the energy). The molecule is correctly assigned in the D3H point group and the dipole moment is zero.
In order to check the optimisation was successful, the out file was also checked for converged parameters:
Item               Value     Threshold  Converged?
 Maximum Force            0.000428     0.000450     YES
 RMS     Force            0.000280     0.000300     YES
 Maximum Displacement     0.001685     0.001800     YES
 RMS     Displacement     0.001103     0.001200     YES
 Predicted change in Energy=-1.160348D-06
 Optimization completed.
    -- Stationary point found.
                           ----------------------------
                           !   Optimized Parameters   !
                           ! (Angstroms and Degrees)  !
 --------------------------                            --------------------------
 ! Name  Definition              Value          Derivative Info.                !
 --------------------------------------------------------------------------------
 ! R1    R(1,2)                  1.1925         -DE/DX =    0.0004              !
 ! R2    R(1,3)                  1.1925         -DE/DX =    0.0004              !
 ! R3    R(1,4)                  1.1925         -DE/DX =    0.0004              !
 ! A1    A(2,1,3)              120.0            -DE/DX =    0.0                 !
 ! A2    A(2,1,4)              120.0            -DE/DX =    0.0                 !
 ! A3    A(3,1,4)              120.0            -DE/DX =    0.0                 !
 ! D1    D(2,1,4,3)            180.0            -DE/DX =    0.0                 !
 --------------------------------------------------------------------------------
 GradGradGradGradGradGradGradGradGradGradGradGradGradGradGradGradGradGrad
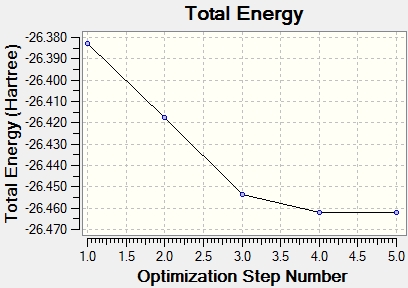
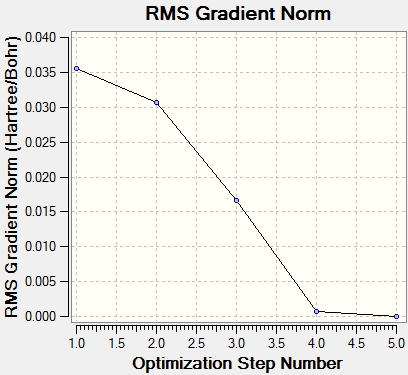
All parameters had converged satisfactorily. That is, the forces are converged: Failed to parse (syntax error): {\displaystyle F = -δV/δr} and the atom coordinates are optimised so that a small displacement does not result in a noticeable energy change. Because Gaussview is only a graphical interface, sometimes information must be directly interpreted from the output files. The graphs to the right show the optimisation steps (5) and the almost zero gradient at the last configuration.
To check the stationary point was a minimum and not a maximum(/inflection point), a frequency analysis was run, in the same basis set/method etc, but with the Freq keyword rather than Opt.
BH3_freq_G3_kga08
File Name = BH3_FREQ_G3_KGA08
File Type = .log
Calculation Type = FREQ
Calculation Method = RB3LYP
Basis Set = 3-21G
Charge = 0
Spin = Singlet
E(RB+HF-LYP) = -26.46226438 a.u.
RMS Gradient Norm = 0.00000294 a.u.
Imaginary Freq = 0
Dipole Moment = 0.0000 Debye
Point Group = C3H
Job cpu time:  0 days  0 hours  0 minutes  7.0 seconds.
The energy is identical to the optimisation run. This is important, as it means the geometry has not changed.
Low frequencies ---   -0.6560   -0.0171   -0.0021   20.1987   21.4875   21.4975
 Low frequencies --- 1145.7148 1204.6589 1204.6599
 Diagonal vibrational polarizability:
        0.6041804       0.6041102       1.9004460
 Harmonic frequencies (cm**-1), IR intensities (KM/Mole), Raman scattering
 activities (A**4/AMU), depolarization ratios for plane and unpolarized
 incident light, reduced masses (AMU), force constants (mDyne/A),
 and normal coordinates:
                     1                      2                      3
                    A"                     E'                     E'
 Frequencies --  1145.7148              1204.6589              1204.6599
 Red. masses --     1.2531                 1.1085                 1.1085
 Frc consts  --     0.9691                 0.9478                 0.9478
 IR Inten    --    92.6991                12.3789                12.3814
 Atom AN      X      Y      Z        X      Y      Z        X      Y      Z
   1   5     0.00   0.00   0.16     0.00   0.10   0.00    -0.10   0.00   0.00
   2   1     0.00   0.00  -0.57     0.00   0.08   0.00     0.81   0.00   0.00
   3   1     0.00   0.00  -0.57    -0.38  -0.59   0.00     0.14   0.38   0.00
   4   1     0.00   0.00  -0.57     0.38  -0.59   0.00     0.14  -0.38   0.00
These output files must be checked to ensure there are no negative frequencies (within 10 cm-1). The lowest here is -0.6560 so this was acceptable accuracy. The highest of the 6 (rotational and translational) energies is a good order of magnitude below the first real vibration, which is expected. The IR frequencies were visualised in Gaussview and are summarised in the table below. Because the data is sensible and optimised as discerned by the frequency analysis, data analysis can now begin.
Analysis of Data
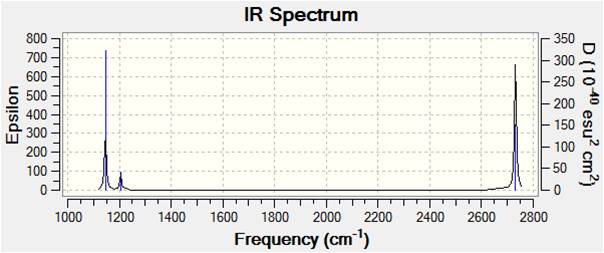
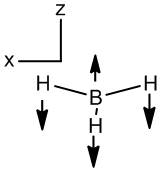
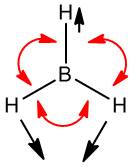
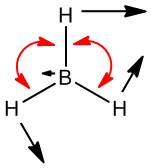
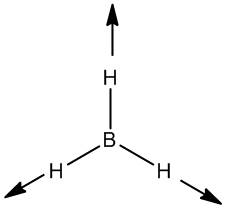
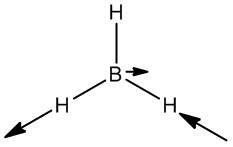
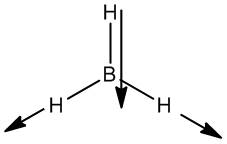
To compliment this data, the IR spectrum is also shown. Note that, although the table has 6 entries, only three peaks appear in the IR spectrum. One is easily attributable to the zero intensity symmetric stretch, which is IR inactive as it does not involve a change in dipole moment. Two more of the remaining sets have degeneracy and hence serve only to intensify the other of the pair; only one peak is seen for each degenerate set.
The symmetry labels have been assigned.
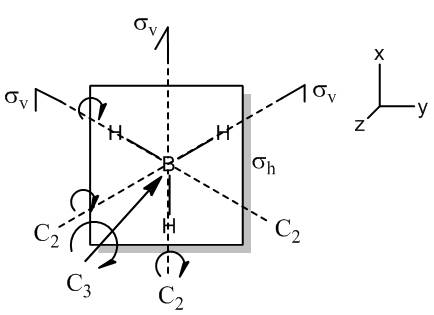
- Determine the Reducible Representation of BH3
| D3H | E | 2Cv | 3C2 | σH | 2S3 | 3σv |
| unmoved atoms | 4 | 1 | 2 | 4 | 1 | 2 |
| χ(per atom) | 3 | 0 | -1 | 1 | -2 | 1 |
| Γ(BH3) | 12 | 0 | -2 | 4 | -2 | 2 |
- Apply the Reduction Formula (h =12)
| D3H | E | 2Cv | 3C2 | σH | 2S3 | 3σv | Total | (1/12) x total
|
| Γ(BH3) | 12 | 0 | -2 | 4 | -2 | 2 | ||
| h | 1 | 2 | 3 | 1 | 2 | 3 | ||
| nA1' (=Γ.h.A1') | 12 | 0 | -6 | 4 | -4 | 6 | 12 | 1 |
| nA2' | 12 | 0 | 6 | 4 | -4 | -6 | 12 | 1 |
| nE' | 24 | 0 | 0 | 8 | 4 | 0 | 36 | 3 |
| nA1" | 12 | 0 | -6 | -4 | 4 | -6 | 0 | 0 |
| nA2" | 12 | 0 | 6 | -4 | 4 | 6 | 24 | 2 |
| nE" | 24 | 0 | 0 | -8 | -4 | 0 | 12 | 1 |
- This gives:
Γ (BH3) = A1' + A2' + 3E' + 2A2" + E"
- Subtract rotational and translational components
A1' + A2' + 3E' + 2A2" + E" - A2' - E' - A2" - E" gives A1' + 2E' + A2" as the vibrational modes
- Determine Stretches - Guess a symmetric stretch as A1'
| D3H | E | 2Cv | 3C2 | σH | 2S3 | 3σv |
| Γ(sB-H) | 3 | 0 | 1 | 3 | 0 | 1 |
| A1' | 1 | 1 | 1 | 1 | 1 | 1 |
| Difference | 2 | -1 | 0 | 2 | -1 | 0 |
The difference is equal to E'
- Therefore, the symmetric stretch is A1' and the degenerate asymmetric stretches are E'.
- Determine Breathing Modes
The breathing modes have the same reducible representation as the stretches, so they have the same modes. A1' is unphysical, as all angles cannot close at once. So the degenerate E' mode must be the breathing mode.
The symmetry is now assigned for 5 of the 6 modes. The remaining umbrella mode must be the A2".
NBO Analysis
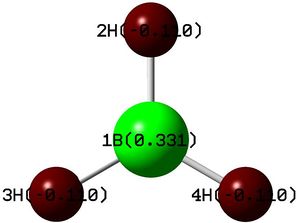
The NBO analysis is very useful. The image on the right shows the charge distribution, with the more electropositive boron green, ie more positively charged, as expected. The log file has this data represented as:
Summary of Natural Population Analysis:

                                       Natural Population
                Natural  -----------------------------------------------
    Atom  No    Charge         Core      Valence    Rydberg      Total
 -----------------------------------------------------------------------
      B    1    0.33127      1.99904     2.66969    0.00000     4.66873
      H    2   -0.11042      0.00000     1.11010    0.00032     1.11042
      H    3   -0.11042      0.00000     1.11010    0.00032     1.11042
      H    4   -0.11042      0.00000     1.11010    0.00032     1.11042
 =======================================================================
   * Total *    0.00000      1.99904     6.00000    0.00097     8.00000
The next data set gives information of the orbital contributions of each molecular orbital. There are three sp2 orbitals (1, 2, 3) each mixed with the 1s orbitals on hydrogen, a core 1s orbital on boron (4) and a lone pair, which is "erroneously" labelled as 100%s instead of 100%p, (erroneous based on what chemists generally expect here). The trigonal planar boron molecule is classically taught to be sp2 hybridised. This would require the 3 sp2 orbitals seen as B-H bonds, leaving an unadulterated p orbital orthogonal to the plane as an "empty lone pair". Computational chemistry is allowing another approach to viewing what might actually be occurring in molecules, even if the chemists' classical viewpoint is sufficient for predictive purposes. In this case, the low level basis set may be causing the observed result and a higher level calculation may contradict the result.
The output also shows that (in MO 1), 55.51% of the electron density is donated by the hydrogen.
 (Occupancy)   Bond orbital/ Coefficients/ Hybrids
 ---------------------------------------------------------------------------------
     1. (1.99851) BD ( 1) B   1 - H   2
                ( 44.49%)   0.6670* B   1 s( 33.33%)p 2.00( 66.67%)
                                            0.0000  0.5774  0.0000  0.0000  0.0000
                                            0.8165  0.0000  0.0000  0.0000
                ( 55.51%)   0.7451* H   2 s(100.00%)
                                            1.0000  0.0000
     2. (1.99851) BD ( 1) B   1 - H   3
                ( 44.49%)   0.6670* B   1 s( 33.33%)p 2.00( 66.67%)
                                            0.0000  0.5774  0.0000 -0.7071  0.0000
                                           -0.4082  0.0000  0.0000  0.0000
                ( 55.51%)   0.7451* H   3 s(100.00%)
                                            1.0000  0.0000
     3. (1.99851) BD ( 1) B   1 - H   4
                ( 44.49%)   0.6670* B   1 s( 33.33%)p 2.00( 66.67%)
                                            0.0000  0.5774  0.0000  0.7071  0.0000
                                           -0.4082  0.0000  0.0000  0.0000
                ( 55.51%)   0.7451* H   4 s(100.00%)
                                            1.0000  0.0000
     4. (1.99904) CR ( 1) B   1           s(100.00%)
                                            1.0000  0.0000  0.0000  0.0000  0.0000
                                            0.0000  0.0000  0.0000  0.0000
     5. (0.00000) LP*( 1) B   1           s(100.00%)
This shows what the natural bond orbital analysis is; it assigns electron density into the familiar basic hybridised orbitals and Gaussview interprets this information to draw in the (2c-2e) "bonds".
Molecular Orbital Analysis of BH3
The following keywords were used for an energy calculation:
# b3lyp/3-21g pop=(nbo,full) geom=connectivity
The published file is here: DOI:10042/to-7617
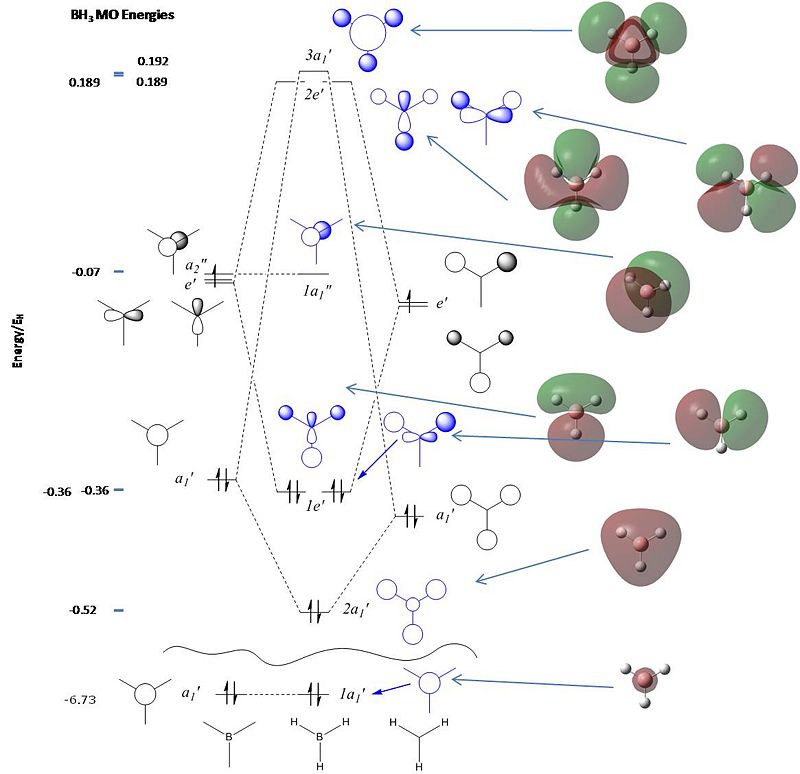
This shows the quantitative MO diagram, with the calculated energies of the final orbitals shown on the left (to scale, except the lowest orbital). The B1s orbital is at a much lower energy than the frontier orbitals as it is drawn into the nucleus by the increased nuclear charge (c.f. H1s). When working the molecular orbital diagram out by hand using basic MO diagram guidelines, the graph is almost entirely reproducible and predicts very well the relative energies of the MO/s, qualitatively. Up to the HOMO/LUMO, the symmetry derived molecular orbitals are in agreement (relative order-wise) and hence the basic properties (magnetism) and reactivity (frontier orbitals) are both predictable. However, when drawing the diagram, the relative energy spacings are not always well approximated. It is, for example, very hard to guess the displacement of the antibonding orbitals 3a1' and the 2e' - the calculations at this basis-set level give them almost exactly the same final energy, and without the knowledge of the "correct order" (as determined by computational calculations), it is plausible to draw them the other way around. This is, however, a fairly unimportant observation, as the energy levels concerned are not particularly useful on their own.
The calculated molecular orbitals are shown next to the LCAO (linear combination of atomic orbitals) representations, as drawn in the symmetry derived diagram. They represent an excellent correlation, being nearly identical, except for the obvious mixing that would occur (bonding orbitals must overlap!) that is not put across in the simple orbital combinations. Given the (relatively) simplistic method of combining the symmetry-matched atomic (and molecular) orbitals that allows the frontier orbitals of the molecule to be approximated well with minimal mathematics, this method provides an excellent alternative to the quantum mechanical calculation approach. As soon as the molecules become more complex, then the calculation approach will begin to take longer, but will yield much more accurate results, as with more complex diagrams, the degree of mixing becomes hard to determine, and guessing the correct energy levels is difficult. This notion will be explored further in the Mini Project.
Computational Analysis of Thallium Tribromide
Outline
TlBr3 is unstable and is known to release bromine at room temperature, and form (via disproportionation) Tl[TlBr4].[2] Here Gaussian quantum mechanical calculations were used to predict the geometry, IR frequencies and molecular orbitals of the molecule TlBr3. As shown in the Jmol (right), the bond angles were again 120o, and the bond lengths were 0.265 nm, a reasonable agreement with the literature (0.255 nm)[3]. The optimised LOG file (after frequency analysis) is here.
|
Experimental
A molecule of trigonal planar TlBr3 was built in Gaussview 3.0 and the geometry optimised using the method (B3LYP)/basis set(LANL2DZ)/ etc as shown in the output file summary below. This basis set is a pseudo-potential; there are a large number of electrons in thallium (81) and bromine (35) x 3 and the relativistic effects of these large atoms are not accounted for by the standard Schrödinger equation but can be covered by using a pseudo-potential. This means the core electrons, which are frequently assumed to be inactive in the frontier bonding orbitals, can be modelled together as an effective core potential, or ECP, for heavier atoms. This cuts down on computation time, without significant loss of accuracy, showing that this common chemical assumption is usually valid. Another way of cutting calculation time is to restrict the symmetry. TlBr3 was restricted to D3H symmetry (with high tolerance), as we expect this geometry - presumably this saves time in that the optimisation cannot change the Tl-Br bonds separately, and the angles must be 120o.
TlBr3_Optimisation_kga08
File Name = TlBr3_Optimisation_kga08
File Type = .log
Calculation Type = FOPT
Calculation Method = RB3LYP
Basis Set = LANL2DZ
Charge = 0
Spin = Singlet
E(RB3LYP) = -91.21812851 a.u.
RMS Gradient Norm = 0.00000090 a.u.
Imaginary Freq =
Dipole Moment = 0.0000 Debye
Point Group = D3H
Job cpu time:  0 days  0 hours  0 minutes 19.0 seconds.
The summary seemed OK (very low gradient), but the output file was checked for convergence too.
Item               Value     Threshold  Converged?
 Maximum Force            0.000002     0.000450     YES
 RMS     Force            0.000001     0.000300     YES
 Maximum Displacement     0.000022     0.001800     YES
 RMS     Displacement     0.000014     0.001200     YES
 Predicted change in Energy=-6.083939D-11
 Optimization completed.
    -- Stationary point found.
                           ----------------------------
                           !   Optimized Parameters   !
                           ! (Angstroms and Degrees)  !
 --------------------------                            --------------------------
 ! Name  Definition              Value          Derivative Info.                !
 --------------------------------------------------------------------------------
 ! R1    R(1,2)                  2.651          -DE/DX =    0.0                 !
 ! R2    R(1,3)                  2.651          -DE/DX =    0.0                 !
 ! R3    R(1,4)                  2.651          -DE/DX =    0.0                 !
 ! A1    A(2,1,3)              120.0            -DE/DX =    0.0                 !
 ! A2    A(2,1,4)              120.0            -DE/DX =    0.0                 !
 ! A3    A(3,1,4)              120.0            -DE/DX =    0.0                 !
 ! D1    D(2,1,4,3)            180.0            -DE/DX =    0.0                 !
 --------------------------------------------------------------------------------
 GradGradGradGradGradGradGradGradGradGradGradGradGradGradGradGradGradGrad
All parameters had converged satisfactorily and a stationary point was reached.
To check the stationary point was a minimum and not a maximum, a frequency analysis was run, in the same basis set/method etc, but with the Freq keyword rather than Opt.
BH3_freq_G3_kga08
File Name = BH3_FREQ_G3_KGA08
File Type = .log
Calculation Type = FREQ
Calculation Method = RB3LYP
Basis Set = 3-21G
Charge = 0
Spin = Singlet
E(RB+HF-LYP) = -26.46226438 a.u.
RMS Gradient Norm = 0.00000294 a.u.
Imaginary Freq = 0
Dipole Moment = 0.0000 Debye
Point Group = C3H
Job cpu time:  0 days  0 hours  0 minutes  7.0 seconds.
A frequency analysis was completed on the optimised output to check the geometry is a minimum stationary point. This is the second derivative of the energy (with respect to nuclear position). A positive second derivative (on both sides of the stationary point) means a minimum has been reached. The summary was examined to ensure the energy matched the energy of the optimisation (-91.21812851 a.u. and -91.21812851 a.u.) and then the output file checked for the frequency results. The method/basis set must be kept the same in order to compare the overall energy (which is different for different basis sets). Comparing the overall energy is how we can be sure the frequency analysis energy has retained the optimised geometry. The "low frequencies" are [-3.4213 -0.0026 -0.0004 0.0015 3.9367 3.9367 cm-1] and the lowest normal mode is 46.4213 cm-1. These are normally quoted to the nearest wavenumber, giving -3, 0, 0, 0, 4, 4 cm-1 and the lowest normal mode as 46 cm-1.
Low frequencies ---   -3.4213   -0.0026   -0.0004    0.0015    3.9367    3.9367
 Low frequencies ---   46.4289   46.4292   52.1449
 Harmonic frequencies (cm**-1), IR intensities (KM/Mole), Raman scattering
 activities (A**4/AMU), depolarization ratios for plane and unpolarized
 incident light, reduced masses (AMU), force constants (mDyne/A),
 and normal coordinates:
                     1                      2                      3
                    E'                     E'                     A2"
 Frequencies --    46.4289                46.4292                52.1449
 Red. masses --    88.4613                88.4613               117.7209
 Frc consts  --     0.1124                 0.1124                 0.1886
 IR Inten    --     3.6867                 3.6867                 5.8466
  Atom  AN      X      Y      Z        X      Y      Z        X      Y      Z
     1  81     0.00   0.28   0.00    -0.28   0.00   0.00     0.00   0.00   0.55
     2  35     0.00   0.26   0.00     0.74   0.00   0.00     0.00   0.00  -0.48
     3  35     0.43  -0.49   0.00    -0.01  -0.43   0.00     0.00   0.00  -0.48
     4  35    -0.43  -0.49   0.00    -0.01   0.43   0.00     0.00   0.00  -0.48
The lowest frequency of the (3N)-6 low frequencies was -3 cm-1, well inside the tolerance of 10 cm-1.
Analysis of Data
As the data check suggested the molecule was correctly optimised, data analysis was performed. This is a fair assumption for a simple molecule, but in more complex molecules, false minima may be obtained (which can pass the frequency test).
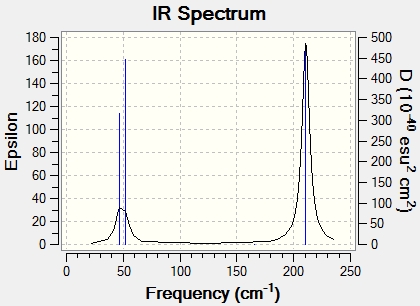
| Freq/cm-1 | Infrared Intensity | Vibration | Description | Symmetry Label |
|---|---|---|---|---|
| 46.4 | 3.7 | Scissor | E' | |
| 46.4 | 3.7 | Rock | E' | |
| 52.1 | 6 | Wag (umbrella motion) | A2" | |
| 165.3 | 0 | Symmetric Stretch | A1" | |
| 210.7 | 25.5 | Asymmetric Stretch | E' | |
| 210.7 | 25.5 | Asymmetric Stretch | E' |
To compliment this data, the IR spectrum is also shown. Note that, although the table has 6 entries, only two peaks appear in the IR spectrum. As well as the degeneracy experienced above in the BH3 molecule, two of the peaks overlap this time. It is noted here that the frequencies are much lower than those for BH3, and that, although the symmetry and hence vibrations are identical, the ordering is different.
Conclusion
Due to the high toxicity of many heavy metals, computational methods are preferred to give an idea about the properties of some of their compounds. Here, thallium bromide was optimised and the frequency analysis performed.
- TlBr3 was determined to have a bond length of 2.96 Å, in good agreement with the literature as quoted above. The angle was found to be 120.0o, which is expected for a group 3 trihalide.
- The 6 vibrational frequencies of TlBr3 were determined.
What is a Bond?
Whilst chemists draw thin straight lines representing covalent bonds, and "curly arrows" representing the movement of a pair of electrons, this is in no way adequate to fully describe the intricacies of chemical bonding or to predict reactivity when electrons are added or removed. Firstly, the bonds drawn account only for valance orbitals, which was agreed above to be a fair assumption of reactivity and bonding. The bonds drawn are therefore very useful for considering valencies and oxidation states in a VSEPR-type analysis. For the most part, the drawn lines are sufficient to get chemists from A to B, and therefore the tradition is well used. However, the actual nature of a bond is better described by quantum mechanical treatments. The electrons have orbitals (density probabilities) which, when mixed with the orbitals of a close enough atom (in distance) of the appropriate symmetry, with a close enough energy, create a volume in which the electrons are distributed in. This can be simply thought of as an (increased) localised electron density that, when located between two nuclei, provide a stabilising electrostatic attractive force, bringing the positively charged nuclear to some optimum distance (R). A stable configuration leads to persistent bonds, whilst a non-stable configuration, often a high energy orbital in which the orbitals have nodes with no continuous electron density, does not allow a bond. These bonds are stable due to the potential energy well they live in, which means it is unfavourable to pull the nuclei apart again (hence the restoring force of vibrations); electrons are always "trying" to lower their energy. In reality, there are many orbitals contributing to bonds of larger molecules (see Mini Project).
So Gaussview sometimes doesn't draw a bond where we would define one, as there are distance based criteria for it to define a "bond" with a line - if the atoms are too far apart, a bond may not be drawn.
Considering the cis- and trans- isomers of Mo(CO)4(PCl3)2
Outline
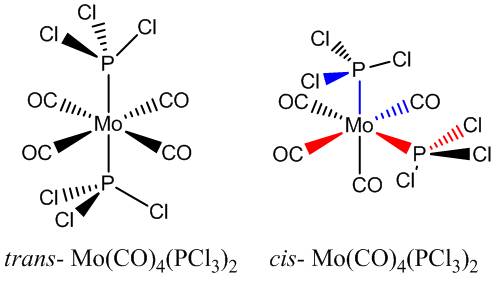
Computational calculations using the LANL2DZ pseudo-potential and the B3LYP method were used to predict the relative stabilities of the two isomers of Mo(CO)4(PCl3)2. The IR frequencies were also calculated and the number of CO stretches compared to the number expected based on symmetry arguments. The trans- effect is considered in explaining how altering the substituents on the phosphorus groups can change the relative stabilities of the two isomers.
The pseudo potential uses a medium level basis set (D95V) for carbon and oxygen, and an effective core potential (Los Alamos) for the non-first row elements, which saves time without too much compromise on accuracy. The DZ stands for double zeta, which is a superior basis set to those encountered so far.
Objectively, the calculations were run to test the experimental observation that the trans- isomer is more stable than the cis- isomer. However, the original molecules contain PPh3 ligands - PCl3 are substituted here, as they have been shown to be similar sterically and electronically, but require much less computational effort.
Experimental
The two isomers were drawn in GaussView 5.0, with an octahedral molybdenum centre, linear carbonyl ligands (CO triple bonds) and tetrahedral phosphorus groups. The molecule was neutral overall.
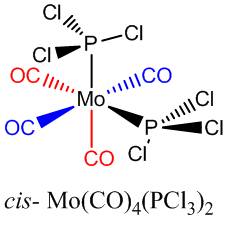
Each isomer was optimised loosely using the opt=loose keywords in the B3LYP method and LANL2MB basis set (a fast low-level basis set). The output structures were found to have no P-Cl bonds (according to Gaussian). These were redrawn so that the phosphorus ligands could be reorientated. The trans- ligand's PCl3 groups were reorientated to be eclipsed when looking down the P-Mo bonds. The cis isomer PCl3 groups were realigned so one P-Cl bond had a dihedral angle of 0o to a cis- C=O group and the other P-Cl bond had a 180o angle to a cis- C=O group (see coloured groups on the diagram, right). This was necessary to ensure the correct minima were obtained, and was based on prior knowledge of the correct geometries. In novel research, this process will have to be done for many possible geometries to obtain the lowest final geometry. For known structures, x-ray crystallography data might be a useful starting point for a fast convergence to the lowest energy structure.
After manually altering the geometry, the structures were re-optimised with the "int=ultrafine scf=conver=9" keywords. This increases the electronic convergence criteria. The basis set was also upgraded to LANL2DZ.
Trans_Mo(CO)4(PCl3)2_Opt_post_geom_change_kga08						Cis_Mo_opt_post_goem_change_kga08
File Name = log_39968_opt_post_geom_trans						File Name = log_39977_opt_post_geom_change_cis
File Type = .log						                        File Type = .log
Calculation Type = FOPT						                        Calculation Type = FOPT
Calculation Method = RB3LYP						                Calculation Method = RB3LYP
Basis Set = LANL2DZ						                        Basis Set = LANL2DZ
Charge = 0						                                Charge = 0
Spin = Singlet						                                Spin = Singlet
E(RB3LYP) = -623.57603111 a.u.						                E(RB3LYP) = -623.57707194 a.u.
RMS Gradient Norm = 0.00001747 a.u.						        RMS Gradient Norm = 0.00000680 a.u.
Imaginary Freq = 						                        Imaginary Freq =
Dipole Moment = 0.3047 Debye						                Dipole Moment = 1.3097 Debye
Point Group = C1						                        Point Group = C1
Job cpu time:  0 days  0 hours 41 minutes 41.3 seconds.					Job cpu time:  0 days  1 hours  2 minutes 22.0 seconds.
Finally, the optimised structures were optimised using the keyword extrabasis, which better models the hypervalent nature of phosphorous. The output files contain lines to this extent;
Warning!  P  atom    2 may be hypervalent but has no d functions.
Warning!  P  atom    3 may be hypervalent but has no d functions.
which is an indication that the optimisation might be inaccurate due to the simplified basis set used, so the extrabasis keyword and additional information added manually to the bottom of the input file (see below) means the calculation takes into account the d orbitals on phosphorous. The additional lines describe the width and decay rate of the d orbitals added to phosphorous.
P 0
D  1  1.0
0.55  0.100D+01
****
Because computers need precise commands, spaces/line break positions are important. The LOG files for the Frequency Analysis of the two isomers are here: cis- and trans-
Data Analysis
The frequency analysis output showed no negative frequencies so data analysis was started. The below table shows the summary output energies in Hartrees for each isomer and for both the LANL2DZ pseudo-potential basis set and extrabasis-inclusive (labelled hypervalent) calculations.
| LANL2DZ | Extrabasis | Energies Assuming Maximum Error (~10 kJ/mol errors) | |
| cis-PCl3 / EH | -623.577 | -623.693 | -623.697 |
| trans-PCl3 / EH | -623.576 | -623.694 | -623.690 |
| (trans - cis) / kJ/mol | 2.625 | -2.625 | 18.378 |
Whilst initially, it seems the cis- isomer is more stable, by 2.625 kJ/mol, upon using the extrabasis keyword, this result changes. The result is exactly the same (to three dp) but negative. This is because a preliminary restriction was set - the Hartree energies were rounded to 3 dp, which represents a crude estimate of the error in the output. However, the error is more likely to be nearer 10 kJ/mol (0.003809 Hartrees). When this value is added to the most negative energy, and subtracted from the most positive energy, the upper and lower limits of the error for the relevant isomers are found to have a difference of 18.378 kJ/mol. This represents the minimum difference required to be certain of the relative stabilities of the two isomers, so it is shown that the level of accuracy here is not sufficient to distinguish the two isomers.
The chlorine atoms here are used as a rough equivalent for phenyl groups, which dramatically increase the computation time (10 more atoms per phenyl!). The chlorine atoms are said to have similar electronic and sterical effects as the phenyl ligands. Literature[4] states that for the Mo(CO)4(PPh3)2 pair of isomers, the trans- isomer is more stable, with the cis- isomer isomerising to the trans- form at room temperature, which is in agreement with the hypervalent-inclusive calculations above.
The accuracy that is required, with the given figures, to be able to ensure a correct qualitative stability ordering is 0.00006 Hartrees, or 1.63 kJ/mol (half the difference of the two energies). Density functional calculations in the literature[5] give the cis- isomer to be more stable, with the trans- isomer 72.98 kJ/mol higher in energy. This is, however, for the phenyl analogue. This is the incorrect result based on the isomerism seen experimentally, indicating environmental effects (eg solvation) to be the cause of the observed trans- isomer's stability.
Looking at the optimised geometries, some key bond lengths are extracted and analysed (see diagram right for table definitions).
| / Å | trans- isomer | cis- Isomer | ||||
| Bond | Length | Lit[4] Length | trans- to P Length | Lit[6] | cis- to P Length | Lit |
|---|---|---|---|---|---|---|
| C-Mo | 2.06 | 2.01 | 2.06 | 1.97 | 2.01 | 2.06 |
| C=O | 1.17 | 1.17 | 1.18 | 1.13 | 1.17 | 1.16 |
| P-Cl | 2.24 | N/A | 2.24 | N/A | N/A | N/A |
| Mo-P | 2.44 | 2.50 | N/A | N/A | 2.51 | 2.58 |
The bond distances, accurate to about 0.01 Å are found to vary across the isomers. A key comparison is the Mo-P bond length. For the cis- isomer, the Mo-P bond length is 0.07 Å longer (2.51 - 2.44 Å) than for the trans- isomer, indicating a lengthening of the cis- isomer P-Mo bonds, probably to alleviate sterical repulsion of the chlorine atoms on the neighbouring ligands. This is a possible reason for destabilisation of the cis relative to the trans isomer.
Another observation is that the C=O bonds within the cis- isomer are longer for carbonyl groups trans- to phosphorous ligands compared to the carbonyls that are cis- to phosphorous ligands. This is a clear occurrence of the trans- effect, indicating that the electron density provided at the metal from the phosphorous lone pair is channelled into the opposite π*CO (back-bonding), lengthening and weakening the C=O bond, but drawing in the Mo-C bond. This Mo-C difference is smaller, with the Mo-C bonds only 0.01 Å shorter for the trans- (to phosphorous ligands) carbonyls. The P-Cl bonds do not change noticeably.
Referring again to the literature[4]; comparing the geometry may allow an evaluation of the use of chlorine over the phenyl groups. Literature states a P-Mo-P bond angle of 104.6o for the cis- isomer; whilst the calculated angle is slightly increased from the ideal 90o (to 94.3o), it is a long way from the experimental value. The reported average Mo-C bond length difference of 0.12 Å between isomers is not observed either (0.05 Å), indicating that whilst useful, the substituted chlorine atoms are in no way a good substitute (for phenyl) to obtain analytically correct geometries. Although they give a rough approximation, because the differences between the isomers are quite small, the data collected using the chlorine substitutes is less than conclusive, and real calculations would have to be run to properly analyse the effects seen. Referring back to the DFT calculations in the literature[5] that conclude the cis- isomer is more stable, it must be noted that sterical and electronical effects alone cannot be used as a chemical reason for substitution in computational chemistry, and the time saving nature of these calculations cannot necessarily be used, as here, the intramolecular interactions play a large part in determining the relative stabilities of the isomers.
Reversing the Stability of the Isomers
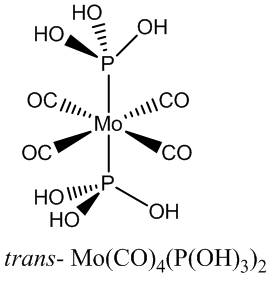
Assuming the above calculations were correct (including error), the favoured stability of the trans- isomer is therefore suggested to be due to sterics in the cis- isomer (although the DFT studies suggest intramolecular attractive forces). To reverse this stability ordering, it is supposed that the cis- isomer would need to have attractive interactions, and small groups. Hydroxyl groups are suggested, and although the P(OH)3 ligand (phosphorous acid) is not commonly encountered, it has been known to bind to molybdenum in Mo(CO)5(P(OH)3)[7] [8].
All the Cl groups were replaced with hydroxyls in a freshly drawn structure, and the optimisations performed as before. The hydroxyls were orientated initially to be perpendicular to the Mo-P bonds, and so the angles of the hydroxyl groups were edited to encourage possible favourable interactions to the other hydroxyls through space (hydrogen bonding - see Jmol for the cis- isomer). The hypervalent extrabasis was added after the LANL2DZ basis sets and the summary energies are quoted below .
| TRANS/ EH | CIS /EH | Energy Difference / EH | Energy Difference / kJ/mol |
| -989.048 | -989.050 | 0.002 | 5.251 |
Again, the difference is too small and the error is possibly too big to conclude anything. However, the result is more distinctive than the previous result, and the cis- isomer is indeed favoured.
Here are the outputs of the previous optimisations: DOI:10042/to-7552 (trans-) DOI:10042/to-7553 (cis-)
Trans (Freq Output)		                                                         Cis (Freq Output)
Low frequencies ---   -4.5455   -3.8309   -2.3014   -0.0004    0.0006    0.0008		 Low frequencies ---   -4.0334   -0.0006    0.0008    0.0008    2.2188    5.4915
 Low frequencies ---   13.8863   14.7162   47.0960		                         Low frequencies ---   15.4987   46.0069   55.5153
 Harmonic frequencies (cm**-1), IR intensities (KM/Mole), Raman scattering		 Harmonic frequencies (cm**-1), IR intensities (KM/Mole), Raman scattering
 activities (A**4/AMU), depolarization ratios for plane and unpolarized		         activities (A**4/AMU), depolarization ratios for plane and unpolarized
 incident light, reduced masses (AMU), force constants (mDyne/A),		         incident light, reduced masses (AMU), force constants (mDyne/A),
 and normal coordinates:		 and normal coordinates:
                     1                      2                      3		                     1                      2                      3
                     A                      A                      A		                     A                      A                      A
 Frequencies --    13.8151                14.7105                47.0952		 Frequencies --    15.1939                46.0056                55.5136
 Red. masses --     6.7479                 6.4055                10.0679		 Red. masses --     7.5500                10.1165                 8.4099
 Frc consts  --     0.0008                 0.0008                 0.0132		 Frc consts  --     0.0010                 0.0126                 0.0153
 IR Inten    --     0.4711                 0.5526                 1.0723		 IR Inten    --     0.0986                 1.1323                 4.5627
Because no real geometries were available to go on, no rotational analysis on the P(OH)3 was available to obtain the optimum geometry. It was supposed that a better interaction could be achieved by allowing two hydroxyl groups to partake in hydrogen bonding to the adjacent P(OH)3 group, as opposed to the one interaction in the above optimisation. The geometry for the cis- hydroxyl complex was altered to maximise this and the optimisations run again, at the same level as before so the energies could be compared.
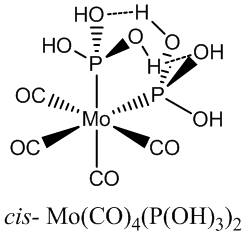
Cis_Mo(P(OH3)2)_hypervalent_opt_FREQ_2DZ_kga08_better_hydroxyls_v2
File Name = log_41282_Cis_Mo(P(OH3)2)_hypervalent_opt_FREQ_2DZ_kga08_better_hydroxyls_v2_2
File Type = .log
Calculation Type = FREQ
Calculation Method = RB3LYP
Basis Set = Gen
Charge = 0
Spin = Singlet
E(RB3LYP) = -989.06267965 a.u.
RMS Gradient Norm = 0.00001054 a.u.
Imaginary Freq = 0
Dipole Moment = 5.0673 Debye
Point Group = C1
Job cpu time:  0 days  0 hours 54 minutes 27.3 seconds.
Low frequencies ---   -4.6840   -3.3701   -0.0003    0.0002    0.0007    0.9804
Low frequencies ---   49.0216   52.4212   66.8402
The energy for the cis- isomer with the new hydroxyl group orientations is much lower (more stable), with two large hydrogen bonds. It is supposed there might also be favourable interactions between the hydroxyls on the same phosphorous. The energy difference is now 0.015 EH, which equates to 39 kJ/mol, plenty large enough to conclude the relative ordering of the stability of the isomers. The output file is DOI:10042/to-7674 , and the structure can be viewed here:
It has also been found, that substituting phenyl rings for pyridyl groups means intramolecular hydrogen bonds lead the cis- isomer to be favoured.[9].
Vibrational Analysis of the Molybdenum Isomers
The frequency analysis, of course, also allows the vibrations of the molecule to be computed. Although there were no significantly negative frequencies, there are many low frequency vibrations. These are animated here:
The lowest two vibrations of each set seem to have vectors orientated so that the PCl3 groups would be rotating if the vibration carried through - the P-Mo bond would be rotating. The energy of these vibrations is much less than the thermal energy at room temperature:
The vibrational frequency of the low frequency vibrations are less than 1/4 of the available energy at room temperature. Therefore, these vibrations will be occurring all the time - it is reasonable to suggest that the vibrations might lead to the rotation of the PCl3 groups around the Mo-P bonds, for both isomers. This would relax the symmetry - the P groups would then act as spherical ligands.
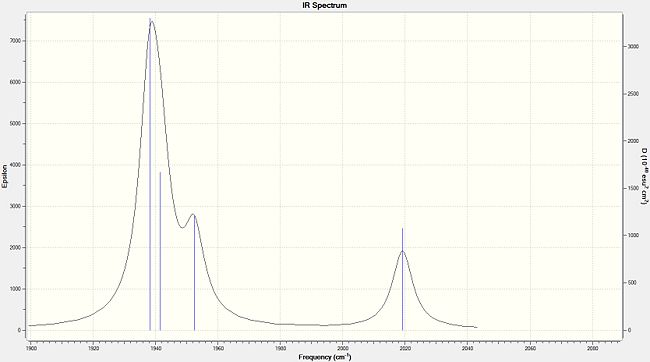
The carbonyl vibrations are of greater interest, as they allow identification of the two isomers. Due to the differing symmetry, there a different number of C=O stretches (IR active) - the more symmetric trans- isomer has no active IR mode for the symmetric stretch, as there is no change in dipole moment. The two high frequencies for the trans isomer would have, in an ideal symmetry, zero intensity. Here, 5 and 6 (intensity) are observed as the PCl3 groups distort the perfect symmetry a little. A non-ideal optimisation could also effect this lack of symmetry (Gaussian often incorrectly assigns C1 symmetry due to a non-ideal structure). The two asymmetric stretches are of Eu symmetry and hence degenerate, so the trans- isomer is predicted one peak. The cis- isomer has four active stretches, assigned below.
| trans- isomer | cis- Isomer | |||||
| Frequency cm-1 | IR Intensity | Symmetry | Frequency cm-1 | IR Intensity | Symmetry | Lit[10] |
| 1939 | 1606 | Eu | 1938 | 1605 | B2 | 1986 |
| 1940 | 1606 | Eu | 1942 | 813 | B1 | 1994 |
| 1967 | 6 | B1g | 1952 | 588 | A1 | 2004 |
| 2026 | 5 | A1g | 2019 | 545 | A1 | 2072 |
The computational IR stretch values are different from the literature values for the cis- isomer by ~3 %. Even so, this is ~50 cm-1 and too much to use predictively. This difference is not generally a calculation error (although basis sets of different qualities can produce varying results). The difference arises because Gaussian only calculates the values in the Harmonic Oscillator Approximation, whereas experimental data follows the anharmonic version. Comparing the sets of data allows the approximation of the harmonic oscillator to be evaluated, and for experimental purposes, the harmonic oscillator is far from satisfactory.
The number of IR active peaks, however, is well predicted computationally, which is very useful.
The symmetry labels are derived. Assigning four vectors, one for each CO, the reducible representation for the stretches are found. For the trans- isomer, A1g is guessed as a symmetric mode, and Eu guessed, as this is the active degenerate mode required (IR active modes are the translational vectors from the character table). When these are subtracted from the (IR), the remaining stretch has B1g symmetry. Only the two degenerate Eu stretches are IR active (according to the translational vectors).
| D4H | E | 2C4 | C2 | 2C2' | 2C2" | i | 2S4 | σH | 2σv | 2σd |
| Г (for the vectors) | 4 | 0 | 0 | 2 | 0 | 0 | 0 | 4 | 2 | 0 |
| minus A1g | 3 | -1 | -1 | 1 | -1 | -1 | -1 | 3 | 1 | -1 |
| minus Eu | 1 | -1 | 1 | 1 | -1 | 1 | -1 | 1 | 1 | -1 |
For the cis- isomer, four vibrations are seen, but only three of the symmetry labels can be IR active (A1, B1 and B2). Therefore at least one of the labels must occur twice. Guessing A1 first, for a symmetric stretch, leaves a set of numbers that requires a minus 1 and two plus ones in the σv' column, so this allows B1 to be guessed as the only minus one. The remaining components therefore have to be B2 and another A1. The A1 can be assigned to the high frequency symmetric stretches. The B1 and B2 are different only in the mirror plane the stretches occur in. The B2 must have a minus one assignment for a reflection in the plane including the z axis, which is defined by the principal C2 rotation axis. Therefore, the B2 vibration is the one as shown, right (vectors show the C atom movement, the oxygens of the carbonyl stretch in the other direction to the carbons to retain the centre of mass of the stretch), with the axial carbonyl groups stretching, unsymmetrically.
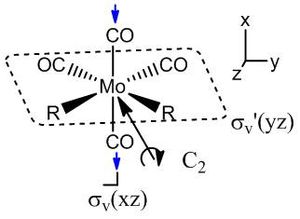
| C2v | E | C2 | σv'(xz) | σv(yz) |
| Γ for the vectors | 4 | 0 | 2 | 2 |
| minus A1 | 3 | 1 | 3 | 1 |
| minus B1 | 2 | 0 | 2 | 0 |
| minus B2 | 1 | 1 | 1 | 1 |
| Calculated IR Spectrum for the Trans- Isomer - Zoomed into the Carbonyl Stretch Region | Calculated IR Spectrum for the Cis- Isomer - Zoomed into the Carbonyl Stretch Region |
|---|---|
 |
|
Mini Project: Investigation
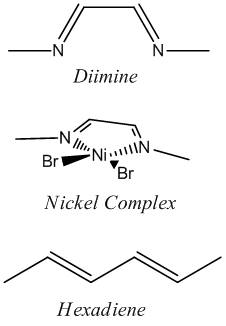
Outline

Nickel and iron catalysts[11],[12] bearing diimine ligands have seen success in polymerisation reactions, particularly for the synthesis of polyethylene. The nickel[13] catalyst shown above is tetrahedral at NiII, and is activated with MAO before polymerisation. The synthesis of these catalysts involves displacement of ligands of a nickel salt with the organic diimine ligand. This investigation looks to investigate briefly the geometry at nickel, showing that for small ligand residues (methyl) (shown right), square planar is favoured over the tetrahedral seen for the DIP groups (shown above). The complex is then compared to the diimine to investigate the possibility of back donation from the metal to the imines by examining the imine stretching frequencies with vibrational analysis. Experimental data did not show any change in the imine stretching frequencies upon binding to the metal, so computational studies were considered as a route to an explanation as to why not. Unfortunately, due to the short nature of the project, the desired result could not be determined with any faith, because without the large DIP (di-iso-propyl-phenyl) ligands, the nickel complex prefers to be square planar, and this centre will have different orbital relationships with the ligand, probably distorting the results. A NBO analysis was possible in determining the electron density across the complex.
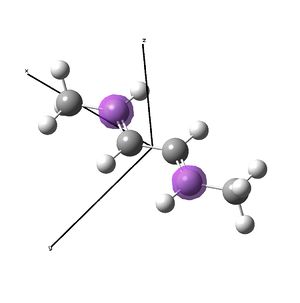
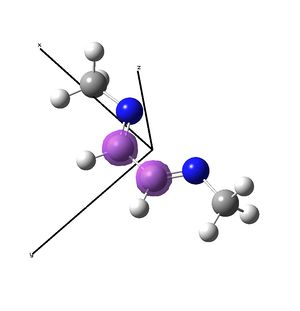
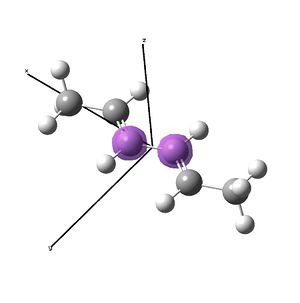
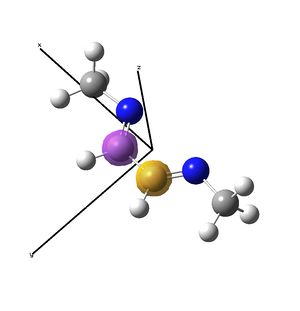
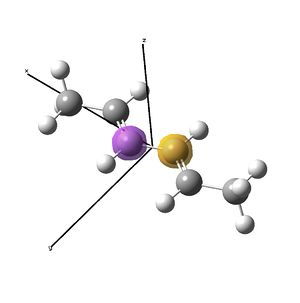
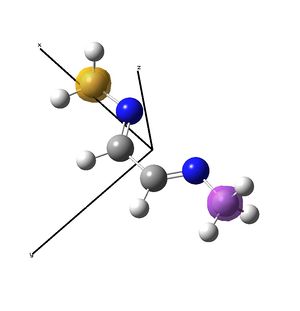
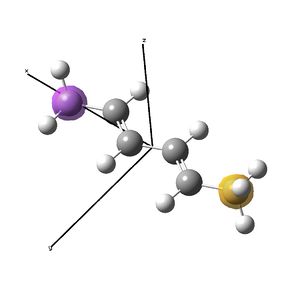
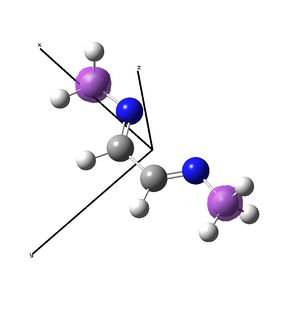
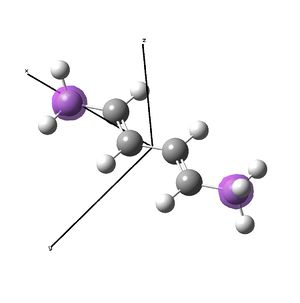
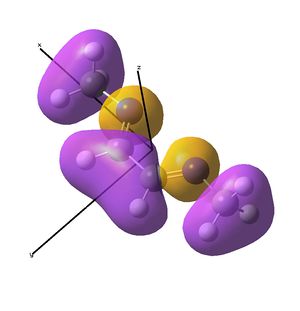
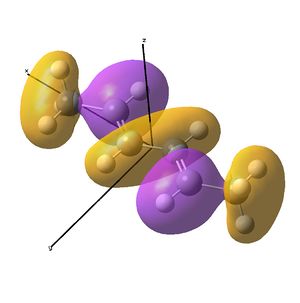
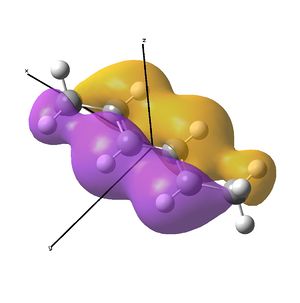
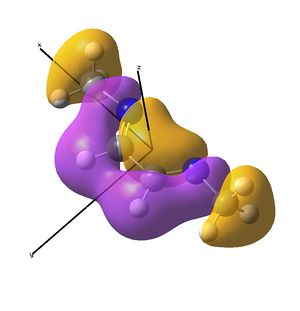
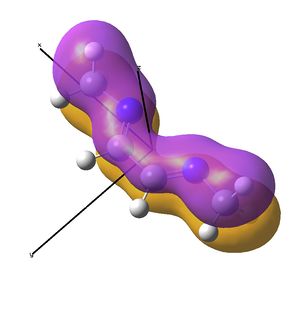
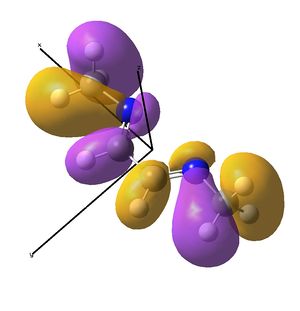
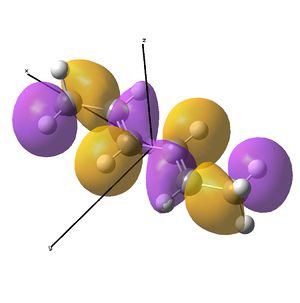
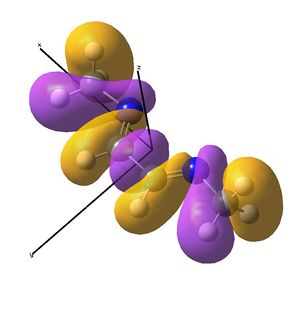
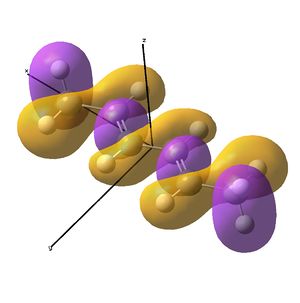
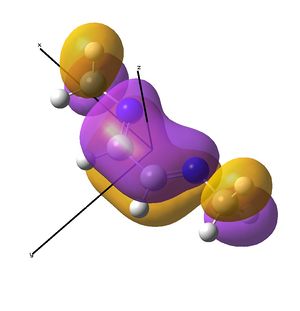
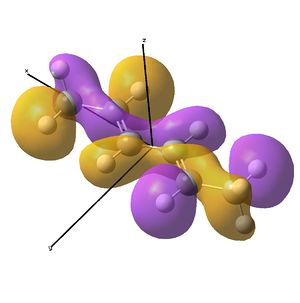
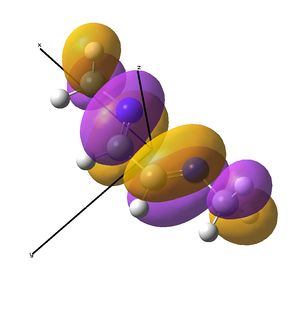
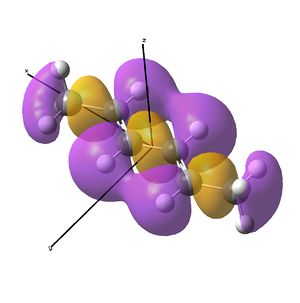
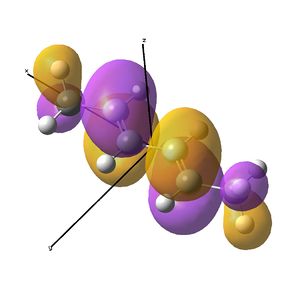
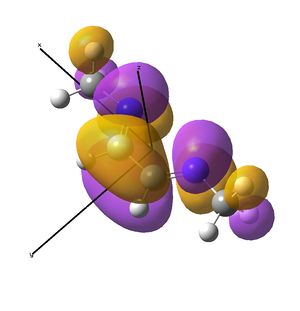
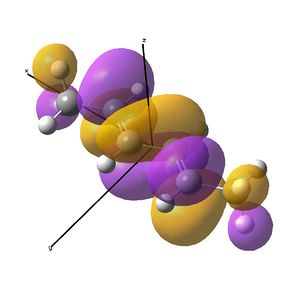
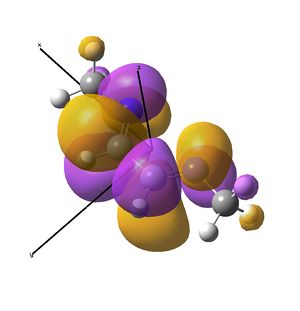
The diimine ligand (N,N'-dimethylethane-1,2-diimine)[14] was also compared with hexadiene, the (all) carbon analogue, and the molecular orbital differences investigated.
Experimental
The diimine ligand was built in Gaussview and loosely optimised (opt=loose) using the B3LYP method and the pseudo potential basis set LANL2DZ, in order to keep the same basis set to calculate the nickel complex with. This is because direct comparisons to the IR data and MO/s were desired, and differing basis sets may not provide consistent results, although it is appreciated that the LANL2DZ method uses only a medium level basis set for first row atoms. The hexadiene ligand was built likewise. The loosely optimised molecules were then refined using the opt=calcfc keywords. The structures converged and were checked by performing a frequency analysis. The molecules were deemed at a minima by the lack of negative vibrations and so energy analysis was performed with pop=(full,nbo) to obtain the molecular orbitals/natural bond analysis.
The nickel complex was then built, restricting the symmetry to C2v to decrease calculation time. However, the frequency analysis showed that the optimised C2v structure was not a minima. The structure was rebuilt and optimised using the opt=loose keywords. Upon opt=calcfc, the molecule optimised to a square planar structure. The structure was rebuilt afresh as a square planar molecule, restricting still to C2v symmetry. The same calculations were performed and the structure optimised to the same energy as the previous attempt, which was a minima as determined by vibrational analysis. Hence it was determined that with methyl groups on nitrogen, the molecule prefers a square planar geometry.
Summaries of the three compounds investigated:
Diimine_ligand_LANLDZ2_freq_v2		                        Hexadiene_LANLDZ2_FREQ_v2		                Nickel_C2_Energy_calcfc_v2
File Name = log_40659_Diimine_ligand_LANLDZ2_freq_v2		File Name = log_40782_Hexadiene_LANLDZ2_FREQ_v2		File Name = log_40791_Nickel_C2_Energy_calcfc_v2
File Type = .log		                                File Type = .log		                        File Type = .log
Calculation Type = FREQ		                                Calculation Type = FREQ		                        Calculation Type = FREQ
Calculation Method = RB3LYP		                        Calculation Method = RB3LYP		                Calculation Method = RB3LYP
Basis Set = LANL2DZ		                                Basis Set = LANL2DZ		                        Basis Set = LANL2DZ
Charge = 0		                                        Charge = 0		                                Charge = 0
Spin = Singlet		                                        Spin = Singlet		                                Spin = Singlet
E(RB3LYP) = -266.63710214 a.u.		                        E(RB3LYP) = -234.59618090 a.u.	                     	E(RB3LYP) = -462.42824307 a.u.
RMS Gradient Norm = 0.00000330 a.u.		                RMS Gradient Norm = 0.00003460 a.u.	           	RMS Gradient Norm =  a.u.
Imaginary Freq = 0		                                Imaginary Freq = 0		                        Imaginary Freq = 0
Dipole Moment = 2.9191 Debye		                        Dipole Moment = 0.0001 Debye		                Dipole Moment = 11.8181 Debye
Point Group = C1		                                Point Group = C1		                        Point Group = C2
Job cpu time:  0 days  0 hours  5 minutes  7.8 seconds.		Job cpu time:  0 days  0 hours  6 minutes 47.5 seconds.	Job cpu time:  0 days  0 hours  4 minutes  33.2 seconds.
The DOIs for all four molecules are here (post frequency): Hexadiene DOI:10042/to-7806 ; "Ready to Bind" Diimine: DOI:10042/to-7807 ; Nickel Complex DOI:10042/to-7809 ; Linear Diimine DOI:10042/to-7810
Linear vs "Ready to Bind" Diimine Ligand

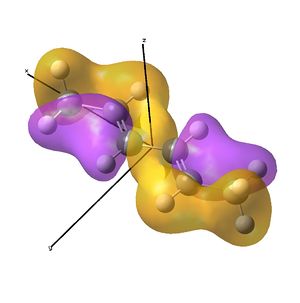
As the nuclei change position in a molecule, the molecular orbitals change too, as the change in local environment changes orbital overlaps and charge distribution. The diimine ligand was calculated to be considerably more stable as a linear molecule, but requires the bent form to bind to the nickel. The MOs will be studied below for the bent molecule, to allow a better comparison to the nickel complex MOs, and by comparing the linear orbitals to the the bent ones, the extent in the change in MOs with geometry can be discussed . This Jmol shows that the diimine aligns exactly as the hexadiene did, with the N lone pairs positioned as the H atoms on the carbon analogue were. The linear diimine was calculated as for the bent one:
Diimine_linear_opt_freq_v1_kga08
File Name = log_41399_Diimine_linear_opt_freq_v1_kga08
File Type = .log
Calculation Type = FREQ
Calculation Method = RB3LYP
Basis Set = LANL2DZ
Charge = 0
Spin = Singlet
E(RB3LYP) = -266.64955379 a.u.
RMS Gradient Norm = 0.00002371 a.u.
Imaginary Freq = 0
Dipole Moment = 0.0011 Debye
Point Group = C1
Job cpu time:  0 days  0 hours  4 minutes  3.2 seconds.
The energy difference is (-266.63710214- -266.64955379 = -0.01245165 au) 32 kJ/mol in favour of the linear diimine.
NBO/Charge Distribution Analysis
pop=(nbo,full) was included in the final energy runs (after the frequency analysis had determined the validity of the results) to obtain the NBO analysis and molecular orbitals. The imine was expected to show increased electron density on the nitrogen atoms, particularly due to the lone pairs required to attach the ligand to the nickel to form the catalyst.
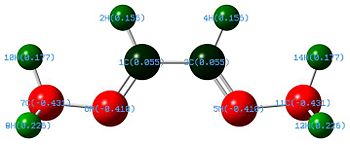
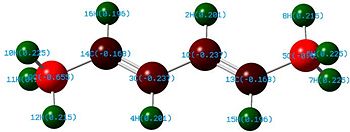
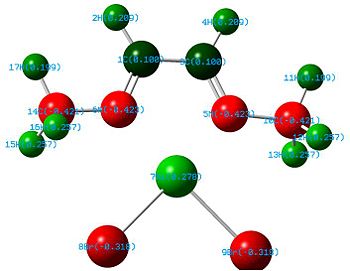
It is noted that a higher charge distribution seems to accumulate on the terminal carbons of the ligand and hexadiene. Reasons as to this are discussed further in the MO section. The electronegative nitrogen has much more charge distribution than the carbons in the ligand, and this is increased further on binding to nickel, which is rather positive (Ni2+). The electronegative bromine atoms are of course negatively biased.
Looking into the energy output file, the following is extracted:
 8. (1.91541) BD ( 1) N   5 -Ni   7
                ( 88.16%)   0.9390* N   5 s( 28.52%)p 2.51( 71.48%)
                                            0.0001 -0.5336  0.0208  0.0000  0.0000
                                           -0.4760  0.0376  0.6973 -0.0269
                ( 11.84%)   0.3440*Ni   7 s( 25.42%)p 1.91( 48.65%)d 1.02( 25.94%)
                                            0.0002 -0.5039  0.0171  0.0000  0.0000
                                            0.0000  0.0008  0.4960 -0.0234  0.0001
                                           -0.4893  0.0208  0.0000  0.0000  0.0000
                                            0.0000  0.5028 -0.0253  0.0671 -0.0014
                                           -0.0368 -0.0101
This is to examine one of the N-Ni bond. It shows a good 88 % of the bond is contributed from the N lone pair, which appears to be s"p2.5" hybridised, probably a result of the geometry change required on binding the diimine to the nickel centre. The nickel contributes 12%, with a 25% of this originating from a d orbital. The d-orbital is perhaps providing electron density in the form of "back-bonding".
Vibrational Analysis of The Imine Stretches: Comparing the Free Ligand to the Nickel Complex
| cm-1 | Symmetric C=(N) Stretch | IR Intensity | Asymmetric C=(N) Stretch | IR Intensity |
| Bent Diimine Ligand (6-311g) | 1668 | 15 | 1715 | 10 |
| Linear Diimine Ligand (LANL2DZ) | 1680 | 45 | 1701 | 0 |
| Bent Diimine Ligand | 10 | 9 | ||
| Nickel Complex | 57 | 1.3 | ||
| Hexadiene | 0 | 5 |
Firstly, it is worth noting that the comparison to another basis set (high level) (6-311g) is very favourable for the diimine. Of more interest is the large decrease in the imine stretches for the nickel complex, as predicted, although the error may be up to ~10 % (harmonic approximation), so the results are not infallible - despite this, there is a significant difference and it is perhaps enough to give some weight to the argument.
It is worth noting the zero IR intensity symmetric stretch of the hexadiene ligand; there is not a change in dipole moment due to the linear conformation. It is likely that this would be weakly allowed in solution due to fluxional conformers. The stretches are also both weakly allowed for the diimine due to the change in dipole moment which results from the imperfect structure - the initial structure is different, possibly due to the decreased sterics (missing H on the imine nitrogen). The nickel complex has the same weakly allowed stretches. When the ligand has the large DIP groups on, as for the real ligand, the fluxionality will allow the symmetry to be broken and the "symmetric" stretches observed.
Here is also an example of where the asymmetric stretch is of lower energy than the symmetric stretch (the hexadiene). The C=N bond lengths change slightly upon binding to nickel, with the distance increasing from 1.29 Å to 1.31 Å, another indication of some back donation into the π*C=N
MO Analysis
The MO/s were calculated via the energy option in Gaussian:
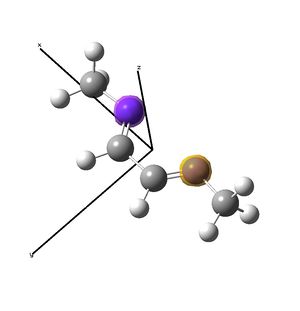
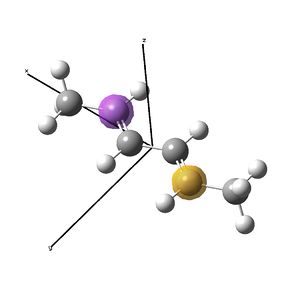
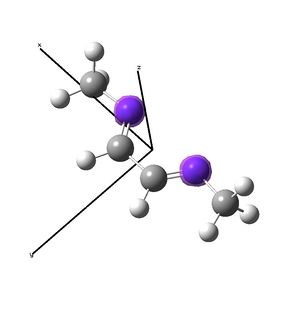
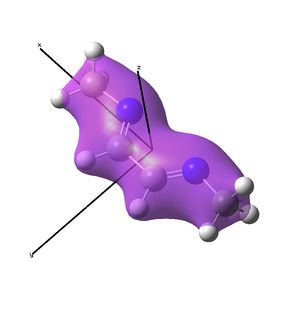
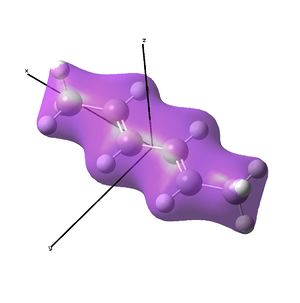
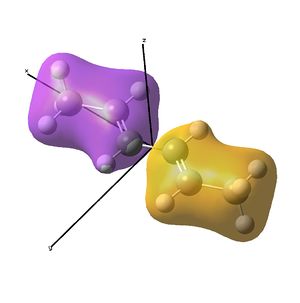
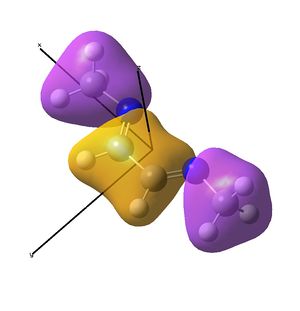
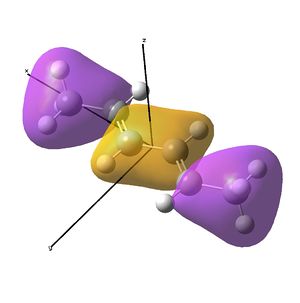
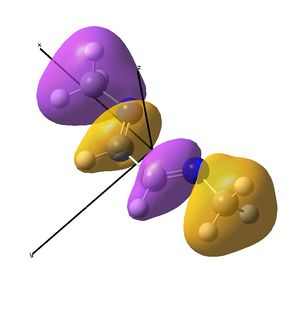
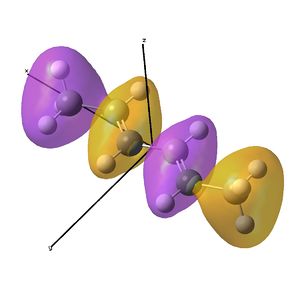
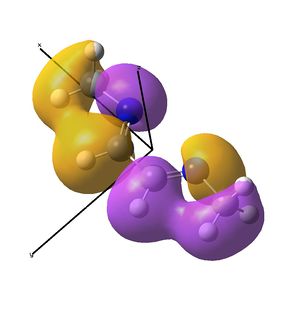
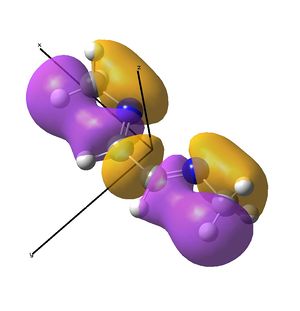
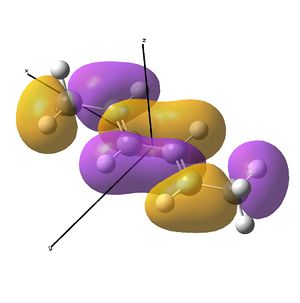
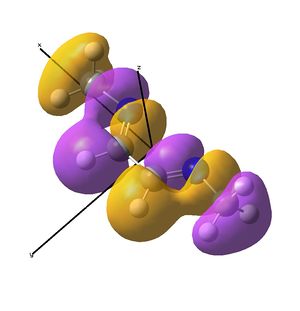
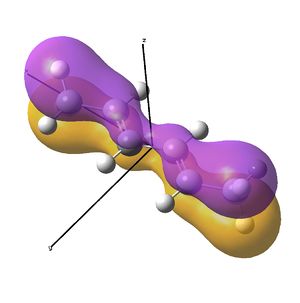
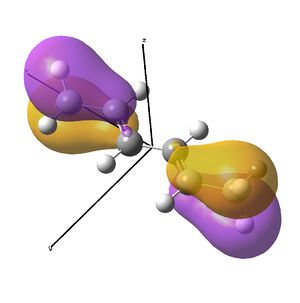
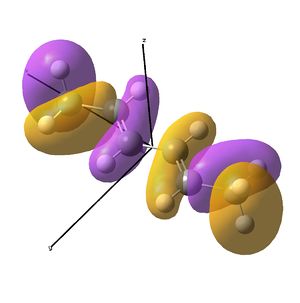
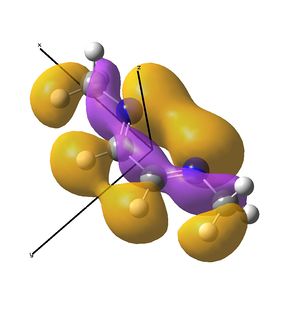
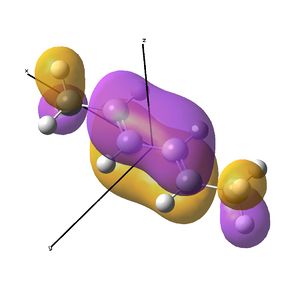
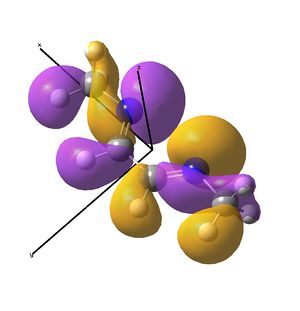
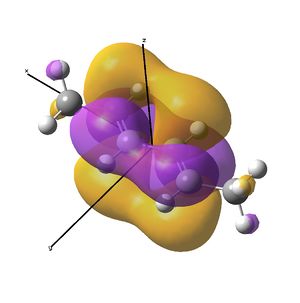
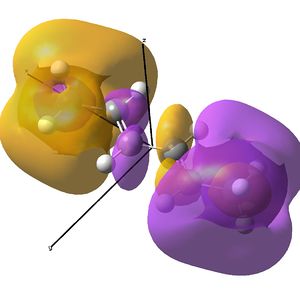
The MO/s for the hexadiene and the diimine are shown below.
Nickel MO/s and Bonding to the Ligands
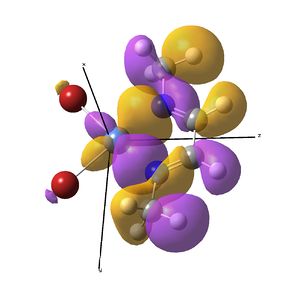
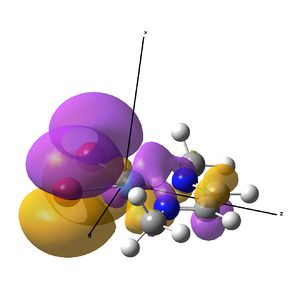
This investigation started initially to investigate the effect a metal centre would have on the IR stretches of the diimine ligand bound to it. It has so far been determined that actually, these symmetric stretches are (almost) IR inactive computationally, due to a zero dipole moment change, but in solvent systems, large enough ligands fluxionality may distort the symmetry making the vibrations allowed.
The IR analysis above showed that for the nickel complex, the imine stretches are of lower frequency/energy for the square planar version modelled here. This frequency decrease is normally explained by back donation from the metal to the relevant π* orbitals, weakening the bond. Examining the MO/s for the square planar nickel complex, a contender for this can be seen in MO 36, shown right. The dxz on Ni is interacting with what was for the free ligand, the LUMO orbital. This orbital has a node between each C=N atom, so donation into this orbital should weaken that bond.
In the original tetrahedral molecule, the bulky diimine ligand is forced to make a tetrahedral nickel centre, presumably due to sterics, as the R groups on the nitrogen atoms were DIP groups. Upon binding the diimine to the NiBr2, no change in the (sym) C=N stretching frequency was observed experimentally. Extrapolating back to the NiBr2 fragment and the diimine fragment, a theory must be developed which means no back bonding is observed.
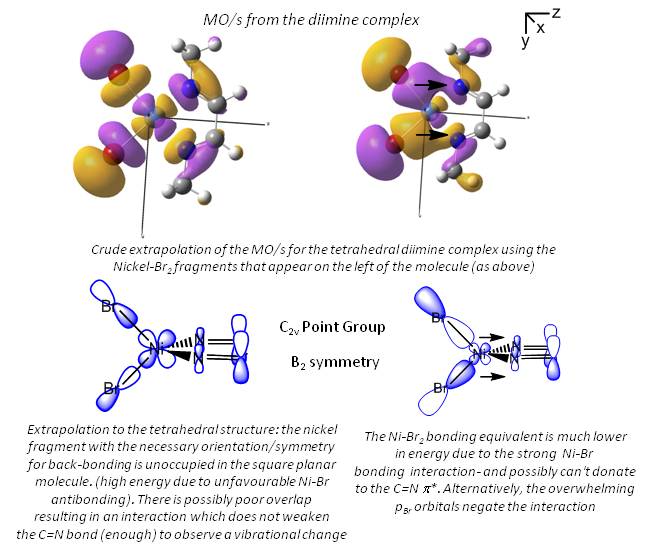
In the above analysis it is noted that the back bonding for the square planar molecule arises from interaction of the Ni dxz orbital with the LUMO of the diimine ligand. Reorientating the diimine ligand to be tetrahedral retains the C2v symmetry, but requires the dyz orbital to interact.
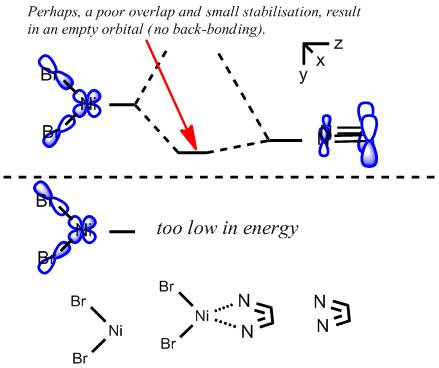
A crude prediction of what may be occurring is considered below. Firstly, the relevant NiBr2 fragments are considered. There exists the bonding and anti-bonding equivalent of the Br p orbitals interacting with the Ni dyz. The fully bonding MO will be much to low in energy to access the LUMO of the diimine sufficiently and no back-bonding should be observed. Secondly, the anti-bonding NiBr2 combination may be considered. For the square planar molecule modelled here, this fragment is very high in energy, likely due to the large negative Ni-Br2 interactions. It is feasible therefore that this does not interact well with the LUMO, meaning little back-bonding is observed. If the interaction leads to an empty orbital, as was seen here, then no electrons will be available to donate and the C=N stretch will not be weakened.
Obviously, this argument is very approximate and the extent of the interactions would have to be considered by modelling the correct molecule - this would be attempted if more computational time was available.
Mini Project Conclusions
- The linear form of N,N'-dimethylethane-1,2-diimine was determined to be conformationally more stable than the bent analogue, which is required to bind to a nickel centre.
- The nickel complex, with two Br ligands and the diimine ligand (N,N '-dimethylethane-1,2-diimine) was found to prefer a square planar geometry, despite the molecule N,N '-di(iso-propylphenyl)ethane-1,2-diimine being experimentally found to be tetrahedral. This is largely attributed to sterics.
- NBO analysis showed nickel d-orbital participation in the Ni-N bond, indicating the possibility of back-bonding.
- NBO charge distribution showed the imine nitrogens on the diimine ligand to posses a greater degree of negative charge in the presence of nickel (relative to the free ligand), also supporting backbonding. The C=N bond lengths are also slightly elongated on binding to NiBr2.
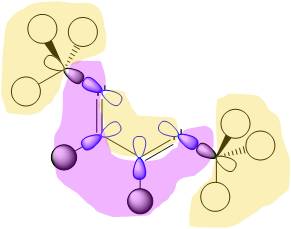
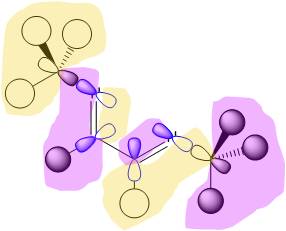
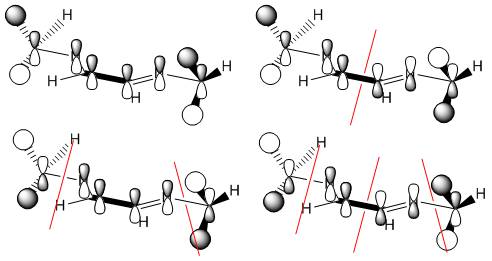
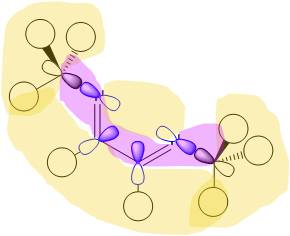
- The molecular orbitals of the bent diimine ligand were shown to be very similar to the linear version, with very similar nodal planes. These nodal planes were found to provide a route to predicting the form of the low energy molecular orbitals, but it was discovered that higher energy orbitals are less predictable, as mixing with other orbitals depends strongly on the energy levels of the anti-bonding fragments, which are hard to predict.
- The hexadiene was found to have exceedingly similar molecular orbitals to the diimine at lower energies, but the higher energy orbitals are again less similar. Clearly, substituting two carbon atoms for two nitrogen atoms lower the energy of the N-fragments (N is more electronegative), which results in differing interactions at higher energies. The anti-bonding MO partner is destabilised more than the bonding orbital is stabilised.
- IR analysis showed that the linear and bent versions of the diimine had similar but not identical stretches. When bound to the nickel complex, the stretches were significantly lowered in energy, another indication of back bonding.
- In order to try and explain the observed lack of change of the imine stretches in the experimental data, a speculative theory was proposed, suggesting that perhaps, in the tetrahedral molecule, the orientation of the ligand is not optimised to allow back donation. This could be due to the required orbital for back donation being empty as it is high in energy. Alternatively, the large lone pairs on bromine may counter the effect of the nickel, which has a low orbital contribution at the required energy.
References
- ↑ M. S. Schuurman, W. D. Allen, H. F. Schaefer, Journal of Computational Chemistry, 2005, 26 (11), 1106 DOI:10.1002/jcc.20238
- ↑ Egon Wiberg, Nils Wiberg, Arnold Frederick Holleman, Inorganic Chemistry, 2001, Academic Press, Ed 32
- ↑ M. Atanasov, D. Reinen, J. Phys. Chem. A, 2001, 105 (22), 5467 DOI:10.1021/jp004511j
- ↑ 4.0 4.1 4.2 G. Hogarth, T. Norman, Inorganica Chimica Acta, 1997, 254 (1), 167 DOI:10.1016/S0020-1693(96)05133-X
- ↑ 5.0 5.1 D. W. Bennett, T. A. Siddiquee, D. T. Haworth, S. E. Kabir, F. K. Camellia, Journal of Chemical Crystallography, 2004, 34 (6), 353 DOI:10.1023/B:JOCC.0000028667.12964.28
- ↑ F. A. Cotton, D. J. Darensbourg, S. Klein, B. W. S. Kolthammer, Inorg. Chem., 1982, 21 (1), 299 DOI:10.1021/ic00131a055
- ↑ C. Xi, Y. Liu, C. Lai, L. Zhou, Inorganic Chemistry Communications, 2004, 7 (11), 1202 DOI:10.1016/j.inoche.2004.09.012
- ↑ M. N. Sokolov, E. V. Chubarova, K. A. Kovalenko, I. V. Mironov, A. V. Virovets, E. V. Peresypkina, V. P. Fedin, Russian Chemical Bulletin, 2005, 54 (3), 615 DOI:10.1007/s11172-005-0296-1
- ↑ L. Hirsivaara, M. Haukka, J. Pursiainen, Inorganic Chemistry Communications, 2000, 3 (10), 508 DOI:10.1016/S1387-7003(00)00131-3
- ↑ E. C. Alyea, S. Song, Inorg. Chem., 1995, 34 (15), 3873 DOI:10.1021/ic00119a006
- ↑ G. J. P. Britovsek, M. Bruce, V. C. Gibson, B. S. Kimberley, P. J. Maddox, S. Mastroianni, S. J. McTavish, C. Redshaw, G. A. Solan, S. Strömberg, A. J. P. White, D. J. Williams, J. Am. Chem. Soc., 1999, 121 (38), 8740 DOI:10.1021/ja990449w
- ↑ L. K. Johnson, C. M. Killian, M. Brookhart, J. Am. Chem. Soc., 1995, 117 (23), 6415 DOI:10.1021/ja00128a054
- ↑ D. P. Gates, S. A. Svejda, E. Oñate, C. M. Killian, L. K. Johnson, P. S. White, M. Brookhart, Macromolecules, 2000, 33 (7), 2334 DOI:10.1021/ma991234+
- ↑ A. J. Arduengo, R. Krafczyk, R. Schmutzler, H. A. Craig, J. R. Goerlich, W. J. Marshall, M. Unverzagt, Tetrahedron, 1999, 55 (51), 14523 DOI:10.1016/S0040-4020(99)00927-8
Final Edit Kga08 16:53, 15 March 2011 (UTC)

