Rep:Mod:js3311inorgcompminiproj
Year 3 Inorganic Computational Mini Project - Ionic Liquids: Designer Solvents
Comparison of selected 'onium' cations
A computational study on ionic liquids was made as part of the mini project chosen for this computational assignment. Ionic liquids are, in general, ions that exist in liquid in room temperature. It is usually made up of an organic cation and an inorganic anion. Due to the vast possibilities of pairing up various types of cations and anions to give unique properties, it is not possible to experimentally determine all the properties of each ions. Hence there is an increased usage of computational methods to aid in the understanding of these ions. In this mini project, the properties of N(CH3)4+, P(CH3)4+ and S(CH3)3+ were investigated using similar computational methods that were used in the first part of this assignment.
Optimisation and frequency analysis
The first step involved the optimisation of the molecule followed by a frequency analysis. The three molecules of interest were first built on GaussView and sent to the HPC for optimisation. Subsequently on the optimised structure, a frequency analysis was carried out via the HPC again. Both calculations were carried out using the 6-31G(d,p) basis set. Tables 1, 2 and 3 show the results of the optimising step together with the frequency analysis.
| Optimisation | Frequency Calculation | |
|---|---|---|
| File Type | .log | .log |
| Calculation Type | FOPT | Freq |
| Basis Set | 6-31G(d,p) | 6-31G(d,p) |
| Final Energy (au) | -214.18127322 | -214.18127322 |
| Gradient | 0.00000003 | 0.00000032 |
| Dipole Moment (Debye) | 3.4186 | 3.4186 |
| Point Group | C1 | C1 |
| Calculation time taken | 12 min 24.0 s | 21 min 28.1 s |
| .log files | Item Value Threshold Converged? Maximum Force 0.000000 0.000015 YES RMS Force 0.000000 0.000010 YES Maximum Displacement 0.000008 0.000060 YES RMS Displacement 0.000003 0.000040 YES Predicted change in Energy=-5.840350D-13 Optimization completed. |
Item Value Threshold Converged? Maximum Force 0.000001 0.000450 YES RMS Force 0.000000 0.000300 YES Maximum Displacement 0.000010 0.001800 YES RMS Displacement 0.000004 0.001200 YES Predicted change in Energy=-4.384135D-12 Optimization completed. |
Low frequencies --- -5.4430 -2.0385 -0.0007 -0.0006 -0.0003 3.9825 Low frequencies --- 183.7666 288.3988 288.9025 |
| Optimisation | Frequency Calculation | |
|---|---|---|
| File Type | .log | .log |
| Calculation Type | FOPT | Freq |
| Basis Set | 6-31G(d,p) | 6-31G(d,p) |
| Final Energy (au) | -500.82701172 | -500.82701172 |
| Gradient | 0.00000110 | 0.00000115 |
| Dipole Moment (Debye) | 3.1972 | 3.1972 |
| Point Group | C1 | C1 |
| Calculation time taken | 24 min 11.2 s | 20 min 25.8 s |
| .log files | Item Value Threshold Converged? Maximum Force 0.000003 0.000015 YES RMS Force 0.000000 0.000010 YES Maximum Displacement 0.000058 0.000060 YES RMS Displacement 0.000015 0.000040 YES Predicted change in Energy=-6.798695D-11 Optimization completed. |
Item Value Threshold Converged? Maximum Force 0.000004 0.000450 YES RMS Force 0.000001 0.000300 YES Maximum Displacement 0.000281 0.001800 YES RMS Displacement 0.000108 0.001200 YES Predicted change in Energy=-3.688579D-10 Optimization completed. |
Low frequencies --- -2.5025 -0.0019 0.0030 0.0031 5.1097 7.5701 Low frequencies --- 156.4491 192.0483 192.2793 |
| Optimisation | Frequency Calculation | |
|---|---|---|
| File Type | .log | .log |
| Calculation Type | FOPT | Freq |
| Basis Set | 6-31G(d,p) | 6-31G(d,p) |
| Final Energy (au) | -517.68327359 | -517.68327359 |
| Gradient | 0.00000073 | 0.00000072 |
| Dipole Moment (Debye) | 3.4663 | 3.4663 |
| Point Group | C1 | C1 |
| Calculation time taken | 13 min 2.4 s | 10 min 14.1 s |
| .log files | Item Value Threshold Converged? Maximum Force 0.000001 0.000015 YES RMS Force 0.000001 0.000010 YES Maximum Displacement 0.000054 0.000060 YES RMS Displacement 0.000022 0.000040 YES Predicted change in Energy=-1.824758D-10 Optimization completed. |
Item Value Threshold Converged? Maximum Force 0.000002 0.000450 YES RMS Force 0.000001 0.000300 YES Maximum Displacement 0.000601 0.001800 YES RMS Displacement 0.000259 0.001200 YES Predicted change in Energy=-2.340552D-09 Optimization completed. |
Low frequencies --- -9.4907 -3.5011 0.0034 0.0046 0.0049 3.5578 Low frequencies --- 162.1235 199.5869 199.7515 |
Discussion
The various properties of the molecule including the C-X bond length, C-X-C bond angle and the shape with respect to the central atom were tabulated and presented in the table below.
N(CH3)4+ |
P(CH3)4+ |
S(CH3)3+ |
|||||||||||
|---|---|---|---|---|---|---|---|---|---|---|---|---|---|
| Shape with respect to central atom |
Tetrahedral | Tetrahedral | Trigonal pyramidal | ||||||||||
| C-X-C bond angle (°) | 109.5 (X = N) | 109.5 (X = P) | 102.7 (X = S) | ||||||||||
| C-X bond length (Å) | 1.51 | 1.82 | 1.82 |
Based on the optimised structure, it can be seen that both N(CH3)4+ and P(CH3)4+ adopt a tetrahedral shape around the central atom. This is in accordance to the VSEPR theory where 4 bond pairs will adopt the tetrahedral shape in order to minimise repulsion between the bonds. As such the angle between all bonds is the widest possible. S(CH3)3+ adopts a trigonal pyramidal shape about the central S atom. However its basic geometry is also a tetrahedral shape. The only difference with the first two cations would be the absence of the 4th bond pair. In S(CH3)3+, it is replaced by the lone pair on the S atom hence it takes up the same basic geometry.
Despite the similar geometries that all three compounds take up, their bond angle about the central atom differs slightly. While N(CH3)4+ and P(CH3)4+ have similar bond angle of 109.5 °, S(CH3)3+ have a smaller bond angle about the central atom at 102.7 °. This can be attributed to the shape of the molecule. The 4 angles about the tetrahedral-shaped molecule will adopt the 109.5 ° bond angle. While S(CH3)3+ have a similar basic geometry and should adopt the same bond angle, the presence of the lone pair on sulphur caused the C-S-C bond angle to decrease. This is because the lone pair-bond pair repulsion is stronger than the repulsion between two bond pairs as the lone pair electrons are much more localised on the sulphur atom. The deviation from the ideal bond length of 109.5 ° increases with the electronegativity of the central atom. Hence for a hypothetical O(CH3)3+ cation, the bond angle about the central atom is expected to be smaller than 102.7 °.
The bond length can also be compared between the three cations. From the calculations it can be seen that the C-N bond length is the shortest (1.51 Å) whereas the C-P and C-S bond lengths are similar (1.82 Å). This is because N is on the second period on the period table whereas P and S are on the third period. As a result the valence electrons of N is closer to the nucleus and hence resulting in a shorter bond with C. Valence electrons of P and S are on the 3rd quantum shell and hence have more diffuse orbitals leading to a longer bond length.
MO and NBO calculations
Following the frequency analysis, the next step involve a population analysis in order to visualise the MO and also to carry out a NBO calculations. The optimised structures of the three cations were subjected to a population analysis calculation via the HPC using the same basis set. The results of the calculation were published onto D-Space and links given below.
Population analysis for N(CH3)4+
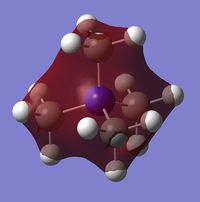
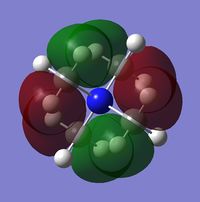
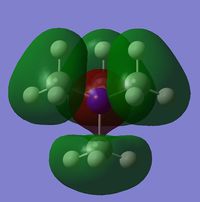
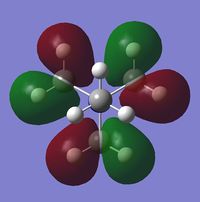
MO Discussion
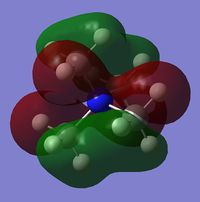
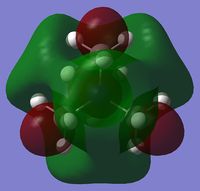
5 of the non-core occupied MOs have been visualised at an isovalue of 0.02 and tabulated below. A brief description of the nature of the MO is also elaborated.
NBO Discussion
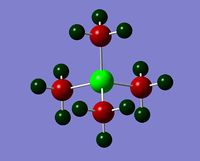
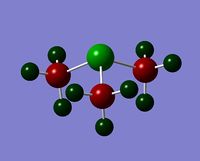
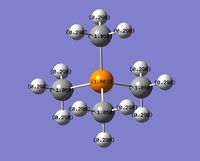
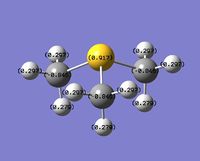
The charge distribution of the molecules that resulted from the population analysis of the molecules were collated and tabulated below.
| N(CH3)4+ | P(CH3)4+ | S(CH3)3+ | |
|---|---|---|---|
| Charge distribution by colour | 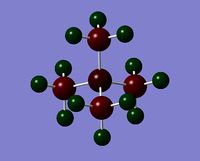 |
 |
|
| Charge distribution by values | 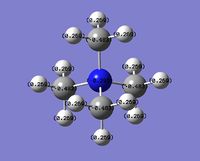 |
 |
|
Even though the central atom was the only thing that changed between the three cations, the charge distribution differed greatly. It can be seen that N(CH3)4+ have a smaller range as characterised by the dark green and red colour on the atoms, whereas the other two cations have more polarised charge distribution given by the bright green and red colours on the atoms. It is also interesting to note that when the central atom is N, the charge on the central atom is mildly negative as given by the dark red colour. However in contrast, when the central atom is P or S, the central atom becomes mildly positive (S) to strongly positive (P). This is due to the electronegativity of the central atom. As N is highly electronegative, it has a tendency to pull electron density towards it and hence the central atom (N) remains negative. However as P and S are less electronegative, the central atom becomes electron-deficient as characterised by the green colour on the central atom. However, as P is slightly less electronegative than S, it has lower electron density, shown by a higher positive value for charge distribution of 1.667 compared to that of S at 0.917.
In addition, from the population analysis, it is possible to understand the nature of the C-X bond, where X is the central heteroatom. The contribution of the each atom to the C-X bond can be found in the .log of the population analysis. Here it is tabulated and shown in the table below.
| N(CH3)4+ | P(CH3)4+ | S(CH3)3+ | |
|---|---|---|---|
| Contribution by C | 34 % | 60 % | 49 % |
| Contribution by X | 66 % | 40 % | 51 % |
One significant observation would be that this result coincides with the understanding of the electronegativity of the elements involved (C, N, P and S). The electronegativity is given by the order N > S > C > P, where S and C have very marginal difference and can be regarded to have almost the same electronegativity. When looking at the percentage contribution by each atom, it would agree with the electronegativity of the elements; N has a higher contribution to the electron density in the C-N bond, whereas C has a higher contribution to the electron density in the C-P bond, and there are almost equal contribution by S and C to the C-S bond although a marginally higher contribution by S.
Another observation would be that the larger the contribution of the heteroatom to the C-X bond, the more negative the heteroatom is in the charge distribution. It can be seen that when X = N, the contribution by N to the bond is 66 %, and the charge distribution has a negative value of -0.295. However as the contribution of X dropped to 40 % as with P, the charge distribution value is now positive at 1.667.
When the charge is being placed over the N atom, it would indicate that N is electron-deficient and holds a positive charge as it has lost its neutral charge in the bonding with another CH3 group. When looking at the NBO calculations, it does not agree with the traditional way of placing a formal charge over the N atom. From table 6 it shows that the N atom is mildly negatively-charged given by the dark red colour on the atom. In contrast to the traditional way of placing a formal charge, the positive charge is smeared over the whole molecule, specifically on the H atoms of the molecule. Hence with no accurate way of drawing the distribution of positive charge over all the H atoms, it would be best represented with a formal positive charge on N as the presence of N gives rise to functionality in the molecule, which is key in illustrating mechanistic pathways in arrow-pushing.
Influence of functional groups
Presence of functional groups can also alter the properties of the cation of interest. In the previous section, the properties of neutral cations were being investigated. Herein, two different functional groups were investigated, the electron-donating hydroxyl group (OH) and the electron-donating nitrile group (CN) were added to N(CH3)4+ and the same calculations were ran to determine how these functional groups affect the properties of the solid.
Optimisation and frequency analysis
Both [N(CH3)3(CH2OH)]+ and [N(CH3)3(CH2CN)]+ were optimised using the same 6-31G(d,p) basis set and calculations performed via the HPC. The results of the calculations were tabulated below.
| Optimisation | Frequency Calculation | |
|---|---|---|
| File Type | .log | .log |
| Calculation Type | FOPT | Freq |
| Basis Set | 6-31G(d,p) | 6-31G(d,p) |
| Final Energy (au) | -289.39470714 | -289.39470714 |
| Gradient | 0.00000023 | 0.00000029 |
| Dipole Moment (Debye) | 5.2654 | 5.2654 |
| Point Group | C1 | C1 |
| Calculation time taken | 44 min 14.7 s | 27 min 14.3 s |
| .log files | Item Value Threshold Converged? Maximum Force 0.000001 0.000015 YES RMS Force 0.000000 0.000010 YES Maximum Displacement 0.000016 0.000060 YES RMS Displacement 0.000006 0.000040 YES Predicted change in Energy=-9.876055D-12 Optimization completed. |
Item Value Threshold Converged? Maximum Force 0.000001 0.000450 YES RMS Force 0.000000 0.000300 YES Maximum Displacement 0.000034 0.001800 YES RMS Displacement 0.000010 0.001200 YES Predicted change in Energy=-7.443290D-12 Optimization completed. |
Low frequencies --- -7.8462 -6.5078 -0.0009 -0.0005 0.0008 3.3666 Low frequencies --- 130.7361 214.3748 255.8446 |
| Optimisation | Frequency Calculation | |
|---|---|---|
| File Type | .log | .log |
| Calculation Type | FOPT | Freq |
| Basis Set | 6-31G(d,p) | 6-31G(d,p) |
| Final Energy (au) | -306.39376198 | -306.39376198 |
| Gradient | 0.00000016 | 0.00000028 |
| Dipole Moment (Debye) | 18.3589 | 18.3589 |
| Point Group | C1 | C1 |
| Calculation time taken | 28 min 13.8 s | 30 min 35.9 s |
| .log files | Item Value Threshold Converged? Maximum Force 0.000000 0.000015 YES RMS Force 0.000000 0.000010 YES Maximum Displacement 0.000059 0.000060 YES RMS Displacement 0.000012 0.000040 YES Predicted change in Energy=-1.211787D-11 Optimization completed. |
Item Value Threshold Converged? Maximum Force 0.000001 0.000450 YES RMS Force 0.000000 0.000300 YES Maximum Displacement 0.000041 0.001800 YES RMS Displacement 0.000010 0.001200 YES Predicted change in Energy=-1.034558D-11 Optimization completed. |
Low frequencies --- -4.8948 -1.8293 -0.0009 -0.0008 -0.0008 5.0542 Low frequencies --- 91.6378 153.9753 211.4833 |
MO and NBO calculation
Following the optimisation and frequency analysis made to confirmed that the lowest energy optimised structure were achieved, a population analysis was carried out on both molecules as well. Calculations were made via the HPC and the result of the calculation were published onto D-Space and given below.
Effect of functional groups on charge distribution
The effect of functional groups on the charge distribution can also be investigated. Similar to previous section, population analysis were ran and the NBO analysis was done on the two molecules and charge distribution by colours and also values were summarised in the table below.
| N(CH3)4+ | [N(CH3)3(CH2OH)]+ | [N(CH3)3(CH2CN)]+ | |
|---|---|---|---|
| Charge distribution by colour |  |
 |

|
| Charge distribution by values |  |
 |

|
From here it can be seen that by adding an OH or CN group, the charge distribution differed a little. For [N(CH3)3(CH2OH)]+, it can be seen that the carbon atom directly bonded to the OH group is slightly positively charged (0.088) whereas the other carbon atoms are slightly negatively charged (-0.494 to -0.491). In contrast for [N(CH3)3(CH2CN)]+, all carbon atoms are slightly negatively charged (-0.489 to -0.358). However, the carbon directly bonded to CN group is slightly less negatively charged (-0.358). Both N central atom however, remained slightly negatively charged (-0.322 for [N(CH3)3(CH2OH)]+ and -0.289 for [N(CH3)3(CH2CN)]+).
Following the NBO analysis, it is interesting to note that the NBO analysis does not match with theoretical understanding of electron-donating and electron-withdrawing groups. As the OH group is a known electron-donating group, it is expected that it would donate its electron density towards neighbouring atoms. However as shown from the NBO analysis, the O atom is negatively charged (-0.725) whereas its adjacent atoms are all positively charged (0.088 for C and 0.521 for H) for [N(CH3)3(CH2OH)]+. Similarly when looking at [N(CH3)3(CH2CN)]+, CN group is an electron-withdrawing group. Despite the presence of N on CN pulling electron density away from the adjacent C molecule as illustrated by the difference in the charge distribution, it can be seen that the extent of electron-withdrawing capabilities does not extend out any further. The carbon bearing the CN group is negatively charged (-0.358) as previously mentioned. In theory, that particular carbon should be slightly electron-deficient due to the presence of the electron-withdrawing CN group. One observation that is consistent with theory though, would be the charge distribution on the central atom. While the charge on the central atom N is -0.295 for N(CH3)4+, that of [N(CH3)3(CH2OH)]+ is indeed lower at -0.322 while that of [N(CH3)3(CH2CN)]+ is higher at -0.289.
Effect of functional groups on HOMO and LUMO
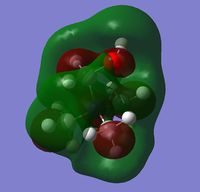
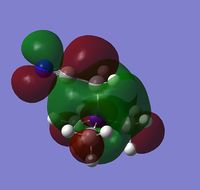
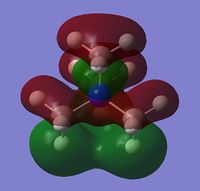
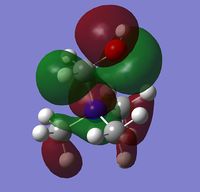
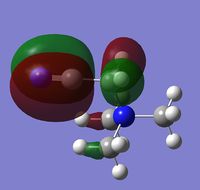
In addition to the NBO analysis, an analysis of the HOMO and LUMO was done by understanding how they vary in terms of structure and energy levels when different functional groups are placed on the cation. The HOMO and LUMO of N(CH3)4+, [N(CH3)3(CH2OH)]+ and [N(CH3)3(CH2CN)]+ together with the corresponding energy values were tabulated in the table below.
It can be seen that one significant observation between the HOMO and LUMO of all three cations would be that the HOMO are slightly localised on specific regions. However the LUMO are very diffuse and delocalised. As shown in the table, the LUMO extend out a very large area all over the cations.
It is also interesting to note the changes in the shape of the molecular orbitals when different functional groups were placed on the cation. These changes are reflected mainly on the HOMO of each cation. The HOMO of N(CH3)4+ can be described to be localised on the methyl groups. However when looking at [N(CH3)3(CH2OH)]+, the HOMO is largely localised on the OH group and the atoms adjacent to it. This is in contrast to N(CH3)4+ where the orbitals are spread out amongst the methyl groups. For [N(CH3)3(CH2CN)]+, the HOMO is even more localised on the CN group and the carbon adjacent to it such that there is almost negligible molecular orbitals found elsewhere. The LUMOs in contrast, have very small observable changes. This is because the molecular orbitals are all delocalised around the whole molecule. It can be observed though, that there is two nodal plane at the CN group of [N(CH3)3(CH2CN)]+, whereas the LUMO of [N(CH3)3(CH2OH)]+ do not have these nodal places at the OH group.
Also, some observations can be made regarding the effect of adding functional groups on energy levels of the HOMO and LUMO of the cations. From the table it can be seen that adding both function groups led to a rise in the energy level of the HOMO. However the raise in energy level of the HOMO for [N(CH3)3(CH2OH)]+ (from -0.57934 to -0.48763 au) was greater than that of [N(CH3)3(CH2CN)]+ (from -0.57934 to -0.50047 au). The presence of the functional groups also have an effect on the LUMO of the cations. While the presence of an OH group led to an increase in the energy level of the LUMO for [N(CH3)3(CH2OH)]+ (from -0.13302 to -0.12459 au), the presence of the CN group led to a decrease in the energy level of the LUMO for [N(CH3)3(CH2CN)]+ instead (from -0.13302 to -0.18182 au). The changes to the energy levels of both the HOMO and LUMO led to a change in the HOMO-LUMO gap of the cations. While the HOMO-LUMO gap has decreased in general when adding either a CN or OH group, the HOMO-LUMO gap for [N(CH3)3(CH2CN)]+ is the smallest amongst the three cations at 0.31865 au.
Ions are hard molecules as they engage in ionic interactions via electrostatic forces. However, organic cations are large and hence results in a dispersion of charge throughout the whole molecule, This makes the molecule softer and the nature of bonding is governed by HOMO-LUMO interactions (ie. covalent interactions). From the relative energies of the HOMO and LUMO of both [N(CH3)3(CH2OH)]+ and [N(CH3)3(CH2CN)]+ against N(CH3)4+, it is possible to predict the difference in reactivity when altering the functional groups on the cation. When looking at [N(CH3)3(CH2OH)]+, the HOMO increased in energy relative to N(CH3)4+, allowing the cation to be a better electron donor as it would have a better HOMO-LUMO match with the reactant (especially for intramolecular reactions) as given by the Klopman-Salem equation. Similarly when looking at [N(CH3)3(CH2CN)]+, the LUMO energy level dropped relative to N(CH3)4+. This time it makes the cation a better electron acceptor rather than a donor.
Conclusion
In conclusion, with the understanding of basic calculations in computational chemistry, the knowledge was applied in the study of different types molecules. These basic calculation functions include an optimisation, frequency and population analysis, for which more information about the cations can be extracted. These various calculations were used to study the molecular orbitals and also the natural bonding orbitals of various ionic liquid cations in this mini project. In addition, by varying the functional groups on one of the cation, the changes observed in the MO and NBO calculations were discussed.

