Rep:Mod:js3311inorgcomp
Year 3 Inorganic Computational Part 1
The first part of the inorganic computational assignment involved exploring various functions in GaussView and understanding the background theories behind the various calculations involving different types of basis sets. Different molecules were chosen to illustrate these features including BH3, GaBr3 and BBr3. This was then taken a step further by exploring various types of calculations and then with a better understanding, the same type of calculation was carried out on NH3 and finally the NH3BH3 adduct, of which the association energy of the molecules was derived. After an introduction to these basic calculations, a mini project was carried out on ionic liquid molecules which can be found here.
Calculations involving basis sets
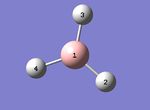
Investigation into the optimisation of BH3 was carried out. GaussView was used to build the molecule and calculations were run with the 3-21G basis set on Gaussian. Results of the calculation were tabulated in Table 1.
| File Type | .log |
| Calculation Type | FOPT |
| Basis Set | 3-21G |
| Final Energy (au) | -26.46226429 |
| Gradient | 0.00008851 |
| Dipole Moment (Debye) | 0.0003 |
| Point Group | Cs |
| Calculation time taken | 21.0 s |
Item Value Threshold Converged? Maximum Force 0.000220 0.000450 YES RMS Force 0.000106 0.000300 YES Maximum Displacement 0.000940 0.001800 YES RMS Displacement 0.000447 0.001200 YES Predicted change in Energy=-1.672479D-07 Optimization completed. | |
However, the 3-21G basis set is a very simple basis set. A better basis set would be the 6-31G(d,p) basis set, which gives a more accurate calculations closer to observed results. Having optimised the structure using the 3-21G basis set, the 6-31G(d,p) was thus used to further optimise the structure. The results of the calculation was tabulated in the table below.
| File Type | .log |
| Calculation Type | FOPT |
| Basis Set | 6-31G(d,p) |
| Final Energy (au) | -26.61532360 |
| Gradient | 0.00000706 |
| Dipole Moment (Debye) | 0.0001 |
| Point Group | Cs |
| Calculation time taken | 6.0 s |
Item Value Threshold Converged? Maximum Force 0.000012 0.000450 YES RMS Force 0.000008 0.000300 YES Maximum Displacement 0.000061 0.001800 YES RMS Displacement 0.000038 0.001200 YES Predicted change in Energy=-1.068574D-09 Optimization completed. | |
Following the two calculations, the individual bond lengths and bond angles were tabulated in Table 3.
It is to note that even though the calculated bond distances and angles are similar to 2 decimal places (or 1 decimal place for bond angles), the values differ slightly at higher accuracy. In general, the bond lengths for BH3 calculated using the 3-21G basis set are longer than that calculated using the 6-31G(d,p) basis set. In addition, the bond angles deviate greater from the average value of 120 ° for the BH3 molecule optimised using the 3-21G basis set (see both .log for exact calculated values). This would therefore illustrate that the 6-31G(d,p) basis set would give more accurate results than the 3-21G basis set.
Using pseudo-potentials for larger molecules
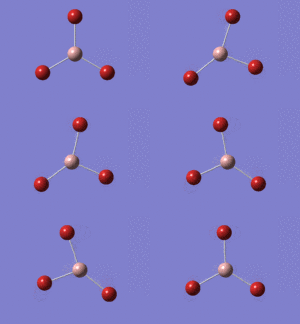
The calculation of properties using basis sets has its limitations for larger atoms with more electrons. Larger basis sets can be used but it is an expensive way for calculating these properties. One other alternative would be to use pseudo-potentials which considers only the valence electrons of the heavy atom and approximate the rest of the electrons by treating it as a single function. Here in this section, the use of pseudo-potential is being explored with the molecule GaBr3. The molecule was built on GaussView and optimised using the LanL2DZ pseudo-potential via the High Performance Computer (HPC) on the college server. The results were summarised below.
| File Type | .log |
| Calculation Type | FOPT |
| Basis Set | LanL2DZ |
| Final Energy (au) | -41.70082783 |
| Gradient | 0.00000016 |
| Dipole Moment (Debye) | 0.0000 |
| Point Group | D3h |
| Calculation time taken | 27.8 s |
Item Value Threshold Converged? Maximum Force 0.000000 0.000450 YES RMS Force 0.000000 0.000300 YES Maximum Displacement 0.000003 0.001800 YES RMS Displacement 0.000002 0.001200 YES Predicted change in Energy=-1.282691D-12 Optimization completed. | |
Following the calculations, the bond length and bond angles obtained were tabulated below.
The literature reported bond length of Ga-Br is 2.3525 Å[1]. This shows that the computed value does not deviate significantly from the literature value and is in fact close in agreement. The bond angle was computed to be exactly 120.0 ° as the symmetry is restricted to a D3h symmetry and hence would adopt a bond angle of 120.0 °. Therefore this showed that the use of approximate calculations involving pseudo-potentials will still be able to give an accurate estimate of basic properties of large molecules.
A combination of both basis sets and pseudo-potentials
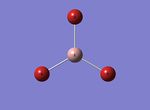
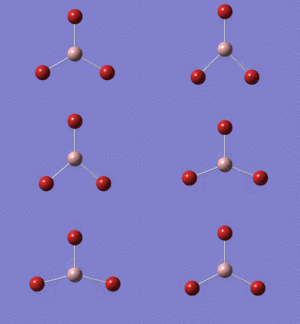
Whilst the use of basis set gives a reasonably accurate result on molecules with small atoms and the pseudo-potential gives a good estimation of calculations of molecules with larger, heavier atoms, the combination of basis set and pseudo-potential calculation can be carried out on one molecule with a mixture of both small and large atoms. In the case of BBr3, a 6-31G(d,p) calculation can be carried out on the B atom where as a LanL2DZ pseudo-potential calculation can be carried out on the heavier Br atoms. It was similarly built on GaussView and sent for calculation on the HPC with the basis sets and pseudo-potential specified. The results were tabulated below.
| File Type | .log |
| Calculation Type | FOPT |
| Basis Set | Gen |
| Final Energy (au) | -64.43644904 |
| Gradient | 0.00000962 |
| Dipole Moment (Debye) | 0.0003 |
| Point Group | Cs |
| Calculation time taken | 39.4 s |
Item Value Threshold Converged? Maximum Force 0.000017 0.000450 YES RMS Force 0.000010 0.000300 YES Maximum Displacement 0.000107 0.001800 YES RMS Displacement 0.000062 0.001200 YES Predicted change in Energy=-2.170128D-09 Optimization completed. | |
The following bond distance and angles from the optimised structures were tabulated below.
Structural analysis of various compounds
From the above sections, the average computed bond lengths of various bonds is summarised below.
| Bond | Bond length (Å) |
|---|---|
| B-H | 1.19 |
| Ga-Br | 2.35 |
| B-Br | 1.93 |
When comparing the bond lengths of B-H and B-Br, the effects of changing the ligands can be observed. When the ligand was changed from H to Br, the bond length lengthened from 1.19 Å to 1.93 Å. This can be attributed to the fact that Br is a much larger atom than H, as such the valence orbitals of Br are much more diffuse and further from the nucleus in the 4th quantum shall, leading to a longer bond formed between B and Br. H however, has only 1 electron in the first quantum shell and hence the bond length is shorter as the valence electron is closer to the nucleus. In addition, some of the other differences include the atomic mass of the two atoms, where H has an atomic mass unit of 1 but that of Br is 79.9.
The electronegativity of the two elements also differ. Br is more electronegative than H. This will lead to difference in the dipole moments when bonded with B. A B-H bond has a smaller electronegativity difference between B and H whereas B-Br have a larger electronegativity difference between the two elements. As a result the B-Br has a larger dipole moment than a B-H bond. Also, while H only has 1 valence electron, Br has 7 valence electrons. However, it is to note that both H and Br form a single bond with B as they only require 1 electron to achieve the stable electronic configuration. In addition, the resultant polarity of the two molecule are the same as they adopt a D3h symmetry and thus all the dipole moments within the molecule will cancel out despite B-H and B-Br having different dipole moments.
By comparing the bond lengths of Ga-Br and B-Br, it is also apparent that when changing to a larger central atom, the bond length increases as well. The Ga-Br bond is longer than the B-Br bond (2.35 Å as compared to 1.93 Å) as Ga is larger than B. The same argument which accounted for the increase in bond length when the ligands changed from H to Br can be applied for the central atom as well; bond length increased as the central atom was changed from B to Ga because Ga is a larger atom with its valence shell further away from the nucleus. As bonding occurs at the valence shell, having a quantum shell further away from the nucleus (for Ga) would lead to a longer bond length. While B is on the 2nd period of the periodic table, Ga is on the 4th period of the periodic table. As a result, Ga is much heavier and larger than B. While both elements belong to Group 13, as with the ligands, the electronegativity of the two elements also differ. As Ga is in the 4th period of the periodic table, it has a lower electronegativity compared to B, which will thus affect the individual dipole moments when bonded with Br. The B-Br bond has a lower electronegative difference between the atoms than that of the Ga-Br bond.
In GaussView where the molecules are built, sometimes the bonds does not show even when a bond between two atoms is expected. This is merely because the bond length exceeds a certain pre-defined value in the software and hence it does not draw a line between the two atoms to connect it as a bond. The bond in the software simply conveys a message to users that there is a covalent interaction between the two atoms at the given distance, beyond the pre-defined distance, the software might not recognise it as a covalent interaction, but it does not mean in reality that there is no bond or interaction.
A bond is a force that brings two atoms together. However, a bond is not always depicted by a line. Conventionally, the line that connects the two atoms together is defined to be a covalent bond; a line between the two atoms signify that one electron from each atom is shared in the bonding of the two atoms connected by the line. GaussView might have defined the bond (by means of drawing a line between the two atoms) to be a covalent bond. However there are in fact various types of bonds that exists. Of which only a covalent bond is represented by a line connecting the two atoms. One example of a bond that cannot be represented by a line would be the metallic bond within a metal (eg. Cu). The metallic bonding within a metal is defined to be an array of cationic metal amongst a sea of electrons. Drawing a line between the electron and the cationic metal would not accurately represent the metallic bonding as the line is defined to be a covalent bond where electrons are shared between two atoms, and an electron is not an atom.
There are other forms of bonding as well such as ionic bond, defined as the electrostatic forces between two oppositely charged ions. This bond involves the complete transfer of electrons from one atom to another and no sharing is involved, hence it is also not an accurate depiction by drawing a line between the two ions. Another type of bond would be hydrogen bonding. As hydrogen bonding occurs between a hydrogen directly bonded to a highly electronegative atom (N, O or F) and an electronegative atom, it is a weak interaction where the strength of the bond lies in between a covalent bond and van der Waals forces of attraction. As such, drawing a solid line to indicate such attractive force is not accurate. In fact, it is often depicted by a dotted line to show that it is a weaker form of interaction than covalent bond.
Year 3 Inorganic Computational Part 2
With the ability to perform basic optimisation on various types of molecules with the use of various basis sets and also the ability to find out basic properties of the molecules such as bond lengths and bond angles, more complex calculations can be done.
Frequency analysis
In this section, frequency analysis was carried on different molecules by means of a frequency calculation on Gaussian. A simulated IR spectrum of the computed molecule can also be generated. Similar to previous section, frequency analysis were carried out on various compounds and were compared against each other.
BH3 Frequency analysis
A frequency analysis was first done on the BH3 molecule. The molecule was reoptimised by confining it to the D3h symmetry to provide low frequency values that are closer to the tolerance range of 0 ± 15 cm-1. The molecule was built on GaussView and both the optimisation and the frequency analysis was done using the 6-31G(d,p) basis set, with calculations performed on Gaussian. The table below is a summary of the calculations, together with the required excerpts from the .log files.
| Optimisation | Frequency Calculation | |
|---|---|---|
| File Type | .log | .log |
| Calculation Type | FOPT | Freq |
| Basis Set | 6-31G(d,p) | 6-31G(d,p) |
| Final Energy (au) | -26.61532363 | -26.61532363 |
| Gradient | 0.00000296 | 0.00000291 |
| Dipole Moment (Debye) | 0.0000 | 0.0000 |
| Point Group | D3h | D3h |
| Calculation time taken | 5.0 s | 6.0 s |
Item Value Threshold Converged? Maximum Force 0.000006 0.000450 YES RMS Force 0.000004 0.000300 YES Maximum Displacement 0.000023 0.001800 YES RMS Displacement 0.000015 0.001200 YES Predicted change in Energy=-2.008834D-10 Optimization completed. |
Item Value Threshold Converged? Maximum Force 0.000006 0.000450 YES RMS Force 0.000003 0.000300 YES Maximum Displacement 0.000023 0.001800 YES RMS Displacement 0.000011 0.001200 YES Predicted change in Energy=-1.996524D-10 Optimization completed. |
Following the frequency analysis, the different vibrational modes of the molecule were tabulated and summarised in Table 10.
From here, it can be seen that there are 6 different vibrational modes for BH3. This would correspond to the theory that a molecule would have 3N-6 vibrational modes for a non-linear molecule and 3N-5 vibrational modes for linear molecules, where N is the number of atoms in the molecule. Here for BH3, N=4 and therefore would work out to have 6 vibrational modes which agrees with the Gaussian-computed results. A computed IR spectrum was also generated (Fig. 1).
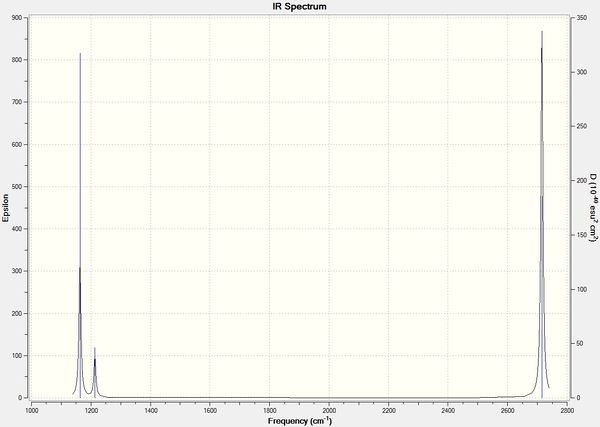
Figure 1: Simulated IR spectrum of BH3
From Table 10, it shows that there are 6 vibrational modes. However from the IR spectrum, only 3 different peaks were observed. This is due to 2 factors, the first being that the vibrational frequency at 2582 cm-1 is not IR active and hence does not show up on the IR spectrum. IR spectroscopy only captures vibrational mode that have a resultant dipole moment. Due to the symmetrical stretching of the B-H bonds, the dipole moments cancel out each other and hence the resultant dipole moment is zero (as illustrated by the zero intensity on Table 10). Therefore this peak is not observed.
Another reason would be due to degeneracy in the vibrational modes. As shown in the table, there are two vibrational modes with the same frequency at 1213 cm-1 and another two at 2715 cm-1. Therefore only 2 peaks reflect the 4 vibrational modes mentioned and hence, reducing the number of peaks observed on the spectrum.
GaBr3 Frequency analysis
A similar frequency analysis was carried out for the GaBr3 molecule. With the molecule already optimised as a D3h molecule, a frequency calculation was done via the HPC and the different vibrational modes tabulated below in Table 11. The same LanL2DZ basis set used to optimise the molecule was used to carry out the frequency analysis.
| File Type | .log |
| Calculation Type | Freq |
| Basis Set | LanL2DZ |
| Final Energy (au) | -41.70082783 |
| Gradient | 0.00000011 |
| Dipole Moment (Debye) | 0.0000 |
| Point Group | D3h |
| Calculation time taken | 16.8 s |
Item Value Threshold Converged? Maximum Force 0.000000 0.000450 YES RMS Force 0.000000 0.000300 YES Maximum Displacement 0.000002 0.001800 YES RMS Displacement 0.000001 0.001200 YES Predicted change in Energy=-6.142862D-13 Optimization completed. | |
The different vibrational modes were also tabulated below.
As both BH3 and GaBr3 have the same number of atoms and have the same shape, it is clear that there are also 6 vibrational modes for GaBr3. In addition, the simulated IR spectrum is also generated in the following figure.
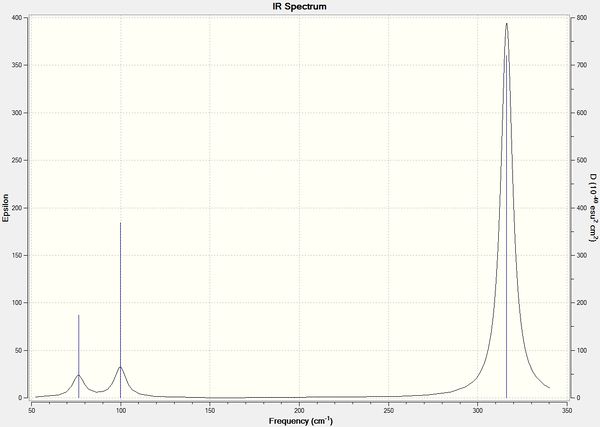
Figure 2: Simulated IR Spectrum of GaBr3
Again, the simulated spectrum only shows 3 peaks for 6 vibrational modes. This is due to the same reasons as mentioned above for BH3, where the symmetrical stretch of Ga-Br bonds (No. 4) is not active by IR spectroscopy and there are 2 degenerate pairs of vibrational modes (No. 1/2 and No. 5/6).
Comparison of results between BH3 and GaBr3
A comparison of the vibrational modes of the two molecules can also be made. A comparison table was done and summarised below (Table 13).
A significant difference between the vibrational modes of the two molecules would be the frequency and intensity of the vibrational modes of the two molecules. As the frequencies correspond to the energies of the vibrational modes, the large difference of the frequencies for the two molecules indicate that the vibrational energies of the two molecules differ greatly. With the bonds being treated as simple harmonic oscillators, the formula for energy in wavenumbers is given by:
Where E is energy in wavenumbers (cm-1), c is the speed of light, k is the spring constant and μ is the reduced mass. As the relative atomic mass of B and H are significantly smaller than that of Ga and Br, the reduced mass, μ is therefore smaller for BH3 and thus based on the formula, would lead to a higher energy value.
In addition, a reordering of vibrational modes was observed between the two molecules. The position of the first and third vibrational mode of BH3 have swapped around in GaBr3. Also, whilst the remaining vibrational modes retained their order, some of them have a slight modification to the type of vibrational mode they experience. The fifth vibrational modes of both molecules are similar due to the asymmetric stretching of the bonds. However, the one in GaBr3 is accompanied by a bending motion of the third Ga-Br bond which is not observed in BH3. Similarly the motions in the sixth vibrational mode of the two molecules are similar except that the symmetrical stretching of Ga-Br is accompanied by a scissoring motion of the bonds.
However, despite the differences, the resultant spectra were fairly similar. Both spectra had 3 observed peaks out of the possible 6 due to one of them being inactive on the IR spectra and the other two being degenerate vibrational modes. It also noticeable that the vibrational modes of both molecules are categorised into two distinct region; the higher energy region comprises of 2 vibrational mode with the E symmetry and an A1' symmetry whereas the lower energy region comprises of 2 vibrational mode with the E symmetry and A2" symmetry. The lower energy region corresponds to vibrational modes related to just the bending motion whereas the higher energy region corresponds to either stretching or a combination of stretching and bending motion. This shows that stretching is higher in energy compared to bending.
When a molecule is being optimised, the method used provides the type of approximation made in solving the Schrodinger equation. The basis set would then provide the degree of accuracy for which this approximation is made. The optimisation would then be carried out whereby the energy and electron density is calculated for every possible position of the nuclei until the lowest possible energy is achieved (ie. a potential energy surface is generated). What the frequency analysis does next would be to calculate the curvature of the potential energy surface to determine if it is a minimum or maximum. Thus the frequency analysis is the second derivative of the function. If the result of the analysis is negative, we have a transition state and if it is positive, it is a minimum. Therefore it is necessary for the optimisation and frequency analysis to use the same method and basis set as the frequency analysis works on the potential energy surface generated by the optimisation step. Using a different method and basis set for the frequency analysis is akin to getting the second derivative of a completely different function and thus lead to an inaccurate result.
A frequency analysis is required in order to find out if the energy obtained in the optimisation step is a minimum. During the optimisation step, an energy value corresponding to the molecule was obtained. However, it does not indicate if that energy obtained was a minimum or maximum. A minimum would indicate that the molecule is in the ground state, whereas a maximum would indicate a high energy state such as a transition state. Therefore a frequency analysis is always carried out to find out if the energy obtained is a minimum, which is the state that is required in this assignment.
A molecule of N atoms would have 3N vibrational modes. However, 6 of the vibrational modes (for non-linear molecules) would correspond to a resultant translational or rotational motion in each of the 3 Cartesian axes. Hence they do not contribute to the vibrational mode and therefore the resultant number of vibrational mode for a molecule with N atoms is corrected to 3N-6. The low frequencies would thus correspond to the 3 rotational and 3 translational motion that arose from the vibrational modes.
Molecular orbital of BH3
In addition to a frequency analysis of the molecule, a population analysis can be carried out. With a population analysis, the molecular orbitals can be computed and visualised on GaussView. This would allow a qualitative comparison with the approximate MOs that were qualitatively drawn up via a MO diagram. This population analysis was carried out on BH3. With the optimised structure of the BH3 derived from the frequency analysis, the molecule was sent for population analysis via the HPC.
| File Type | .log |
| Calculation Type | SP |
| Basis Set | 6-31G(d,p) |
| Final Energy (au) | -26.61532363 |
| Gradient | 0.00000000 |
| Dipole Moment (Debye) | 0.0000 |
| Point Group | D3h |
| Calculation time taken | 17.0 s |
The MO diagram was reproduced and the computed MOs were positioned next to the qualitatively-derived MOs from the MO diagram.
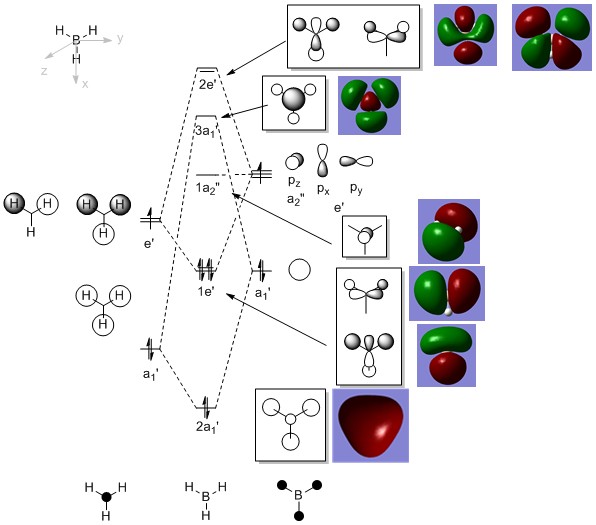
Figure 3: MO diagram of BH3 with the computed MOs.
From the MO diagram above together with the computed MOs, it can be seen that the MOs derived qualitatively from MO diagrams are very similar to that of the computed MOs. While the MO diagram-derived MOs are superimposed fragment orbitals, the computed MOs showed the "resultant" of the superimposed fragments orbitals. Features such as through-space interaction between orbital lobes of the same phase were shown to have interaction on the computed MOs, while interaction between orbitals of opposite phase were shown to have a node between them. This has therefore shown the usefulness of the qualitative MO theory as it is able to agree with computational results supported by calculations.
Analysis of NH3
Following the analysis carried out on BH3, a similar series of analysis can be conducted on other small molecules. NH3 was chosen as the molecule of interest. The sequence of optimisation, frequency and population analysis were carried out with a consistent basis set. In addition, a Natural Bonding Orbital (NBO) analysis was carried out on NH3.
Optimisation and frequency analysis
The optimisation of NH3 was carried out using the 6-31G(d,p) basis set before a frequency calculation was being down. The molecule was built on GaussView and calculations performed on Gaussian. The result summary of the reaction was tabulated in the table below.
| Optimisation | Frequency Calculation | |
|---|---|---|
| File Type | .log | .log |
| Calculation Type | FOPT | Freq |
| Basis Set | 6-31G(d,p) | 6-31G(d,p) |
| Final Energy (au) | -56.55776872 | -56.55776872 |
| Gradient | 0.00000095 | 0.00000095 |
| Dipole Moment (Debye) | 1.8465 | 1.8465 |
| Point Group | C1 | C1 |
| Calculation time taken | 15.0 s | 9.0 s |
| .log files | Item Value Threshold Converged? Maximum Force 0.000002 0.000015 YES RMS Force 0.000001 0.000010 YES Maximum Displacement 0.000005 0.000060 YES RMS Displacement 0.000003 0.000040 YES Predicted change in Energy=-9.687922D-12 Optimization completed. |
Item Value Threshold Converged? Maximum Force 0.000002 0.000450 YES RMS Force 0.000001 0.000300 YES Maximum Displacement 0.000005 0.001800 YES RMS Displacement 0.000002 0.001200 YES Predicted change in Energy=-1.088014D-11 Optimization completed. |
Low frequencies --- -6.5478 -4.7624 -0.0006 0.0009 0.0018 1.3376 Low frequencies --- 1089.3505 1693.9257 1693.9298 |
Population analysis
Finally, similar to BH3, a population analysis was carried out. The optimised structure calculated from the frequency analysis was used to generate the calculated results. Results of the calculation can be obtained here
Charge distribution of NH3
From the population analysis, a NBO analysis can be carried out as well. This is done by looking at the charge distribution within the molecule itself. The charge distribution of the molecule is characterised by the colours on each individual atoms as well as the relative charge numbers shown on the atom (Fig. 4).
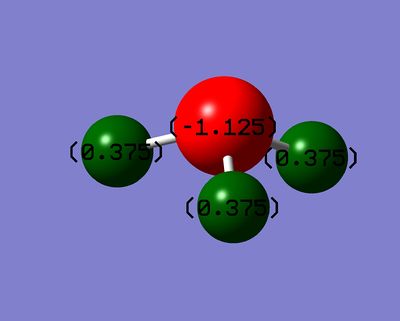
Figure 4: Charge distribution of NH3
The charge distribution is represented by a colour spectrum ranging from red to green, where red indicates a region of high charge density and green indicating a region of low density. Here it can be seen that N is red in colour, whereas the H atoms are green in colour. Corresponding to theory, N is highly electronegative as compared to H and therefore would have a high electron density. Therefore the NBO analysis showed that it is in agreement with theory. The numbers on the atoms show the charge range. In this diagram, the charge ranges from a value of -1.125 to 1.125, where -1.125 indicate a region of high electron density and the opposite end correspond to a region of low electron density.
Calculation of NH3BH3
In the final study, an analysis the adduct NH3BH3 was made. By carrying out the same series of analysis, the association energy between NH3 and BH3 can be derived. The steps for which they are derived will be elaborated further below.
Optimisation and frequency analysis
The adduct was first built on GaussView and then optimised via the 6-31G(d,p) basis set on Gaussian. After which a frequency analysis was carried out using the same basis set. The final results of the two calculations were tabulated below.
| Optimisation | Frequency Calculation | |
|---|---|---|
| File Type | .log | .log |
| Calculation Type | FOPT | Freq |
| Basis Set | 6-31G(d,p) | 6-31G(d,p) |
| Final Energy (au) | -83.22468911 | -83.22468911 |
| Gradient | 0.00000125 | 0.00000134 |
| Dipole Moment (Debye) | 5.5647 | 1.8465 |
| Point Group | C1 | C1 |
| Calculation time taken | 1 min 2.0 s | 32.0 s |
| .log files | Item Value Threshold Converged? Maximum Force 0.000002 0.000015 YES RMS Force 0.000001 0.000010 YES Maximum Displacement 0.000023 0.000060 YES RMS Displacement 0.000010 0.000040 YES Predicted change in Energy=-8.987776D-11 Optimization completed. |
Item Value Threshold Converged? Maximum Force 0.000004 0.000450 YES RMS Force 0.000001 0.000300 YES Maximum Displacement 0.000022 0.001800 YES RMS Displacement 0.000010 0.001200 YES Predicted change in Energy=-1.151107D-10 Optimization completed. |
Low frequencies --- -3.2121 -2.7006 -0.0011 -0.0005 0.0008 3.6891 Low frequencies --- 263.3411 632.9623 638.4431 |
Association energy of NH3BH3
From the previous calculations, the energies were obtained to derive the association energy as shown below.
| E(NH3) = -56.55776872
E(BH3) = -26.61532363
|
The difference in energy ΔE is given by E(NH3BH3) - [E(BH3)+E(NH3)]. However, the value given above is in Hartree. Upon conversion to kJ/mol, the energy difference is 135.47 kJ/mol. This would correspond to a typical weak single bond which may indicate that such bond association (dative bond) is actually a weaker type of bond as both electrons come from one atom. One possible explanation for the weaker bond would be the fact that N is a highly electronegative atom, and thus the electrons would still prefer to be closer to N and hence giving rise to a lower bond strength.
References
- ↑ CRC Handbook of Chemistry and Physics, ed. D. R. Lide, CRC Press, Boca Raton, 87th edn., 2006.

