Rep:Mod:js1007inorg
Module: 2 Bonding (Ab initio and density functional molecular orbital)
Optimising a molecule of BH3

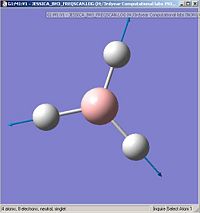
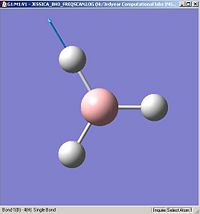
GaussView 5 was used to determine the optimium position of the nuclei in a molecule of BH3. To do this the molecule was first drawn and the three B-H bonds all set to 1.50A each. Using the Gaussian Calculation Setup a .gjf input file was then created for the optimisation of this molecule. The top line of the input file is shown below. It details the settings chosen for this optimisation.
# opt freq b3lyp/3-21g geom=connectivity
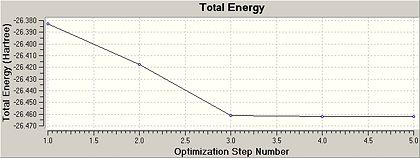
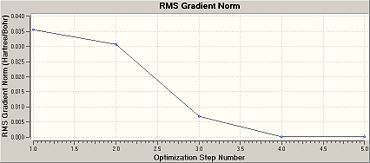
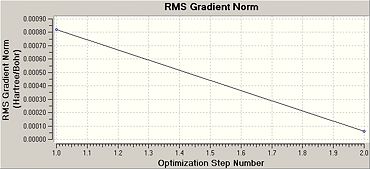
Once this calculation had finished running the optimised B-H bond length was 1.19A and the H-B-H bond angle was 120.0o. Figure 1b shows the summary table for this optimisation. This gives general information about the calculation. Figures. 1c and 1d are graphs showing how the total energy of BH3 and the gradient of the PES for this molecule changes during the optimisation.
Optimising a molecule of BCl3

GaussView 5 was also used to determine the optimium position of the nuclei in a molecule of BCl3. BCl3 was drawn in GaussView and its point group symmetry set to D3h using the Edit, Point Group symmetry tab. In much the same way as for the optimisation of BH3, a .gjf input file was created for the optimisation of this molecule. The top line of the input file is shown below.
# opt b3lyp/lanl2mb geom=connectivity
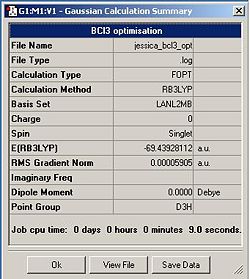
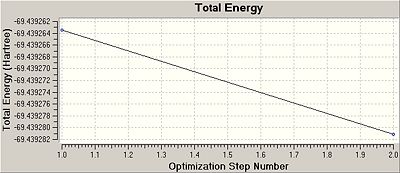
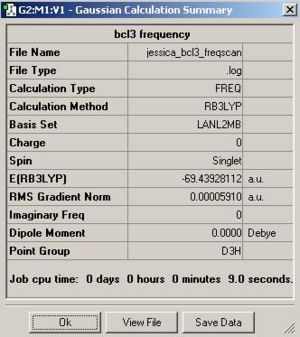
Once this calculation had finished running the optimised B-Cl bond length was 1.87A and the Cl-B-Cl bond angle was 120.0o. Figure. 1f shows the summary table for this optimisation. Figures. 1g and 1h are graphs showing how the total energy and the gradient of the PES for BCl3 changes during the optimisation.
Molecular orbitals of BH3
GaussView 5 can be used to look at the electronic structure of a molecule and help visualise its molecular orbitals. Using the optimised molecule of BH3 a .gjf input file was created to show its molecular orbitals. The top line of this file is shown below.
# b3lyp/3-21g pop=(nbo,full) geom=connectivity
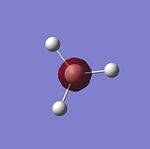
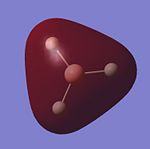
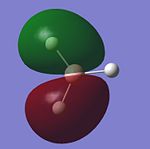
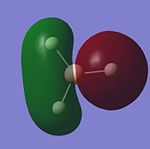
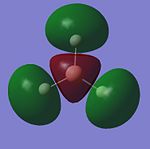
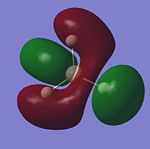
Once this calculation had finished running the DOI for the output file could be obtained. This DOI is DOI:10042/to-3758 . Figure. 1i shows the first 8 molecular orbitals of BH3.
 |
 |
 |
 |
 |
 |
 |
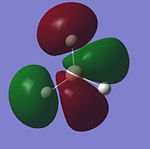 |
The MO diagram below for trigonal planar D3h BH3 was created on Chemdraw Pro. Any differences between the LCAO representation and real/computer generated representation of the molecular orbitals are noted on the diagram. From this comparison of the two representations it is clear that the real/computer generated representaion is far better. This is because it allows you to visualise molecular orbitals in 3 dimentions and shows how orbitals in the same phase can mix/overlap.

NBO analysis of BH3
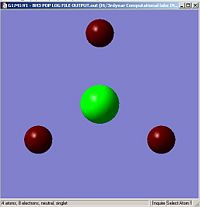
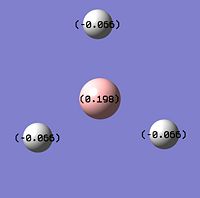
GaussView5 can be used to carry out Natural Bond Orbital analysis (NBO). Using the .log output file from the molecular orbital calculations carried out above, NBO analysis was used to find out how charge is distributed in BH3. Figures. 1i and 1j are different was of representing this information about charge distribution. Figure. 1i which shows atomic charge by colour tells us that the boron atom is positvely charged and the three hydrogen atoms are negatively charged. Figure. 1j which shows atomic charge by number tells us the exact value of these charges.
 |
 |
The table below gives information about the bonding in BH3. It shows that the boron has formed three sp2 hybridised orbitals each with 33.33% s orbital character and 66.67% p orbital character.
    (Occupancy)   Bond orbital/ Coefficients/ Hybrids
---------------------------------------------------------------------------------
    1. (1.98096) BD ( 1) B   1 - H   2
               ( 46.65%)   0.6830* B   1 s( 33.33%)p 2.00( 66.67%)
                                           0.0000  0.5774  0.0000  0.0000  0.0000
                                           0.8165  0.0000  0.0000  0.0000
               ( 53.35%)   0.7304* H   2 s(100.00%)
                                           1.0000  0.0005
    2. (1.98096) BD ( 1) B   1 - H   3
               ( 46.65%)   0.6830* B   1 s( 33.33%)p 2.00( 66.67%)
                                           0.0000  0.5774  0.0000  0.7071  0.0000
                                          -0.4082  0.0000  0.0000  0.0000
               ( 53.35%)   0.7304* H   3 s(100.00%)
                                           1.0000  0.0005
    3. (1.98096) BD ( 1) B   1 - H   4
               ( 46.65%)   0.6830* B   1 s( 33.33%)p 2.00( 66.67%)
                                           0.0000  0.5774  0.0000 -0.7071  0.0000
                                          -0.4082  0.0000  0.0000  0.0000
               ( 53.35%)   0.7304* H   4 s(100.00%)
                                           1.0000  0.0005
    4. (1.99962) CR ( 1) B   1           s(100.00%)
                                           1.0000  0.0000  0.0000  0.0000  0.0000
                                           0.0000  0.0000  0.0000  0.0000
The table below gives information about the energy of the molecular orbitals in BH3. It shows that orbital 8 which has an energy of -0.08 a.u. is the lowest unoccupied molecular orbital.
                                                           Principal Delocalizations
          NBO                        Occupancy    Energy   (geminal,vicinal,remote)
====================================================================================
Molecular unit  1  (H3B)
    1. BD (   1) B   1 - H   2          1.98096    -0.38731  14(g),15(g)
    2. BD (   1) B   1 - H   3          1.98096    -0.38731  13(g),15(g)
    3. BD (   1) B   1 - H   4          1.98096    -0.38731  13(g),14(g)
    4. CR (   1) B   1                  1.99962    -6.76561  10(v),11(v),12(v)
    5. LP*(   1) B   1                  0.00000     0.74239
    6. RY*(   1) B   1                  0.00000     0.42448
    7. RY*(   2) B   1                  0.00000     0.42448
    8. RY*(   3) B   1                  0.00000    -0.08090
    9. RY*(   4) B   1                  0.00000     0.43039
   10. RY*(   1) H   2                  0.00013     0.94934
   11. RY*(   1) H   3                  0.00013     0.94934
   12. RY*(   1) H   4                  0.00013     0.94934
   13. BD*(   1) B   1 - H   2          0.01903     0.12590
   14. BD*(   1) B   1 - H   3          0.01903     0.12590
   15. BD*(   1) B   1 - H   4          0.01903     0.12590
Vibrational analysis and confirming minima BH3
In the corresponding section above, BH3 was optimised to what was thought to be its lowest energy configuration. To confirm that this was indeed the case, frequency analysis was carried out on this optimised structure. Frequency analysis looks at the second derivative of the PES and determines from that whether or not the structure has been optimised correctly. The top line of the .gjf input file for the frequency analysis of BH3 is shown below.
# freq b3lyp/3-21g geom=connectivity pop=(full,nbo)
Low frequencies ---   -0.0091   -0.0059   -0.0032  810.5594  810.6777  810.6777
Low frequencies ---  997.6656 1052.4621 1052.4645
Diagonal vibrational polarizability:
       3.6272692       3.6268749       0.8004548
Harmonic frequencies (cm**-1), IR intensities (KM/Mole), Raman scattering
activities (A**4/AMU), depolarization ratios for plane and unpolarized
incident light, reduced masses (AMU), force constants (mDyne/A),
and normal coordinates:
                    1                      2                      3
                   A1'                    E'                     E'
Frequencies --   997.6656              1052.4621              1052.4645
Red. masses --     1.0078                 1.1126                 1.1126
Frc consts  --     0.5910                 0.7261                 0.7261
IR Inten    --     0.0000               118.4704               118.4559
 Atom  AN      X      Y      Z        X      Y      Z        X      Y      Z
    1   5     0.00   0.00   0.00     0.10   0.00   0.00     0.00   0.10   0.00
    2   1     0.00   0.58   0.00     0.06   0.00   0.00     0.00  -0.81   0.00
    3   1     0.50  -0.29   0.00    -0.59   0.38   0.00     0.38  -0.15   0.00
    4   1    -0.50  -0.29   0.00    -0.59  -0.38   0.00    -0.38  -0.15   0.00
                    4                      5                      6
                   E'                     E'                     A2"
Frequencies --  1212.7284              1212.7287              1230.3369
Red. masses --     1.1218                 1.1218                 1.2531
Frc consts  --     0.9720                 0.9720                 1.1176
IR Inten    --    40.9321                40.9338                45.0248
 Atom  AN      X      Y      Z        X      Y      Z        X      Y      Z
    1   5     0.00   0.11   0.00     0.11   0.00   0.00     0.00   0.00   0.16
    2   1     0.00   0.03   0.00    -0.81   0.00   0.00     0.00   0.00  -0.57
    3   1    -0.37  -0.60   0.00    -0.18  -0.37   0.00     0.00   0.00  -0.57
    4   1     0.37  -0.60   0.00    -0.18   0.37   0.00     0.00   0.00  -0.57
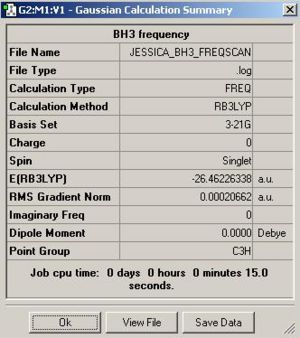
Figure. 1k shows the summary table for this frequency analysis.
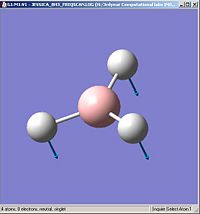
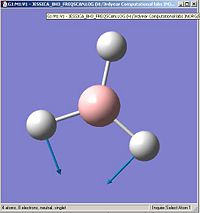
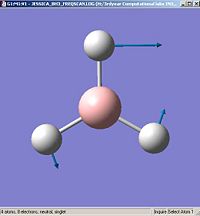
Frequency analysis also gives information about the vibrations of a molecule and can be used to predict a likely infra red spectrum for that molecule. The table below summarises the 6 vibrations of BH3.
Figure. 1m shows the IR spectrum of BH3 obtained from the frequency analysis. Oddly this spectrum does not have six peaks as expected (ie. one for each vibration). Instead only three peaks can be seen. There are two reasons for this, the first is that for the vibration with a frequency of 2598cm-1 the intensity is zero and so this vibration won't show up on the spectrum. The second is that vibrations number 2 and 3 and 5 and 6 have the same frequency; 1204cm-1 and 2737cm-1 respectively. This means that these vibrations will overlap.

Vibrational analysis and confirming minima BCl3
Frequency analysis was also used to confirm whether or not BCl3 had been optimised correctly earlier. The top line of the .gjf input file is shown below.
# freq b3lyp/lanl2mb geom=connectivity pop=(full,nbo)
Figure. 1n shows the summary table for this frequency analysis.
| Form of the vibration | Frequency / (cm-1) | Intensity |
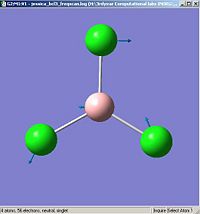 |
214 | 4 |
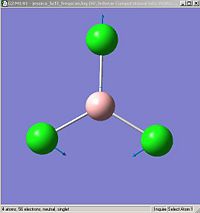 |
214 | 4 |
 |
377 | 44 |
 |
417 | 0 |
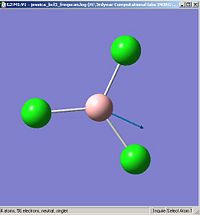 |
939 | 259 |
 |
939 | 259 |
Figure. 1p shows the infrared spectrum of BCl3 obtained from the frequency analysis.

Isomers of Mo(CO)4L2
GaussView 5 was used to determine the optimimum position of the nuclei in the cis and trans isomers of Mo(CO)4(PCl3)2. The top line of the .gjf input file for this optimisation is shown below.
# opt=loose b3lyp/lanl2mb geom=connectivity
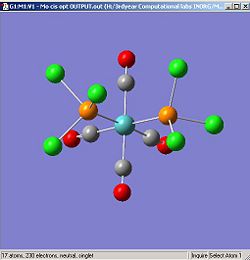
Figures.1q and 1r show the optimised isomers.
 |
 |
DOI for optimised cis isomer DOI:10042/to-3976 . DOI for optimsed trans isomer DOI:10042/to-3977 .
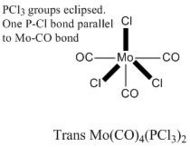
It is known that if you do not start the optimisation of these isomers with the right orientation of the (PCl3)2 ligands then you will not get the true lowest energy structure. This is because the (PCl3)2 ligands can freely rotate. The optimisation of the cis and trans isomers was carried out again but this time starting with the isomers as drawn below. The top line of the .gjf input file for this second optimisation is also shown below.
# opt b3lyp/lanl2dz geom=connectivity int=ultrafine scf=conver=9 |
 |
 |
Figures. 1s and 1t show the optimised isomers starting with the (PCl3)2 ligands in the right orientation.
 |
 |
DOI for cis isomer when optimisation started with (PCl3)2 ligands in right orientation DOI:10042/to-3784 . DOI for trans isomer when optimisation started with (PCl3)2 ligands in right orientation DOI:10042/to-3785 .
To confirm that this optimisation did indeed give the true lowest energy structure of the two isomers, frequency analysis was carried out. The top line of the . gjf input file for this is shown below.
# freq b3lyp/lanl2dz geom=connectivity int=ultrafine scf=conver=9
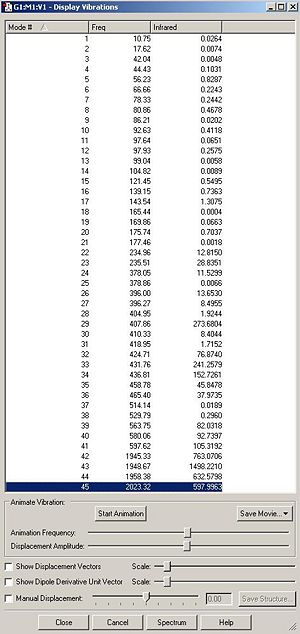
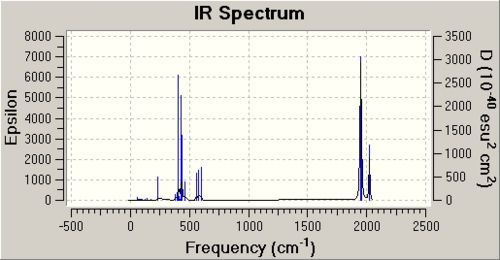
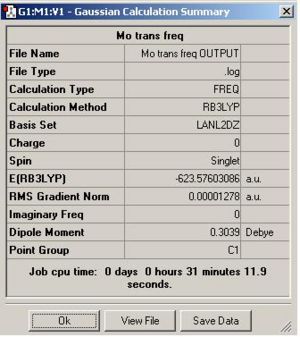
DOI for frequency analysis of cis isomer DOI:10042/to-3786 . DOI for frequency analysis of trans isomer DOI:10042/to-3787 . Below is the summary table for the frequency analysis carried out on each isomer along with a table of the vibrations and the IR spectra.
 |
 |
 |
 |
 |
 |
From looking at the summary tables it is clear that the cis isomer is the most stable isomer with a total energy of -623.58 a.u. The trans isomer has a total energy of -623.57 a.u. The energy difference between the two isomers is 2.7kJ/mol. This is only a very small difference. The main reason that the cis isomer is more stable is due to the orientation of the C=O ligands. These ligands are better orienated in the cis isomer for backbonding to empty metal orbitals of the correct symmetry. It is unexpected that the cis isomer is slightly more stable than the trans isomer because in the cis isomer the PCl3 groups are closer to each other than they are in the trans isomer. I would expect this steric clash to lower the energy of the cis isomer.
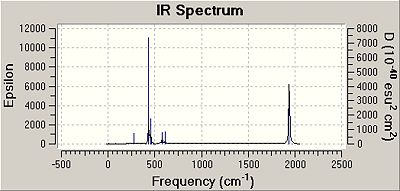
One way to make the trans isomer more stable would be to make the ligand L=PR3 much more bulky as this would increase the steric clash between the two PR3 ligands in the cis isomer, ultimately lowering its energy. There are four C=O stretches observed in the IR spectrum of the cis isomer and two in the IR spectrum of the trans isomer as shown in the table below. The reason why only two C=O stretches are observed in the trans isomer spectra is because due to the symmetry of the molecule.
| Carbonyl stretches Cis isomer | ' | Carbonyl stretches Trans isomer | ' |
| Frequency / (cm-1) | Intensity | Frequency / (cm-1) | Intensity |
| 1945 | 763 | 1950 | 1475 |
| 1949 | 1498 | 1951 | 1467 |
| 1958 | 633 | 1977 | 1 |
| 2023 | 598 | 2031 | 4 |
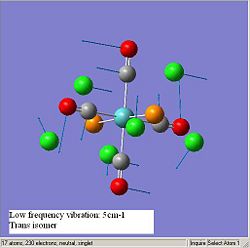
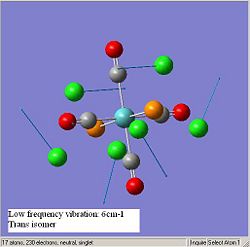
The diagrams below show the low frequency vibrations of the two isomers.
 |
 |
 |
Advanced(optional) work
The optimisation of the two Mo(CO)4(PCl3)2 isomers was carried out but this time accounting for its d atomic orbitals. The top line of the .gjf input file for this optimisation is shown below.
# opt b3lyp/lanl2dz geom=connectivity int=ultrafine scf=conver=9 extrabasis
The bottom line of this .gjf file is also shown below.
P 0
D 1 1.0
0.55 0.100D+0.1
****
DOI for cis isomer:DOI:10042/to-3953 . DOI for trans isomer:DOI:10042/to-3954 The top and bottom line of the .gjf input file for the frequency analysis of the two isomers is also shown below.
# freq b3lyp/lanl2dz geom=connectivity extrabasis int=ultrafine scf=conver=9
P 0
D 1 1.0
0.55 0.100D+0.1
****
DOI for cis isomer:DOI:10042/to-3955 . DOI for trans isomer:DOI:10042/to-3956 The IR spectra for the two isomers are shown below.
 |
 |
Mini project: Nb8
I have decided to base my mini project on niobium 8 clusters. I plan on investigating how charge effects the stability of the clusters. I will optimise a neutral, anionic (-1) and cationic (+) version of each cluster and carry out molecular orbital and NBO analysis to see how electron density changes with charge and how the charge is distributed across the clusters.
Optimising the Nb8 clusters
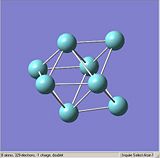
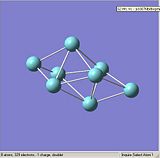
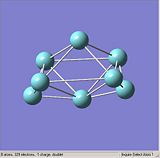
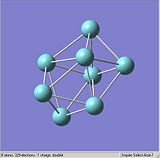
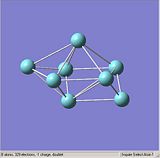
Figures. 1a to e show the niobium 8 clusters[1] that will be optimised. The symmetry of each cluster was set using the Edit, Point group symmetry tab. The table below shows the symmetry each cluster was set to. The bond lengths of each cluster were also altered so that they were closer to the stated literature values [2]. It was hoped that by starting each optimisation with a structure as close to the true geometry as possible, the calculations would take less time.
 |
 |
 |
 |
 |
|
Cluster A: DOI:10042/to-3798 Cluster B: DOI:10042/to-4077 Cluster C: DOI:10042/to-4078 Cluster D:DOI:10042/to-4079 Cluster E:DOI:10042/to-4080
The top line of the .gjf input file for the optimisation of each cluster is shown below. I think if I were to carry out this optimisation again I would maybe try using a lower level basis set, such a 3-21G before using LANL2MB just to make the starting structure slightly better.
# opt=loose b3lyp/lanl2mb geom=connectivity |
Analysis of the .log output files for each optimisation show that they were not all successful. For all but cluster A the optimisations failed. Below is part of the output file for cluster A which shows it had converged. This can be compared with the same part of the output file for cluster B which shows it had not converged.
        Item               Value     Threshold  Converged?
Maximum Force            0.000840     0.002500     YES
RMS     Force            0.000201     0.001667     YES
Maximum Displacement     0.008303     0.010000     YES
RMS     Displacement     0.001849     0.006667     YES
Predicted change in Energy=-1.798172D-05
Optimization completed.
   -- Stationary point found.
 Item               Value     Threshold  Converged?
Maximum Force            0.016134     0.002500     NO
RMS     Force            0.005338     0.001667     NO
Maximum Displacement     0.229448     0.010000     NO
RMS     Displacement     0.059874     0.006667     NO
Predicted change in Energy=-1.721148D-02
GradGradGradGradGradGradGradGradGradGradGradGradGradGradGradGradGradGrad
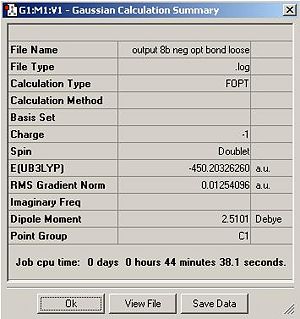
The summary tables for cluster A and cluster B can also be compared to show that cluster A was successfully optimised but cluster B was not. The gradient of the PES curve should be less than 0.001 if optimisation is successful. From looking at the summary tables it is clear that the gradient is greater than 0.001 for clusters B to E.
 |
 |
 |
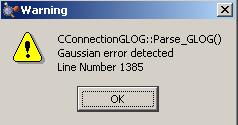
Another way I know the optimisation of clusters B to E was not successful is by looking at the bottom of the .log output file for each cluster. The bottom of each of these files is shown below. This tells me that there was an error with the spin contaminant and that the spin quantum number was wrong it should be an integer but in the example section below it is 2.2088. I would guess that the main reason why these optimisations failed was because they were unrestricted and so the structure was not restricted to a closed shell and it maybe should have been.
Annihilation of the first spin contaminant:
S**2 before annihilation     2.2088,   after     2.9335
Convergence failure -- run terminated.
Error termination via Lnk1e in /apps/gaussian/g09/g09/l502.exe at Fri Feb  5 21:19:23 2010.
Since the anionic form of cluster A was successfully optimised I decided to optimise the neutral form of the cluster. The DOI for this is given below. This optimisation was successful. Unfortunately I ran out of time and so was not able to optimise the cationic form of cluster A. DOI:10042/to-4076
Vibrational analysis and confirming minima of the Nb8 clusters
Frequency analysis was carried out to confirm that cluster A was successfully optimised and to also confirm cluster B was not. The top line of the .gjf input file for the frequency analysis calculations is shown below.
# freq b3lyp/lanl2mb geom=connectivity pop=(full,nbo) |
The DOI for these calculations are given below. Frequency analysis of anionic cluster A DOI:10042/to-4117 . Frequency analysis of neutral cluster A DOI:10042/to-4119 . Frequency analysis of anionic cluster B DOI:10042/to-4118 .
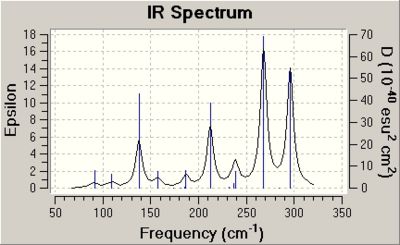
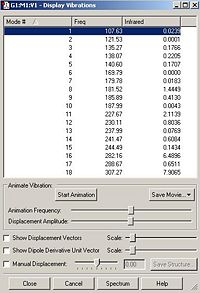
A section of the output file is shown below. The top line of this section 'low frequencies' shows that the optimisation was successful as all the frequencies are much lower than the first frequency.
Low frequencies ---   -4.1252    0.0000    0.0001    0.0001    4.6754    6.1198
Low frequencies ---   91.6234  108.9413  115.3930
Diagonal vibrational polarizability:
       3.7943016       4.0709167       0.5870158
Harmonic frequencies (cm**-1), IR intensities (KM/Mole), Raman scattering
activities (A**4/AMU), depolarization ratios for plane and unpolarized
incident light, reduced masses (AMU), force constants (mDyne/A),
and normal coordinates:
                    1                      2                      3
                    A                      A                      A
Frequencies --    91.6233               108.9412               115.3929
Red. masses --    92.9060                92.9060                92.9060
Frc consts  --     0.4595                 0.6496                 0.7289
IR Inten    --     0.1832                 0.1691                 0.0023
The same section of the output file for cluster B is shown below.
 Low frequencies ---  -85.2928  -65.7189  -33.8718  -19.7188    0.0000    0.0001
Low frequencies ---    0.0001   22.5539   33.2998
******    3 imaginary frequencies (negative Signs) ******
Diagonal vibrational polarizability:
      94.9166265       4.5350584      88.3900889
Harmonic frequencies (cm**-1), IR intensities (KM/Mole), Raman scattering
activities (A**4/AMU), depolarization ratios for plane and unpolarized
incident light, reduced masses (AMU), force constants (mDyne/A),
and normal coordinates:
                    1                      2                      3
                    A                      A                      A
Frequencies --   -85.1339               -65.1358               -12.4947
Red. masses --    92.9060                92.9060                92.9060
Frc consts  --     0.3967                 0.2322                 0.0085
IR Inten    --     2.5606                 4.3420                 0.7952
 |
 |
 |
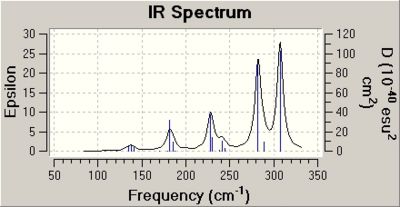 |
The table of vibrations for anionic cluster B shows some of the vibrations are negative. This is proof that the optimisation of this cluster had not worked.
 |
Molecular orbitals of the Nb8 clusters
The top line of the .gjf input file for molecular orbital analysis is shown below.
# ub3lyp/lanl2mb pop=(nbo,full) geom=connectivity
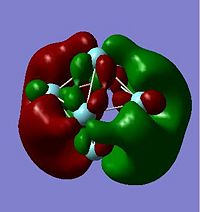
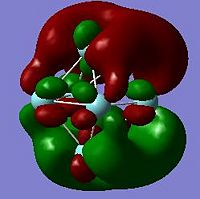
The HOMO and LUMO orbitals are shown below for the neutral and anionic versions of cluster A.
 |
 |
 |
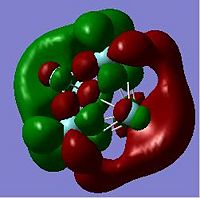 |
DOI for anionic cluster A DOI:10042/to-4120 DOI for neutral cluster A DOI:10042/to-4121
NBO analysis of the Nb8 clusters
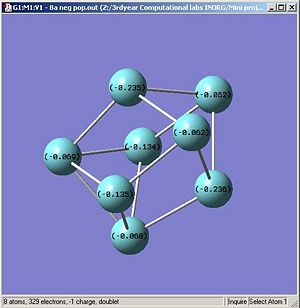
Using the .log output file from the molecular orbital calculations carried out above, NBO analysis was used to find out how charge is distributed in the anionic and neutral cluster. Figures. 1i and 1j are different ways of representing this information about charge distribution for the anionic form of cluster A. Figure. 1i which shows atomic charge by colour tells us that all the niobium atoms are negatively charged but some more so than others.
 |
 |
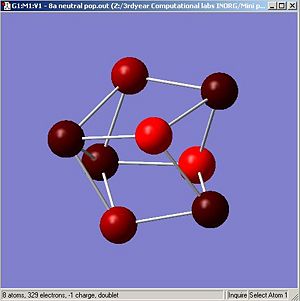
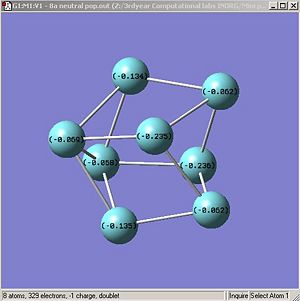
Figures. 1k and 1l are different ways of representing this information about charge distribution for the neutral form of cluster A.
 |
 |


