Rep:Mod:jp806inorganic
Module 2: Inorganic
Part 1: Experiments in Inorganic CompChem
The BH3 Molecule
A molecule of BH3 was defined using GaussView and then manipulated to give all bond lengths of 1.5 Å. The molecule was then optimised using the B3LYP method and the 3-21G basis set (aside 1). The optimised molecule had equal bond lengths of 1.19435Å and equal bond angles of 120.00o. The output file for this optimisation can be seen below along with a screen shot of the output summary.
BH3 | ||||
| Optimised Gaussian Output | Calculation Summary | |||
|

| |||
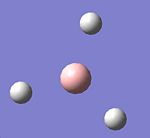
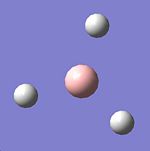
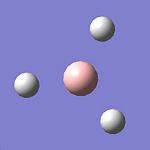
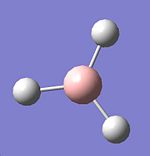
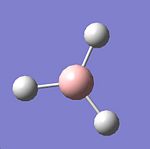
The optimisation of the BH3 was then analysed by opening the .log file with the "Read Intermediate Geometries" option checked. The table below shows the plot of total energy and energy gradient against optimisation step number as well as a visual representation of the molecule at each point in the optimisation.
Analysis of Optimisation | |||
| Optimisation Point | Total Energy Profile | RMS Gradient | Molecular Representation |
| 1 | 
|

|
|
| 2 | 
|

|
|
| 3 | 
|

|
|
| 4 | 
|

|
|
| 5 | 
|

|
|
It is clear that the optimisation runs until the energy gradient becomes approximately 0, this in turn shows that the optimisation runs until an energy constant is reached. During the optimisation process the molecules produced occasionally do not have any bonds shown, this is a facet of the program used, since it defines a bond in terms of atomic distance therefore a bond is drawn iff the atoms are suffciently close together is space.
BCl3
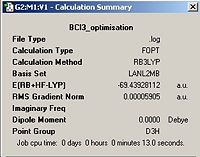
A molecule of BCl3 was first defined in GaussView and a Density Functional Theory (DFT)(aside 1), the B3LYP was again employed using the Lanl2mb option that implements the basis set D95V for first row elements and the Los Almos ECP on heavier elements (aside 1). After optimisation the bond lengths were constant throughout the molecule at 1.86592 Å the bond angles were also constant at 120.00o. The optimised molecule and calculation summary can be found below.
BCl3 | ||||
| Optimised Molecule | Calculation Summary | |||
|
| |||
Own Small Molecule: PCl3
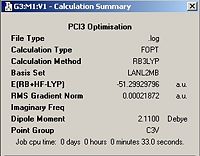
A molecule of PCl3 was first defined using GaussView this molecule was then optimised using DFT/B3LYP with the LANL2MB basis set. The optimised molecule can be seen below, unfortunately the optimal structure was such that the phohphorus and chlorine atoms were not sufficiently close to be defined as bonded by Gaussian. The optimised structure was uploaded into D-Space and can be found at DOI:[1] . The structure can also be found below along with the calculation summary from the Gaussian Job.
PCl3 | ||||
| Optimised Molecule | Calculation Summary | |||
|
| |||
According to these calculations the PCl3 molecule has a C3V point group whereae the BCl3 has a D3h point group. This is due to the trigonal pyrimadal shape adopted by PCl3 in comparisson to the trigonal planar shape adopted by BCl3. This is due to the presence of a lone pair on the P B atom does not have. In this case the cartesian co-ordinates are shown below:
Coordinates of Atoms | |||
| Atom | Position (x,y,Z)/Å | ||
| P | (-0.031876, 0.055211,-0.022540) | ||
| Cl(1) | (-0.001189, 0.002059, 2.160126) | ||
| Cl(2) | (2.036190, 0.002059, -0.721163) | ||
| Cl(3) | (-1.019878, -1.762363, -0.721162) | ||
The bond lengths in the optimised molecule were all equal at 2.39746 Å and the Cl-P-Cl bond angle is 99.51414o. This bond angle is close to the 100o bond angle expected for this compound [1]. The bond length of 239pm is however substainally different from the expected bond length of 204pm [2].
Further Work on BH3
The optimised BH3 molecule from section 1.1.1 was taken and a frequency calculation was run, the calculation was run as a DFT B3LYP with a basis set of 321-1G the geom=connectivity and pop=full options were also implimented. The energy after the optimisation was given as -26.46226438 a.u after the frequency calculations were conducted the summary pane gave the energy as -26.46226438 a.u. this demonstrates that the frequencies have been calculated for the molecule that was optimised. Gaussian calculated 6 possible modes of vibration for the molecule and these can be seen in the table below. (nb. Vibrations occur in forward and back directions along the displacement vectors)
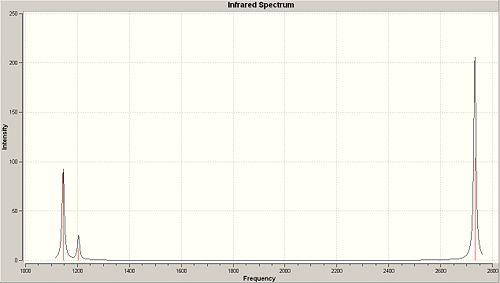
The point groups were derived using character tables available at http://www.webqc.org/symmetry.php. The character tables were applied to the determine the group with the vibrations being dealt with as static objects. The spectrum option was used on the vibrations pane in order to produce a computed IR spectrum for BH3, this spectrum can be seen below and has only 3 peaks. This is not immediately obvious since the frequency calculation returned 6 possible vibrational modes and each vibrational mode represents a possible peak on an IR spectrum. In this case however four of the possible vibrational modes are degenerate (2 pairs of degenerate vibrations) and one vibrational mode at 2592.79cm-1 has a zero intensity, therefore one would expect 3 peaks in the IR spectrum as is observed.
Predicted IR-Spectrum for BH3 |
|
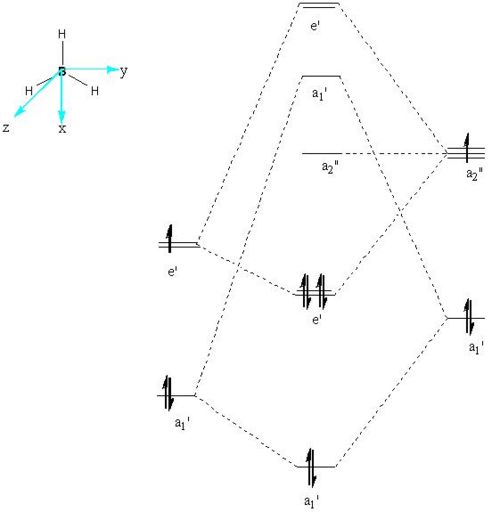
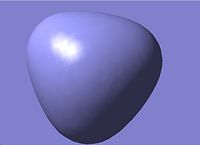
The qualitative molecular orbital diagram of BH2 was drawn and can be seen below. The qualitative orbitals were compared with those generated on GaussView this comparisson can be seen in the table immediately below the MO diagran. The MO were generated quantitatively by setting the pop=full option in a calculation pane for the optimised BH3 molecule, the result of this calculation was then viewed as a check point (.chk) file in the MO visualisation tool found under the Edit menu.
Qualitative MO for BH3 |
|
MO Comparisson for BH3 | ||||
| Molecular Orbital | Symmetry | Qualititative | Quantitative | Comments |
| 1 | a1' | 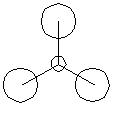
|
|
Very similar with little difference between qualitative and quantitative shape. Overall shape could be easilt predicted qualitatively |
| 2 | e' | 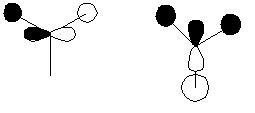
|
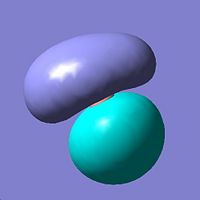
|
Closer to second qualitative MO but again both qualitative and quantitative in good agreement. |
| 3 | a2" | 
|
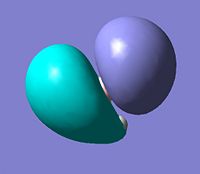
|
Very similar but difference in shape of lobes not predicted quantitatively. |
| 4 | a1' | 
|
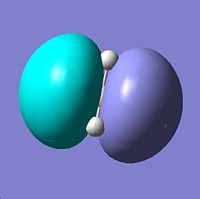
|
Similar to qualitative with alrge lobes centred on the B atom disguing the H atoms. |
| 5 | e' | File:Jp806qualmo5.jpg | 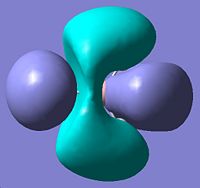
|
blah |
The quantitative process generated an MO for the 1s electrons in boron, these core electrons are not involved in bonding and were therefore excluded from the qualitative MO diagram. The MO orbital and qualitative prediction for this orbital can be seen below.
MO Comparisson for BH3 2 | ||||
| Molecular Orbital | Symmetry | Qualititative | Quantitative | Comments |
| 1 | a1' | 
|
|
This is almost an exact match between qualitative and quantitative MOs. |
This work suggests that qualitative MO theory is of a reasonable level of accuracy since all the MO orbitals generated by Gaussian were very similar to the qualitative MOs created. A key difference is that the quantitative MO calculations give the exact shapes of the MOs which cannot be easily predicted qualitatively. Furthermore quantitative MO calculations give accurate relative energies for each MO, these energies lead to more accurate MO diagrams than those predicted qualitatively.
The Ammonia Molecule
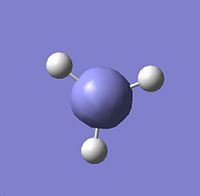
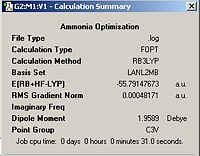
An ammonia (NH3) molecule was defined on GaussView and then minimised using the B3LYP method and the 6-31G basis set, the optimised molecule and calculation summary can be found below.
Ammonia Optimisation | ||||
| Ammonia | Calculation Summary | |||
|
| |||
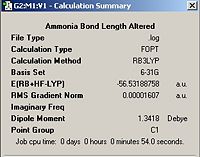
A second molecule of ammonia was then defined and a bond length changed to 1.01 Å from 1.00Å, all other bond lengths were kept as pre-defined by Gaussian. The molecule was the optimised using the B3LYP method and the 6-21G basis set with the ignore symmetry option selected. The result of this calculation can be found below.
Ammonia Altered Bond Length Optimisation | ||||
| Ammonia (1.01 Å) | Calculation Summary | |||
|
| |||
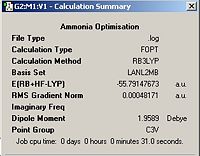
A high symmetry molecule of ammonia was then downloaded from http://www.ch.ic.ac.uk/hunt/teaching/teaching_comp_lab_year3/9b_nh3_symmetry.html this file was first converted to a Gaussian input file by changing the extension from .txt to .gjf. This was then minimised using a MP2 (aside 1) with a 6-311G basis set, the output file and summary can be seen in the boxes below.
Ammonia With a Dummy Atom | ||||
| Ammonia (Dummy Atom) | Calculation Summary | |||
|

| |||
The symmetry of the input file has made a difference to the final structure in the C3v case the molecule is trigonal pyrimidal this is also true in the C1 case, however in the C1 case the difference between the N centroid and the H plane is less than in the C3v case. The D3h case which is of highest symmetry has a planar structure. The symmetry also hasa marked effect on the calculation time, the higher the symmetry of the molecule the faster the calculation runs, for example D3h runs in 27s whereas C1 takes twice as along at 54s. The symmetry of a molecule can be broken if the ignore symmetry tab is checked. However under normal circumstances the Gaussian Program will always attempt to optimise the molecule within its point group. This means that by inputing a highly symmetrical molecule the computational expense of calculation is reduced since there are fewer possible alterations to the molecule. The higher the symmetry of the input the higher the energy of the output in this case D3h is of the highest energy. The energy difference between the isomers of lower symmetry is ΔE=1.2 kJmol-1. This is a very small energy and therefore is of limited significance.
Symmetry
In this discussion of ammonia three different point groups have been assigned these are C1, D3h and C3v. Point groups are derived from group theory, in this case C1 is a subgroup of C3v whic is in itself a subgroup of D3h. A subgroup is defined thus "A subset H of a group G is a subgroup of G if H is itself a group with respect to the operation on G"[3]. [proof that C3v is sub group of D3h]
Ammonia Via MP2 | ||||
| Ammonia (MP2) | Calculation Summary | |||
|
| |||
http://www.chem.purdue.edu/gchelp/vibs/nh3.html - vibrational modes of ammonia
The Inversion Mechanism [4]
There are two basic mechanisms that one could propose for the inversion of ammonia. The first mechanism involes the movement of the N atom from the equilibrium position. In this model the potential energy surface is plotted as energy against reaction coordinate where reaction coordinate is effectively the distance between the N atom and the plane of the three H atoms. In modelling this mechanism the NH bond length is kept constant, this means that the NH bonds will move into space and the HNH bond angle will be altered between the two C3v species this renders this mechanism physically unrealistic. The diagram below demonstrates this mechanism for inversion.
Ammonia Inversion Mechanism 1 | ||||
| Inversion Mechanism 1 | ||||
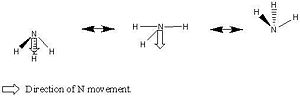
| ||||
Another proposal is that the inversion is caused by the movement of the H atoms about the N centre, in this model the N atom is held in its position on the principle symmetry axis. In this model the bond lengths and angles vary contiunously throughout the motion from the C3v ammonia to the D3h transition state. This implies that the transition state can be reached via the normal vibrations of ammonia. This mechanism can be rationalised in terms of hydridisation of orbitals, this is best explained by a diagram and this can be seen below.
Ammonia Inversion Mechanism 2 Orbital Diagram | ||||
| Inversion Mechanism 2 | ||||
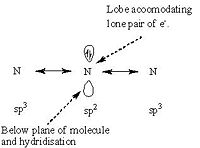
| ||||
In this case the 3 H atoms are all attracted to and competing for, the lobes this causes the H atoms to collapse into the orbitals and hence either maintain the molecules previous conformation or invert to an alternative conformation. There is a equal probability of inversion or maintenance; of conformation. During this mechanism the bond angles are changing continuously until eventually the transition state angle of 120o is reached. Since there is an energy difference between the D3h symmetry and the C3v symmetry there is a barrier to the inversion and by overcoming this barrier the H atoms move from one conformation to the another. One suggested way that the this energy barrier is penetrated is via quantum tunelling effects. During the molecular reorganisation the physical properties of the molecule will be continually changing since the charge distribution will be changing. One such property is dipole moment as the symmetry increases from C3v to D3h the dipole moment should reduce, this is observed by the calculations conducted. Mechanism 2 can be summarised by the diagram below.
Ammonia Inversion Mechanism 2[4] | ||||
| Inversion Mechanism 2 Summary | ||||
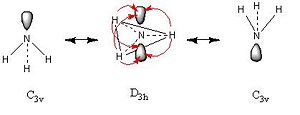
| ||||
Inversion mechanism 2 was then modelled using a "scan" calculation this allows investigations to be made into the potential enrgy surface of a transformation. The scan calculation calculates a series of single point energies along the potential energy surface. To follow the inversion the H atoms were allowed to move and whilst the position of the N atom remained constant. The H atoms were defined to move in such a way as to model the 'umbrella' inversion of ammonia, thus following mechanism 2. A pre-calculated scan computation was downloaded from http://www.ch.ic.ac.uk/hunt/teaching/teaching_comp_lab_year3/9d_nh3_inversion.html saved as a .log file and opened using GaussView. The results tab was then selected and the potential energy surface viewed. The potential energy surface can be seen below.
Ammonia Inversion | ||||
| Inversion Mechanism Potential Energy Surface | ||||

| ||||
The Vibrations of Ammonia
The frequency calculations for C3v and D3h ammonia were computed using the B3LYP method with a 6-31G basis set. The results of these calculations can be seen in the table below.
Ammonia Vibrations | ||||
| Vibration | C3v Frequency/cm-1 | C3h | D3h Frequency/cm-1 | D3h |
| 1 | 1357.44 | 
|
(-840.58) | 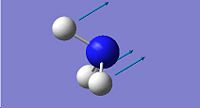
|
| 2 | 1937.93 | 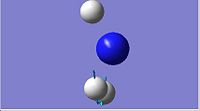
|
1587.95 | 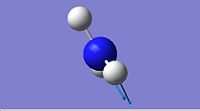
|
| 3 | 1937.93 | 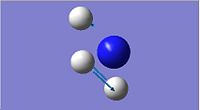
|
1587.95 | 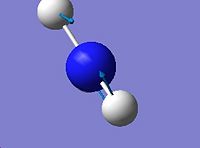
|
| 4 | 3393.56 | 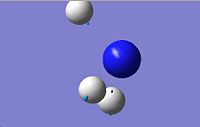
|
3676.66 | 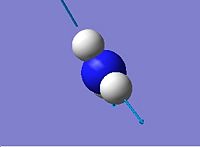
|
| 5 | 3659.31 | 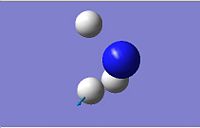
|
3894.23 | 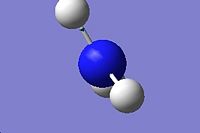
|
| 6 | 3659.31 | 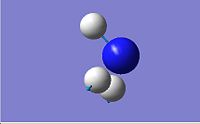
|
3894.23 | 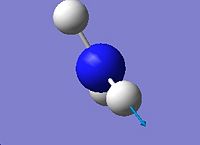
|
Both the D3h and C3v symmetries have 6 possible vibrational modes with 4 vibrational frequencies although in the case of the D3h symmetry there are only 3 peaks that would appear in a real spectrum since a negative frequency is not physically possible. The frequencies labelled 1 in both cases could be used to follow the course of the inversion. Since they are unique frequencies for each symmetry. The table below compares the values obtained from this computation with those obtained experimentally for the ground state molecule of ammonia.
TM Complex Optimisation 1 | |||||||
| Cis | Trans | ||||||
|
| ||||||
| Total Energy= | Total Energy= | ||||||
The .log files were then saved as .gjf files and the complexes re-optimised using the same method but with a LANL2DZ basis set to improve accuracy. The molecules were uploaded to scan with the additional information int=ultrafine and scf=conver=9 input. The results of this improved optimisation can be seen below.
TM Complex Optimisation 2 | |||||||
| Cis | Trans | ||||||
|
| ||||||
| Total Energy= | Total Energy= | ||||||
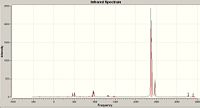
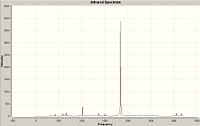
The IR spectras for both isomers were then computed using the B3LYP method and the LANL2DZ basis set, the resulting spectra can be found below:
TM Complex Optimisation 1 | ||||
| Cis | Trans | |||
|
| |||
The spectra show that the trans complex has fewer carbonyl stretches, this is due to the pseudo symmetry of the complexes. The cis isomer is C2v and the trans isomer is D4h, in the D4h point group not all stretches are active in the IR spectra as there is no change in dipole moment. The cis isomer should give 4 CO stretching frequencies whereas the trans isomer should give 3 CO stretching frequencies [5]. The results of the calculation also show the trans isomer to be the most stable as expected. The values obtained for the IR CO stretching frequencies were compared with the literature [6], this comparisson can be seen in the table below.
IR Literature Comparisson | ||||
| Literature Cis/cm-1 | Calculated Cis/cm-1 | Literature Trans/cm-1 | Calculated Trans/cm-1 | |
| 2012.6 | 2464.8 | 2050.4 | 1882.88 | |
| 1912.5 | 2381.58 | 1933.9 | 1839.42 | |
| 1899.5 | 2369.85 | 1886.1 | 1839.42 | |
| 1886.8 | 2352.29 | ******* | ******* | |
These values show poor correlation between experimentally observed and calculated values, however the ligands were different in the TM complex. This means that not all of the error can be attributed to error in calculation.


