Rep:Mod:joc12MgO
Year 3 Computational Experiment - MgO
Name: Joshua Carr
CID: 00731400
Abstract
Experimental simulations were undertaken in DLV to investigate the MgO unit cell. It was found that the optimal grid size to optimizing the density of states and Helmholtz Free Energy was 16 x 16 x 16. The Thermal Expansion Coefficient for MgO was calculated via two different methods both with Lattice Dynamics and Molecular Dynamics and compared to the literature.
Introduction
Phonon Dispersion and Density of States
MgO is a ionic compound that is solid at room temperature that forms a face centred cubic crystal (fcc).[1] It can adopt either a conventional or primitive cell configuration.[1] At temperatures above 0 K, MgO will vibrate. It is possible to map a phonon dispersion of a molecule in k-space. K-space is a reciprocal space that use k as co-ordinates rather than traditional Cartesian co-ordinates. K refers to the wave vector.[2]
In the first Brillouin Zone of a material, the parameters are set from k = -π/a to π/a where a is the periodicity of the vibration.[2] The origin of a graph plotted within these k-values is known as Γ which is a symmetry point (0,0,0). [2] This co-ordinate means that the vibration has a wavelength that is considered infinite. In reality, it means of unit cells are vibrating in the same direction. [2]

A phonon is defined as the quantum equivalent of a vibration resulting from the wave-particle duality principle. [3] These phonons are quantised as a result as the quantum harmonic oscillator theorem. This states that the only permitted vibration have the same energy as the discrete vibrational energy levels defined in the theorem.[3] A phonon dispersion graph depicts how frequency of the vibration changes as the k-value changes.[4] There are two types of vibrational mode: acoustic and optic.[4] The acoustic mode of vibration comes from the above function subtracting and the optical mode of vibration comes from the above function adding.[4] The acoustic mode passes through 0 at Γ.[4] The optic vibrations do not.[4]
For a three-dimensional crystal, there will be three degrees of freedom to consider. MgO possesses two vibrational modes in each dimension resulting a total of six branches in a phonon dispersion.[4] This does not take into account of degeneracy. It is possible on a phonon dispersion curve in regions for less number of branches than expected. This is due to the vibrational modes having the same energy.[4]
A method of finding the distribution of the frequency of vibration is via the use of Density of States. The Density of States is a probability distribution of the population of these vibrations states.[3] It can be related to the phonon dispersion because the density of states can take into account multiple k-points resulting in an average of vibrational energy levels described in the phonon dispersion. The accuracy of density of states mapping depends on the number of k-points being taken in the sample. The more k-points taken, a resultant graph will shift from sharp needle like peaks to a continuum. A smaller grid size such as the 1 x 1 x 1 grid size will only take into account one k point and map the density of states at that particular k point. This result would be represented on the phonon dispersion in the number of bands at the correct frequency on the phonon dispersion graph.
Quasi-Harmonic Approximation
The harmonic approximation states that an oscillator will have discrete vibrational energy levels that are quantised. [3]If depicted on a graph where potential energy is set against intermolecular distance, the result would be parabolic function. [5] This theory works well for internuclear distance is near to the equilibrium bond distance which is at the minima of the parabola. However, this theory breaks down because the intermolecular distance does not increase with temperature according to the theory prohibiting thermal expansion.[5] At higher intensity vibrations, the average intermolecular distance starts to become bigger. For the harmonic oscillator, the average bond length does not change with energy meaning a correction is needed. At the point of infinite separation occurs, the bond in the molecule breaks and the atoms dissociate as ions.[2] This is the melting point which is of significant interest in this investigation. Therefore it is not possible to investigate the vibrations near the melting point with harmonic oscillator approximation. Thus, the quasi-harmonic approximation was used since it does taking into account these and can be used to map how the cell expands at higher vibrational energies.[5]
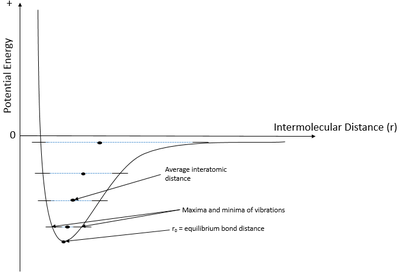
The quasi-harmonic approximation produces a Lennard-Jones type of function as shown in Figure 2 to the right. As the temperature increases, the amplitude of the vibrations increases resulting in greater average interatomic separation.[5] This effect occurs for every single unit cell resulting in an increase in the optimal lattice parameter and consequently, volume. The expansion is due to the system wanting to reduce the internuclear repulsion forces that would occur if otherwise at near the maxima of the vibration.[2] At the melting point, the maxima of vibration will reach the distance where the point of infinite separation is. At infinite separation, the two atoms will not have any effect on one others meaning the electrostatic bond is broken. The lattice dissociates forming free moving ions.
In addition to measuring the effect of temperature on the optimal lattice parameter, the effect of the Gibbs Free Energy could also be investigated. This would provide information about how spontaneous the process of thermal expansion. The shape of the graph obtained would reveal the power dependence temperature has on the Gibbs Energy which can be related to entropy.[3]
Lattice Dynamics and Molecular Dynamics
Lattice Dynamics theory uses the harmonic and quasi-harmonic oscillator theorems to map the vibrations as phonons. Another method that can be used is Molecular Dynamics. Molecular Dynamics treats the atoms in the unit cells classically and does not use the harmonic approximation. Molecular Dynamics maps the trajectory of vibration via Newton's Second Law: F = ma.[3] When the temperature increases, the acceleration increases so any changes in the trajectory can be mapped. Analysis of the vibration animation of resulting calculation show that the molecule also undergo random motion in all directions. This is not the case in Lattice Dynamics animations.
Experimental
Simulations were run using DLV with the Linux operating system. The Internal Energy, Density of States, Optimization of the Helmholtz Free Energy and Thermal Expansion MgO were all run using Lattice Dynamics all using GULP. The Density of States Simulations were run changing the double the grid size in three dimensions every time. The same was done with the Optimization of the Helmholtz Free Energy. For the Thermal Expansion of MgO, the simulation was set to optimize the Gibbs Free Energy whilst setting the Phonon DOS to 16 x 16 x 16. The Temperature was increased 100 K at a time through a range of 0 to 1000 K. After this, Molecular Dynamics simulations were run to investigate its predictions of the thermal expansion. The NPT ensemble was chosen in addition of using a timestep of 1.0 femtoseconds. The equilibration steps and production steps were set to 500. Sampling and Trajectory write steps were set to 5.
All the above calculation used GULP Potential Parameters - ionic.lib and did not include shells since this would generate an error in the calculation.
Results and Discussion
Internal Energy of the MgO Crystal
The first simulation run was calculating the Internal Energy of a MgO crystal. This values was computed to be -41.075 eV.
Lattice Vibrations - Computation of Phonons
The destiny of states varies with grid size. When the size of the grid was increased, more k-points are taken within the sample size. This will produce a Density of States that is a closer approximation to the real data building a stronger statistical mechanical model. As the grid size increased, more smaller peaks started to form and a continuum graph size was obtained for the 16 x 16 x 16 grid size. The 1 x 1 x 1 DOS mirrors the Phonon Dispersion graph with its four peaks with two of these peaks at lower frequencies being double the number of states present.

The k point of the 1 x 1 x 1 was found to be (0.5, 0.5, 0.5) which corresponds to L. This corresponds to the phonon dispersion curve in Figure 1. At this point, there are two overlaps at around 300 and 350 cm-1 which would correspond to the respective peaks in DOS having double the area both by eye and by numerical integration.
When running a simulation, a compromise between accuracy and computation time must be meet. This is very important for larger molecules being simulated because of the potential of a calculation being expensive in terms of time and running costs. To determine this compromise for the density of states function, the grid size parameter was doubled until a point was reached where the results did not provide sufficient extra accuracy for the extra computation time.
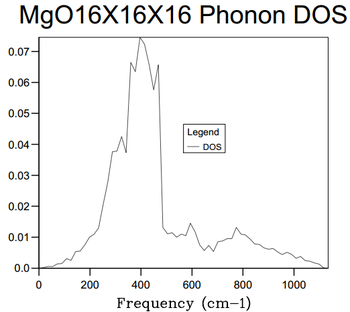
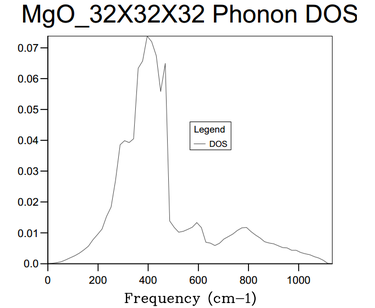
16x16x16 was found to this compromise point. This was because via making a comparison with 32 x 32 x 32 grid size. The computation time for the 32 x 32 x 32 was far longer; CPU time = 23 s as well as taking minutes for the log file ready to be recovered. This was in contrast to the instantaneous return of the logfile for the 16 x 16 x 16 files. For a much longer computation time, the Density of States graph produced was identical to the eye. The amount of extra information obtained was minimal and not worth the longer computation time. The only real changes is that graph is smoother In comparison to smaller grid sizes, the 16 x 16 x 16 grid size produced a DOS that contained more vibration frequencies corresponding to more vibrational energy levels with much smaller population density as shown by the y-axis comparison.
Calcium Oxide is a similar oxide to MgO. Despite Calcium being a larger atom, its lattice constant is not that much higher - 4.82 A[6] compared to 4.12 A experimental value for MgO. [7] From these values, it is safe to assume that a 16 x 16 x 16 would be a reasonable grid size to determine the density of states of CaO. However, it would be interesting to compare the DOS with a 32 x 32 x 32 to see whether more appreciable change occurs. Faujasite is a zeolite with a lattice parameter of 24.7 A .[8] The unit cell of this compound is much higher than that of MgO. Because of the conversion factor between real lattice parameter and the one in k-space, the grid size must be smaller. 4 x 4 x 4 grid size would be a reasonable starting point. Lithium metal adopts a body centred cubic cell and has a lattice parameter 3 A. [9] This is smaller than that of MgO. A much larger grid size is necessary because the lithium unit cell would be much larger in k-space.
Computing the Free Energy - The harmonic approximation
The Helmholtz Free Energy varies with grid size. As the grid size increases, the Free Energy becomes more increasing negative at an decreasing rate converging towards -40.9264 eV. Table 1 below shows the values computed as well as the difference occurred with increasing grid size.
| Helmholtz Free Energy vs Grid Size | ||
|---|---|---|
| Grid Size | Helmholtz Free Energy (eV) | ΔE (eV) |
| 1 x 1 x 1 | -40.930301 | n/a |
| 2 x 2 x 2 | -40.926609 | 3.7 x 10⁻³ |
| 3 x 3 x 3 | -40.926432 | 1.7 x 10⁻³ |
| 4 x 4 x 4 | -40.926450 | -1.8 x 10⁻⁵ |
| 8 x 8 x 8 | -40.926478 | -2.8 x 10⁻⁵ |
| 16 x 16 x 16 | -40.926482 | -4 x 10⁻⁶ |
| 32 x 32 x 32 | -40.926483 | -1 x 10⁻⁶ |
Using the energy differentials calculated in Table 1, one could use these as precision parameters for future calculations.
• 1.0 mEv - 2 x 2 x 2 grid size.
This grid size was chosen because this was first computed value of the Helmholtz Free Energy correct to that precision.
• 0.5 mEv - 2 x 2 x 2 grid size
This grid size was chosen because this produced the first computed value of the Helmholtz Free Energy correct to that precision since the value can be rounded down to -40.9265 eV. The 3 x 3 x 3 grid size is also an equally valid answer since it can be rounded up to -40.9265 eV.
• 0.1 mEv - 3 x 3 x 3 grid size
This grid size was chosen because this produced the first computed value of the Helmholtz Free Energy correct to that precision since this value can rounded up to -40.9264 eV whilst the 2 x 2 x 2 value would have to be rounded up to -40.9265 eV.
The convergence of the Helmholtz Free Energy can be likened to what occurs with the density of states. The Helmholtz Free Energy is a thermodynamic potential that can be optimized by increasing the number of k-points sampled in the optimization calculation. [3] The output figure is an average of the free energy approximated by the number of k-points in the sample. The more k-points taken, the better the sample represents the free energy of the sample. The value calculated is a decent estimate of the Free Energy because not all the k-points were taken into account.
Calcium Oxide has a similar lattice parameter to that MgO so it is resonable to suggest that these grid sizes would be appropriate. Faujasite possesses a much larger lattice parameter and thus would have a smaller cubic size in k-space. As a result, a smaller grid size must be used. The opposite is true for Lithium metal since the crystal is bigger in k-space thanks to its smaller lattice parameter than MgO.
The Thermal Expansion of MgO
When MgO is heated, it expands. The optimal lattice parameter will increase and the Gibbs Free Energy will change according to their dependence on Temperature. [3] A series of simulations were run between 0 - 1000 K at 100 K degree intervals and the data obtained was plotted to extract thermodynamic data.
Gibbs Free Energy vs. Temperature
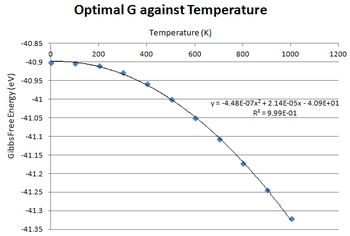
The free energy against temperature graph obtained is a negative polynomial curve. The trendline indicates that there is a second order dependence of Temperature on the Gibbs Free Energy. When the Temperature is increased, the Gibbs Free Energy becomes more negative making the process more favourable. [3] This is in accordance with a consequence of the δG/δT = -S where S is the entropy. [3] The gradient of the curve represents how the entropy changes as temperature increases. [3] Since the gradient would be negative, it implies there is a positive increase in entropy meaning that the crystal is becoming more disordered as temperature increases. [3] Entropy can be viewed as a measure of the number of accessible microstates in of a system and is related by the equation below:
At 0 K, W (microstates) will be equal to 1 meaning the entropy is equal to zero hence the gradient being zero at that point. [3] As the temperature increases and the number of vibrational energy levels become more accessible, the entropy will increase resulting in an increasing positive gradient. [3]
Lattice Parameter vs. Temperature
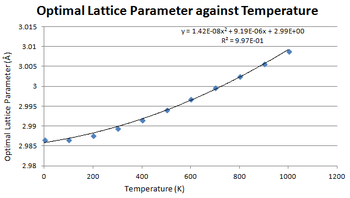

As expected, the lattice parameter and volume increased with temperature as seen in Figure 7 and 8. There appears to be a quadratic dependence on temperature to lattice parameter and volume. Determining the thermal coefficient is dependent on the nature on the partial derivative between volume and temperature as shown by the equation below: [5]
α is the thermal expansion coefficient. [5] V0 is the initial volume which will be taken to be the calculated values for the volume at 0 K. The partial derivative is used because pressure is kept constant in these calculations.
One method of calculating α is to use a simple approximation that one could use is to take the points of the graph that would form a linear relationship and extract the gradient from the resulting plot. In this case, this range would be from 300 - 1000 K. Computing this value, the thermal expansion coefficient would 2.83 x 10⁻⁵. This has decent agreement with the literature: 3.57 x 10⁻⁵. [10] One problem with linearising this equation is that the V0 obtained with graphical analysis is lower than the calculated one. When fitting a linear line to the graph, it produced a V0 value of 1.872 A3 which is not the V0 value obtained: 1.883 A3. This results a skew in the gradient. Another problem with this method is the approximation taken that the thermal expansion coefficient does not change with temperature. This is in disagreement with the simulation results.
Another method was to use quadratic interpolation by differentiating the trendline equation to form a linear equation in T.
The equation obtained from the trendline was 2.741 x 10⁻⁷ T2 + 1.719 x 10⁻⁴ T + 18.882 which differentiates to 5.482 x 10⁻⁷ T + 1.719 x 10⁻⁴. α was calculated for each temperature by using the solution to this equation as the partial derivative.
| α calculated via Quadratic Interpolation - Lattice Dynamics Method | ||||
|---|---|---|---|---|
| Temperature (K) | Primitive Cell Volume (A3) | (δV/δT)p (x 10-4 A3T-1) | Calculated α (x 10-4 K-1) | Experimental α (x 10-5 K-1) [11] |
| 0 | 18.837 | n/a | n/a | n/a |
| 100 | 18.838 | 2.27 | 1.20 | n/a |
| 200 | 18.856 | 2.82 | 1.49 | n/a |
| 300 | 18.890 | 3.36 | 1.79 | 3.12 |
| 400 | 18.933 | 3.91 | 2.08 | 3.57 |
| 500 | 18.980 | 4.46 | 2.37 | 3.84 |
| 600 | 19.031 | 5.01 | 2.66 | 4.02 |
| 700 | 19.085 | 5.56 | 2.95 | 4.14 |
| 800 | 19.141 | 6.10 | 3.24 | 4.26 |
| 900 | 19.199 | 6.65 | 3.53 | 4.38 |
| 1000 | 19.260 | 7.20 | 3.82 | 4.47 |
Table above shows α being calculated by measuring the gradient of the slope at each data point. The results show that α increases with temperature. The values calculated have good agreement with the literature having the same order of magnitude, but are consistently lower. Reasons for this could be limitations in approximations not taking into account factors not accommodated in the quasi-harmonic approximation such electronic contributions since electron repulsion and speed are also affected by temperature. This would be the predominant in the difference between the calculated and experimental values.
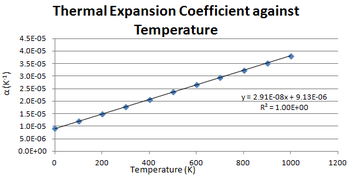
After determining α, α was plotted against temperature to determine the temperature dependence based on the results obtained. As shown by the Figure 9, α has a linear dependence on temperature increasing at a rate of 9 x 10⁻⁶ A3K-1. This trend is matched by the literature values as shown in Table 2 above.
In addition to this, simulations were run between 1000 K and the melting point (3125 K) to see how the Gibbs Free Energy and Volume are affected by much higher temperatures. The results showed that the trend for both the Gibbs Free Energy and Lattice Parameter continued confirming that both of these quantities have a quadratic dependence on Temperature. In both cases, the simulations failed to work from 2800 K onwards meaning that results at near the melting point could not be obtained.
As the temperature nears the melting point, the phonon modes are not a strong representation of the actual motion of the ions. This is because electronic effects on the motion have not been modelled alongside the phonons meaning the approximation used in the calculation is provides limitations. Simulations that take into account the electronic interactions as well would provide a more detailed and closer simulation in comparison to a real system.
Molecular Dynamics
The previous calculations were run using Lattice Dynamics. Molecular Dynamics calculations can also be ran in DLV. For this simulation, a MgO crystal with 32 molecules was used forming a 2 x 2 x 2 conventional cell. In order to compensate for this, the results were divided by 32 to get the primitive cell. This is because there are 2 atoms (1 Mg, 1 O) present in the primitive cell.[1] Comparisons with the Lattice Dynamics dynamics were made.

Figure 10 above shows how the two different methods compare and contrast. For Molecular Dynamics simulation, values at 0 K could not be obtained. This is because there are no vibrations present at absolute zero meaning the calculation failed.[3] Attempts to run simulations at 0.1 K, 5 K were made, but the calculations failed. As seen by the graph above, the two curves converge at higher temperatures. At lower temperatures, there is a divergence. Since Lattice Dynamics is based off quantum mechanics, there will be a zero point energy as the graph tends 0 K.[5] As a consequence, the V0 would be higher than expected because it is still vibrating at 0 K. This zero-point energy represent the lowest energy vibration the molecule can possibly have.[5] This is not taken into account with Molecular Dynamics which is a classical theory which assumes that at 0 K, there are no vibrations and therefore give a lower V0 than lattice dynamics.
Much like the Lattice Dynamics results, both a quadratic and linear fit could be applied to the resultant graph. The R2 values suggested that the quadratic fit was a more suitable fit compared to the linear (0.997 vs 0.995).These R2 were much closer together than that of Lattice Dynamics.
α was calculated using same methods in Lattice Dynamics.
• Linear Fit Calculated α: 3.12 x 10⁻⁵
| α calculated via Quadratic Interpolation - Molecular Dynamics Method | ||||
|---|---|---|---|---|
| Temperature (K) | Primitive Cell Volume (A3) | (δV/δT)p (x 10-4 A3K-1) ' | Calculated α (x 10-5 K-1) | Experimental α (x 10-5 K-1) [11] |
| 100 | 18.736 | 4.60 | 1.21 | n/a |
| 200 | 18.777 | 4.87 | 1.51 | n/a |
| 300 | 18.840 | 5.14 | 1.80 | 3.12 |
| 400 | 18.872 | 5.41 | 2.09 | 3.57 |
| 500 | 18.931 | 5.68 | 2.39 | 3.84 |
| 600 | 19.001 | 5.95 | 2.68 | 4.02 |
| 700 | 19.064 | 6.22 | 2.973 | 4.14 |
| 800 | 19.124 | 6.49 | 3.27 | 4.26 |
| 900 | 19.191 | 6.76 | 3.56 | 4.38 |
| 1000 | 19.252 | 7.03 | 3.85 | 4.47 |
Table 3 shows the results of the quadratic interpolation. The α values calculated were pretty much identical to those calculated for Molecular Dynamics at higher temperatures. The difference at lower temperatures arises from the differences in the two theorems. The smaller α values are because the effect of thermal excitation of electrons are ignored much like lattice dynamics.[5]

Figure 11 above details how α has a linear dependence on temperature much like lattice dynamics meaning the theorems agree with each other in that respect. The numerical differences in the gradient of this curve is relatively small meaning both methods are valid to calculate α when only taking into account the phonons.
At higher temperatures in the quasi-harmonic approximation, the volume should continue to increase with the same quadratic dependence relationship until a point of infinite separation is reached where the crystal will melt. The same should occur with Molecular Dynamics. This was tested. It did so, but was not produce as smooth a relationship as seen at lower temperatures.

Figure 12 shows a good agreement between Lattice Dynamics and Molecular Dynamics between 1000 K - 1500 K. After this temperature, the theories begin to diverge. There were a lot of anomalous results with Molecular Dynamics and even a decrease in volume at around 2500 K. This was due to the values taken was the average of instantaneous and subject to error. When the melting point was surpassed in the Molecular Dynamics, the calculation did not take this into account and produced a value as if the crystal had not melted. This was because the ions are free moving and not have a optimal lattice parameter yet it was computed to be 20.782 A3 at 3200 K. With comparisons to Figure 12 and 13, it can be concluded that Lattice Dynamics is more useful at lower temperatures since it takes into account zero-point vibrations which is a consequence of Lattice Dynamics.[5] Molecular Dynamics is more suitable for higher temperatures near the melting point since this is the only theory able to produce results.
Because the MgO cell used was much larger than the one used for the Lattice Dynamics Free Energy calculations, a different grid size is needed. 16 x 16 x 16 would be insufficient because the MgO 32 atom cell has a larger lattice parameter. A reasonable first test run would be either 2 x 2 x 2 or 4 x 4 x 4 grid size.
Conclusion
In conclusion, it was found that MgO simulations provide insight to its thermal properties. 16 x 16 x 16 grid size was found to the compromise point for calculating the density of states and Helmholtz Free Energy. Lattice Dynamics and Molecular Dynamics were used to calculate the thermal expansion coefficient and compared and contrasted. The results has decent agreement to literature values, but did not match since electronic contributions were not considered.
Further Experimentation
Running simulations of CaO, zeolite and Lithium would test hypothesises stated earlier. In order to compare the results with the simulation results, neutron scattering could be run to measure the phonon dispersion. [5]
References
- ↑ 1.0 1.1 1.2 Inorganic Chemistry, Shriver, P Atkins, OUP, Oxford, 5th Edition, 2009.
- ↑ 2.0 2.1 2.2 2.3 2.4 2.5 How Chemistry and Physics Meet in the Solid State, R. Hoffmann, Angewandte Chemie International Edition, 1987, Volume 26, pages 846-878 Cite error: Invalid
<ref>tag; name "Reference 2" defined multiple times with different content - ↑ 3.00 3.01 3.02 3.03 3.04 3.05 3.06 3.07 3.08 3.09 3.10 3.11 3.12 3.13 3.14 3.15 Physical Chemistry, P. Atkins, J. De Paula, OUP, Oxford, 9th Edition, 2009. Cite error: Invalid
<ref>tag; name "Reference 3" defined multiple times with different content - ↑ 4.0 4.1 4.2 4.3 4.4 4.5 4.6 Physics of Condensed Matter, P Misra, Academic Press, New York, 2011 Cite error: Invalid
<ref>tag; name "Reference 4" defined multiple times with different content - ↑ 5.00 5.01 5.02 5.03 5.04 5.05 5.06 5.07 5.08 5.09 5.10 Solid State Physics Reference Volume 3: Theory of Lattice Dynamics in the Harmonic Approximation, Academic Press, New York, 1963 Cite error: Invalid
<ref>tag; name "Reference 5" defined multiple times with different content - ↑ The Surface Energies of Calcium Oxide and Calcium Hydroxide, S. Brunauer, D. Kantro, C Weise, Canadian Journal of Chemistry, VOL. 31, 193l
- ↑ Dependence of the Lattice Parameter of Magnesium Oxide on Crystallite Size, A. CIMINO†, P. PORTA and M. VALIGI, Journal of the American Ceramic Society, Vol. 49, 1966
- ↑ Powder Neutron Diffraction and 29Si MAS NMR Studies of Siliceous Zeolite-Y, J. Hriljac, M. Eddy, A. Cheetham, J. Donohue, G. Ray, Journal of Solid State Chemistry, Volume 106, 1993, Pages 66–72
- ↑ Lattice Constants of Separated Lithium Isotopes,E. J. Covington and D. J. Montgomery, The Journal of Chemical Physics 27, 1030 (1957)
- ↑ The Coefficient of Thermal Expansion of Magnesium Oxide ,M. Durand, Journal of Applied Physics 7, 297 (1936);
- ↑ 11.0 11.1 Thermodynamic Functions and Properties of MgO at High Compression and High Temperature, O. Anderson, K. Zou, J. Phys Chem, Ref. Data, Vol. 19, 1990 Cite error: Invalid
<ref>tag; name "Reference 12" defined multiple times with different content
