Rep:Mod:joannechen
Abstract
Computational experiment was taken out to study the thermal expansion of MgO using DLVisualize and rationalised by Quasi Harmonic Approximation(QHA) and Molecular Dynamics(MD).
Introduction
Magnesium oxide exist as face-centre cubic structure which is the analogue of NaCl, containing 4 Mg2+ and 4 O2- in a conventional cell.
Quasi
harmonic allows anharmonicity in some extent which equilibrium bond distance is changeable and harmonic holds for every lattice position,4
observations and calculations can be made to probe the properties of the crystal with
a changing volume.
Similar to the hypothetical hydrogen long chain the energy levels of the MgO lattice with repeated cells are contracted into energy band. 2
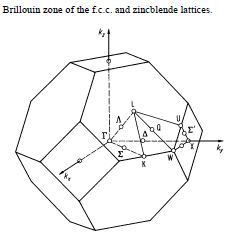
Calculation can be made in reciprocal space in kx ky and kz direction, as shown in fig.2 3 and can be exported back to the real space by Fourier transform.
Vibrations can be treated as particles or wave.
Every k vector represents a vibration model called phonon, a concept of quantum mechanics, and it is assumed that they are independent of each other.
Numerically k equals 2 pi divided by the lattice constant 'a' in real space, which means if the the lattice constant becomes '2a', k in the reciprocal space will be haled.
It also causes the folding of energy against k graph. Since Mg and O are two different atoms, there will be energy gap for the branches.
Additionally, when k = 0 all atoms move in phase to give an infinite large wavelength.
Molecular dynamic is a computer simulation using classic Newton's law. Force is
applied to the system and the atoms are given motion,
after the energy spreads
out the motion and other properties like temperature of the system reach an
equilibrium state with small fluctuation.
Shrinking factor 2x2 cuts the cell into 4 pieces at the sides respectively, and by the same principle apply to nxnxn in 3 dimensional space.
The higher the shrinking factor the more the k point will be selected and the more close to what happen in the system.
Sum of all k
point can represent the properties of the system, but it will take a infinite
time to run a calculation for infinite atoms
therefor ensemble is introduced as a approximation of a system which is a
collection of the configurations of the system.
Appropriate shrinking factor should be chosen which is large enough to approximate the system and small enough for the convenience in calculation.
In the QHA primitive cell (one MgO) was used while in the molecular dynamics simulation a cell of 32 MgO was used.
Result and discussion
quasi harmonic approximation
Phonon dispersion graph was obtained with N points = 50 sampled along conventional pathway WLGXWK in brillouin zone as shown in fig.1
with coordinations W(0.5,0.25,0.75) L(0.5,0.5,0.5) G(0,0,0) X(0.5,0,0.5) W(0.5,0.25,0.75) K(0.375,0.375, 0.75) respectively.
 |
 |
|---|
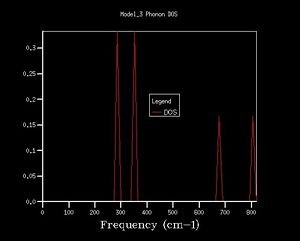
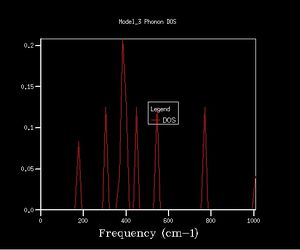
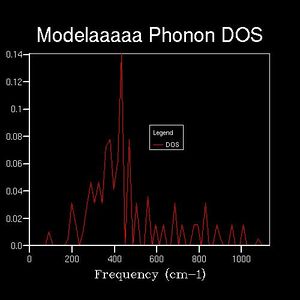
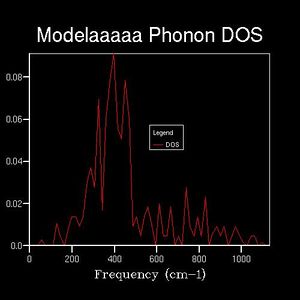
Density of states graphs were obtained with 8 different shrinking factors as shown below.
 |
 |
 |
 |
|---|---|---|---|
 |
 |
 |

|
The shapes of the DOS change considerably over the first few graphs with the shrinking factors going from 1 to 6, the peaks spread out.
While after 16x16x16 the fluctuations become small, giving smooth curves and a board peak.
4 and 7 distinct peaks are clearly shown for shrinking factor 1 and 2 respectively.
The maximum peak in each DOS are always near 400 cm-1.
It is noticeable that 64x64x64 took minutes to run, and it only contains minor difference to the 32x32x32 one.
16x16x16 should give an good approximation of the system and it is a balance point between accuracy and calculation time.
Relationship between 1x1x1 DOS and the phonon dispersion:
It is noticed that the K point of 1x1x1 DOS is 0.5 0.5 0.5 with corresponding frequencies: 288.49 288.49 351.76 351.76 676.23 818.82 cm-1,
which is the same k vector and frequency as the 10th K point (point L in the fig.1) listed in phonon dispersion log file.
What is more,the frequencies of degenerated vibrations 288.49 and 351.76 the densities are double those of 676.23 and 818.82 cm-1.
Finding reasonable shrinking factor for the expansion part.
Free energies were optimised to get the most stable geometry under different shrinking factors as shown in table.
| shrinking factor | free energy / eV |
|---|---|
| 1x1x1 | -40.930301 |
| 2x2x2 | -40.926609 |
| 3x3x3 | -40.926432 |
| 4x4x4 | -40.926450 |
| 5x5x5 | -40.926463 |
| 6x6x6 | -40.926471 |
| 7x7x7 | -40.926475 |
| 8x8x8 | -40.926478 |
| 9x9x9 | -40.926479 |
| 10x10x10 | -40.926480 |
| 11x11x11 | -40.926481 |
| 12x12x12 | -40.926481 |
| 13x13x13 | -40.926482 |
| 14x14x14 | -40.926482 |
| 15x15x15 | -40.926482 |
| 16x16x16 | -40.926482 |
| 17x17x17 | -40.926482 |
As shrinking factor increases, the change free energy converge to a finite value.
Shrinking factor larger than 2 with accuracy 1 meV,
shrinking factor larger than 3 with accuracy 0.1 meV per cell.
13 is good enough to be used as the shrinking factor in the thermal expansion .
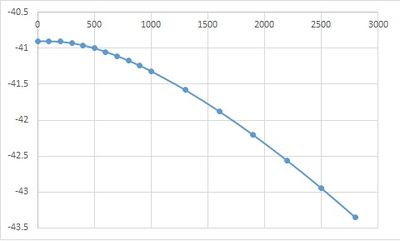
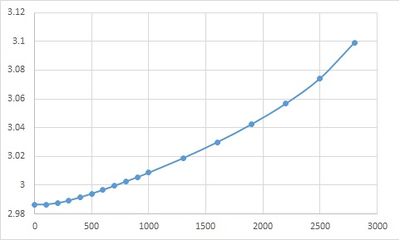
Free energy was optimised from 0 to 1000 Kelvin, lattice constant (volume) and free energy were recorded for analysis.
| Temperature / K | Free energy / eV | lattice constant / A | volume / A3 |
|---|---|---|---|
| 0 | -40.90190627 | 2.986563 | 18.836496 |
| 100 | -40.90241942 | 2.986658 | 18.838268 |
| 200 | -40.90937667 | 2.987606 | 18.856204 |
| 300 | -40.92812366 | 2.989392 | 18.890029 |
| 400 | -40.95859279 | 2.991633 | 18.932512 |
| 500 | -40.99943424 | 2.994139 | 18.980117 |
| 600 | -41.04931341 | 2.996825 | 19.031229 |
| 700 | -41.10711691 | 2.999649 | 19.085064 |
| 800 | -41.17188925 | 3.002595 | 19.141325 |
| 900 | -41.24301522 | 3.005642 | 19.199648 |
| 1000 | -41.31984516 | 3.008792 | 19.260052 |
| 1300 | -41.58004206 | 3.018864 | 19.454063 |
| 1600 | -41.87795517 | 3.029987 | 19.669833 |
| 1900 | -42.20751267 | 3.042458 | 19.913641 |
| 2200 | -42.56474511 | 3.056849 | 20.197479 |
| 2500 | -42.94715413 | 3.074407 | 20.547454 |
| 2800 | -43.35354659 | 3.099267 | 21.049888 |
Attempts were made to run GULP at 3100 and 3400 kelvin but errors were shown,
possible reason is that the quasi harmonic approximation not apply at temperature too close or exceeding the melting point of a crystal.
PLOT Free energy against temperature.
PLOT lattice constant against temperature.
Calculate coefficient of thermal expansion.
PLOT volume against temperature.

the trend line obtained using polynomial up to x2 for volume against temperature is: y = 2*10-7x2 + 0.0002x + 18.829
thus dV/dT : 4*10-7x + 0.0002 and it is used to calculate expansion coefficient where x is the corresponding temperature.
molecular dynamics
PLOT change in volume
| Temperature | Volume |
|---|---|
| 100 | 599.513295 |
| 200 | 601.241595 |
| 300 | 602.899441 |
| 400 | 604.609431 |
| 500 | 606.322864 |
| 600 | 608.166535 |
| 700 | 610.085241 |
| 800 | 612.102518 |
| 900 | 614.060747 |
| 1000 | 615.63532 |
| 1300 | 621.914205 |
| 1600 | 626.541299 |
| 1900 | 632.249813 |
| 2200 | 637.052789 |
| 2500 | 642.986419 |
| 2800 | 650.770808 |
| 3100 | 653.844695 |
| 3400 | 669.26276 |
Attempts were made to run GULP at 3100 and 3400 kelvin and calculations were successful.
Compare and comment on the difference.
formula for calculating thermal expansion coefficient:
αv=1/V0(∂V/∂T) unit:K-1
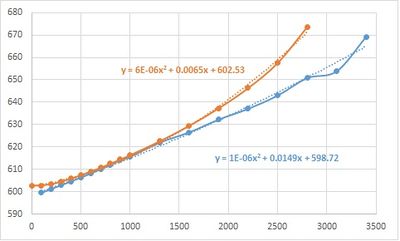
It is clear seen that there is a steep increase of the volume around 3000K, corresponding to the phase change of the solid.
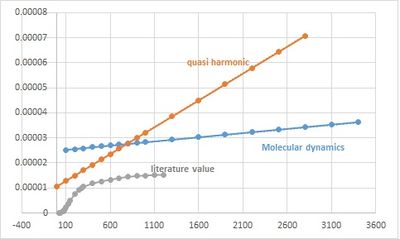
Both methods show deviations from the experimental values.
In the QHA only introduces small amount of anharmonicity, and phonon interaction is simplified and neglect.
Choosing shorter time step or larger equilibration steps and production steps may lead to a more accurate result.
Conclusion
In the analysis of the thermal behavior under increasing temperature, Quasi harmonic provide a relatively poor explanation than molecular dynamics in higher temperature,
due to the fundamental limitation of QHA the poor match to the potential distance profile, while in molecular dynamics the lattice constant can always increase.
However, both method should be used in larger system in order to get more accurate results.
Reference
- 1. G. K. White and O. L. Anderson, J. Applied Phys., 1966, 37, 430-432.
- 2. R. Hoffmann, Angewandte Chemie Int. Edition in Engl., 26, 846-878
- 3. O. Madelung, U. Rössler, M. Schulz (ed.), Landolt-Börnstein - Group III Condensed Matter, 1999, 41B.
- 4. K.Ishikawa, Phy. Stat. Sol., 1967, 21, 137-144
