Rep:Mod:jnn1234
Inorganic Computational Module
EX3 section
| Parameter | BH3 | BBr3 | GaBr3 |
|---|---|---|---|
| r(E-X) | 1.19 | 1.93 | 2.35 |
| θ(X-E-X) | 120.0° | 120.0° | 120.0° |
The above calculations for BH3 and BBr3 are reported based on the calculations obtained from B3LYP, basis set: 6-31G (d,p). All values reported are similar to values reported in literatures :for BH3: DOI:10.1063/1.461942 , for BBr3: DOI:10.1002/zaac.200700510 , for GaBr3: DOI:10.1016/S0022-2860(97)00420-1
Structure analysis of BH3, BBr3 and GaBr3
What difference does changing the ligand have? How are H and Br similar, how are they different? What difference does changing the central element make? How are B and Ga similar, how are they different?
Bond distance is denoted by the average bond distance between the two nuclei of the atoms. Firstly, it should be noted that all 3 species are trigonal planar in strucutre and hence they all have the same bond angle of 120.0° with D3h symmetry. This is supported by computational method as shown below after optimising all 3 structures. Examining the same central atom Boron, B, it was noted that the bond distance increases as the ligands changed from H to Br. This is because Br is a much larger atom as compared to H, hence having a longer bond lengths. Similarly, the same argument can be applied by comparing BBr3 and GaBr3. However, this explanation is based on the assumption that the bond between these compounds are purely covalent in nature. This may not be necessary true as there can be factors such as ionic contributions that can affect the length of the bond. Examining the 3 structures above, all of them are electron deficient species. Looking at BH3, the calculated values are close to the reported value in literature DOI:10.1063/1.461942 , suggesting that the bond between B-H is indeed likely to be covalent. However, comparing BBr3, the calculated value is much smaller than the reported value in literature DOI:10.1039/B801115J . The difference in bond length can be accounted by the lewis acidity of BBr3. The ability for Boron to accept electrons into its vacant p orbitals allows π interaction with the filled p orbitals of Br. As a result of such interactions, the surrounding Br atoms are able to stabilised the electron deficient B atom thereby shortening the bond and increases the bond order of B-Br. The π interactions can be shown in below:
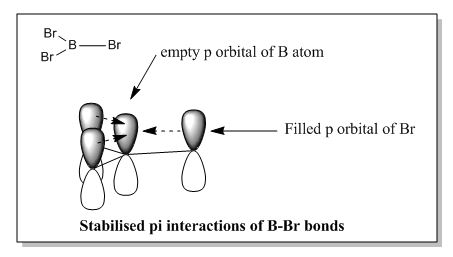
Moving on to GaBr3, due to increase in size of down the group, this makes the bond length of Ga-Br much longer than B-Br. The increase in size also meant that the orbitals are more diffused for Ga as compared to B, hence the contributions due to π interactions between Ga and Br are much lower. As a result, the bond distance reported above is not much difference as the one reported in literature. However, a major assumption made in the above calculations was to assume that the calculations done by Gaussview were correct. This may not necessary be the case and these values obtained via computational method can be subjected to changes especially when operating under different basis sets.
Borane Optimisation
Using B3LYP with basis set:3-21G
| summary data | Summary | convergence | Jmol | |||
|---|---|---|---|---|---|---|
| File:JNBH3 OPT2.LOG | 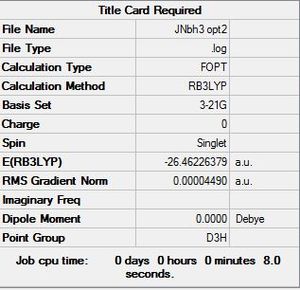
|
  Item               Value     Threshold  Converged?
 Maximum Force            0.000090     0.000450     YES
 RMS     Force            0.000059     0.000300     YES
 Maximum Displacement     0.000350     0.001800     YES
 RMS     Displacement     0.000229     0.001200     YES
 Predicted change in Energy=-4.546985D-08
 Optimization completed.
    -- Stationary point found.
|
|
Using B3LYP with basis set:6-31G (d,p)
| summary data | Summary | convergence | Jmol | |||
|---|---|---|---|---|---|---|
| File:JNBH3 OPT2 631G DP.LOG | 
|
        Item               Value     Threshold  Converged?
 Maximum Force            0.000010     0.000450     YES
 RMS     Force            0.000006     0.000300     YES
 Maximum Displacement     0.000039     0.001800     YES
 RMS     Displacement     0.000025     0.001200     YES
 Predicted change in Energy=-5.631660D-10
 Optimization completed.
    -- Stationary point found.
|
|
BBr3 optimisation using mix basis set (B3LYP/6-31G(d,p)LANL2DZ
Optimised file: DOI:10042/193785
| summary data | Summary | convergence | Jmol | |||
|---|---|---|---|---|---|---|
| File:JN BBr3opt 631G dp HPCcomplete.log | 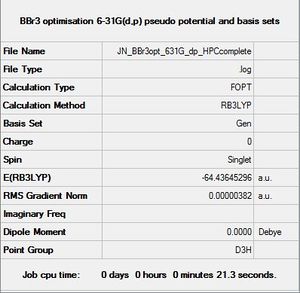
|
        Item               Value     Threshold  Converged?
 Maximum Force            0.000008     0.000450     YES
 RMS     Force            0.000005     0.000300     YES
 Maximum Displacement     0.000036     0.001800     YES
 RMS     Displacement     0.000023     0.001200     YES
 Predicted change in Energy=-4.027380D-10
 Optimization completed.
    -- Stationary point found.
|
|
GaBr3 optimisation
optimised file: DOI:10042/193784
| summary data | Summary | convergence | Jmol | |||
|---|---|---|---|---|---|---|
| File:JN GaBr3 pp opt HPCcomplete1.log | 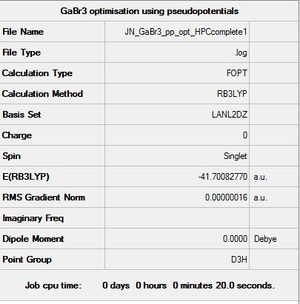
|
         Item               Value     Threshold  Converged?
 Maximum Force            0.000000     0.000450     YES
 RMS     Force            0.000000     0.000300     YES
 Maximum Displacement     0.000003     0.001800     YES
 RMS     Displacement     0.000002     0.001200     YES
 Predicted change in Energy=-1.307756D-12
 Optimization completed.
    -- Stationary point found.
|
|
Answers to questions
What is a bond?
There are different types of chemical bonds for example, ionic, metallic and convalent bonds. The present course will aim to cover only covalent bonding as it is the most suitable model in describing the following EX3 species in this module. A chemical bond between two atoms cannot be explained using classical physics, hence quantum mechanics have to be employed in order to understand what is a bond. With the aid of Schrodinger equation, it can provide some insights in explaining what is a bond. However, in order to simply the calculations, an assumption has to be made when solving the Schrodinger equation and that is the Born-Oppenheimer approximation (BOA). BOA states that the position of the nuclei is fixed at both ends of the bond and that electron motions are much faster than nuclei motions. Using this approximation, the energy of the system is said to be independent of the nuclear motion and thus, no kinetic contributions by the nuclei in the Hamiltonian equation. However, this in reality is not true as we know that the bond length does varies due to oscillations of the molecule. On closer examinations, we assumed that the electrons within the bond changes accordingly to the nuclear motion. When describing a bond, it is understood that there are two electrons in every bonding orbitals. Using BOA and solving the Schrodinger equations at different nuclear separations, we can obtained the potential energy curve of the molecule (assuming that there is no kinetic energy contributions). The minimum point on that curve will denote the equilibrium bond length of the molecule. Hence when it comes to drawing the molecules of the following EX3 (E=B, Ga) species, they are drawn as trigonal planar as it is their lowest possible energy conformations. This structure also represents that the distance between nuclei are at the optimum (i.e minimum potential energy). The surrounding electrons are "bound" between the nuclei and the electron density is shared between the two nuclei.
So what exactly is a bond?
A chemical bond is more of a concept and it is not "real" as in we can physically see a line attaching two atoms. Through computational method (in this case using gaussian program), what the program does is it tries to solve the Schrodinger equation to determine where the electrons are likely to be found between the two nuclei. Hence, the location of this "shared" electron density between the two atoms will then be showed as a bond that connects the two atoms.This can be explained using Valence Bond Theory. VB theory can be considered one of the fundamental principles in describing the theory of bonding before the development of MO theory. So, consider two nuclei (A and B) with one electron each (1 and 2 respectively) are separated far apart. The total wavefunction of the two nuclei can be considered as:

As the two nuclei come closer together, it is hard to differentiate if the electron 1 is on atom A or on B and vice versa since electrons are indistinguishable. Therefore, because the probability is the same, using quantum mechanics, the true state of the system when the two nuclei are close will be the superposition of the wavefunction for each probability. The wavefunction will thus be denoted as:

The "+" combination of the wavefunction will result in a lower energy for that linear combination, it indicates that the waves of interfere constructively. As a results, there is a higher probability to find both electrons within the internuclear region. This increased in probability density of electron within the internuclear region is called a bond.
Strength of bonding
In reality for covalent bonding, classifying whether a molecule has strong, medium or weak bonds can be subjective. A better way to determine the strength of a bond is to compare between two different species. For instance, we can compare the bond strength of B-Br and Ga-Br and rationalise that B-Br bond is relatively strong than Ga-Br bond because of its size and π stabilisation between vacant p orbitals of B and filled p orbitals of Br. We can also compare the strength of a bond within the same molecule for instance, N-N single bond is a weaker bond than N-N triple bond similar argument can be used for oxygen bonding. Other diatomic bonding such as halogens are generally weaker compared to oxygen or nitrogen because of having more lone pair of electrons which may lead to some form of repulsion due to proximity of the nuclei. The explanation above only accounts for the strength of covalent bonding and only for simple molecules. When it comes to explaining more complex systems for instance a 3 centred-2 electrons bond (3c-2e) (i.e can be a bridging hydrogen between two central atoms), the bond is weaker as compared to a terminal bond between two atoms due to the electron density is spread out even more in 3c-2e bond system.
An example of strong, medium and weak bonding are shown in the table below:
| Strength of Bonding | Strong | Medium | Weak |
|---|---|---|---|
| Example | N-N (triple bond) | O-O(double bond) | I-I (single bond) |
| Dissociation energy (kJ/mol) | 945 | 497 | 151 |
As mentioned earlier, there are other types of bonding apart from convalent and the strength of ionic and metallic bonding are generally much stronger than convalent bonding due to the strong electrostatic forces of attractions between the positive charged and negative charged species.
In some structures gaussview does not draw in the bonds where we expect, why does this NOT mean there is no bond?
One of the reasons why Gaussview does not draw a bond is because in Gaussview, there is a set of defined values for a given type of bond. Taking Borane as an example, Gaussview shows all three B-H bonds, however, when drawing the dimer of BH3, Gaussview does not show the bonds between the bridging hydrogen atom and the boron atoms. This is because the bridging B-H-B bond is weak and it falls out of range in the define value of B-H bond in Gaussview program. As a results, no bonds were drawn between the bridging hydrogen and boron atoms. However, this does not necessary means that there is no bond present. It is simply a form of limitation present in the program. Knowing this, it should be noted when trying to optimise the structure, it should not be done in low level calculations but instead perform a higher level calculation (i.e higher basis set) in order to obtain a more accurate bond optimisation result and structure of the molecule.
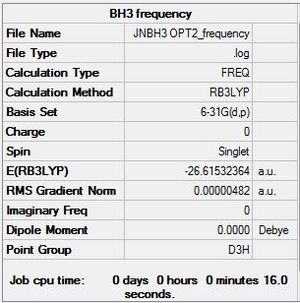
Frequency analysis of BH3
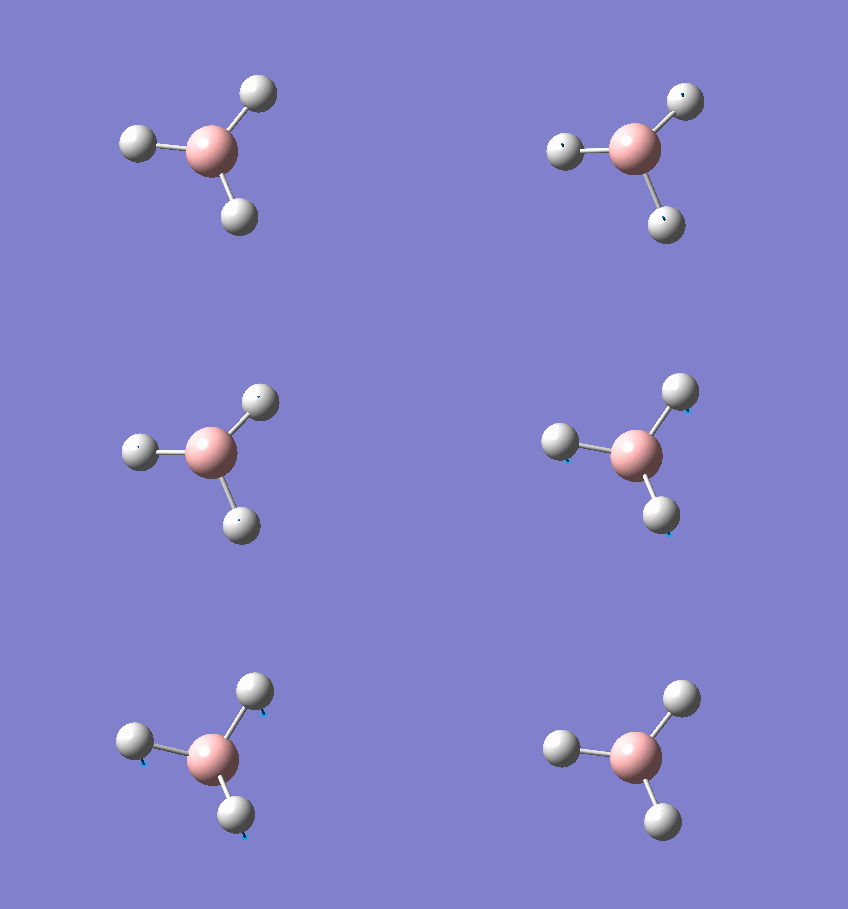
frequency file click: File:JNBH3 OPT2 FREQUENCY.LOG
| Summary | low modes |
|---|---|
|
Low frequencies --- -14.1279 -14.1235 -10.2897 0.0002 0.0177 0.3550 Low frequencies --- 1162.9544 1213.1254 1213.1257 |
Vibrational Spectrum of BH3
Questions
Explain why are there less than six peaks in the spectrum, when there are obviously six vibrations.
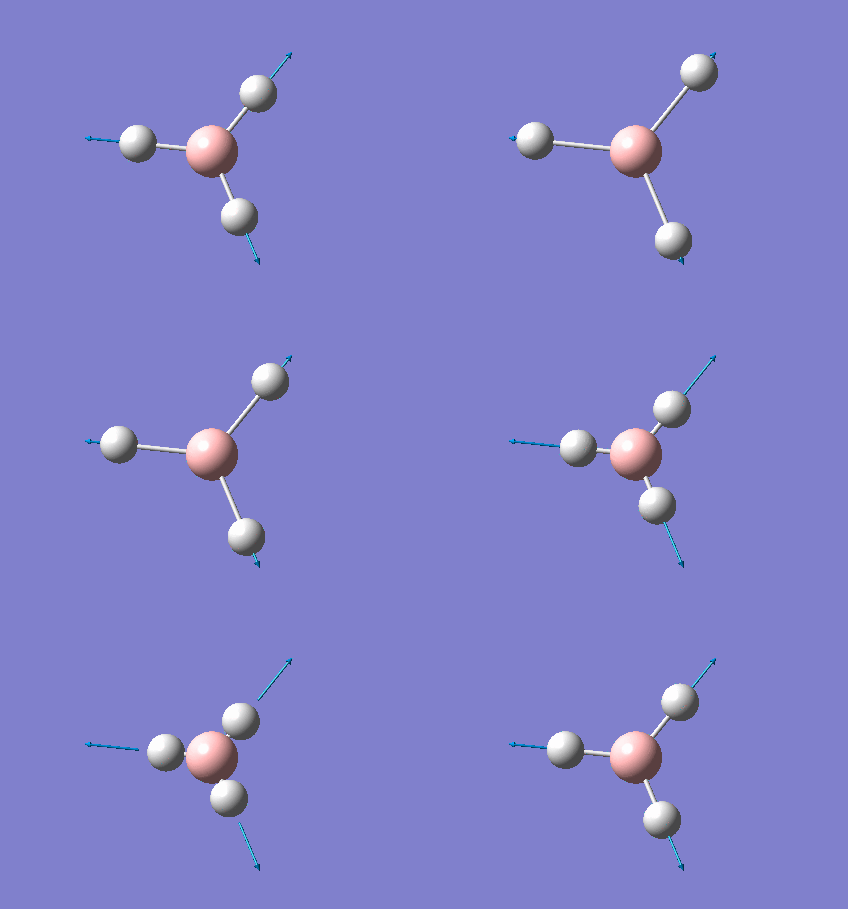
Looking at BH3, it is a non linear molecule and hence it has 6 modes of vibrations based on 3N-6 where N is the number of atoms. However, in order to observe the vibration modes in the IR spectrum, there must be a change in symmetry or dipole moment during excitation. Looking at the vibration wavenumber table above, 2583 cm-1 correspond to a symmetric stretch (i.e no change in dipole moment) and hence will not be observed in the IR spectrum. Therefore for BH3, while there are 6 modes of vibrations, only 5 peaks will be visible in the IR spectrum. It should also be noted the intensity of some peaks might be too small in comparision with other peaks and hence may not be that visible in the spectrum but that does not mean the vibration mode is not IR active.
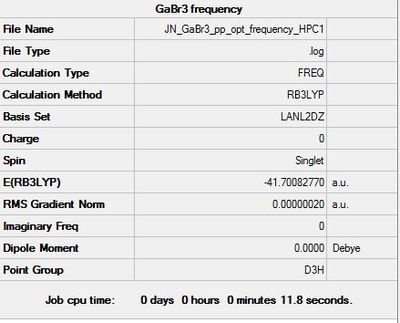
Frequency analysis of GaBr3
frequency file click: DOI:10042/193786
| Summary | low modes |
|---|---|
|
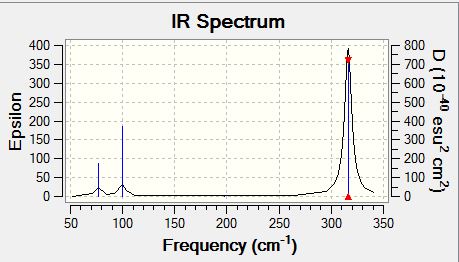
Low frequencies --- -1.4878 -0.0015 -0.0002 0.0096 0.6540 0.6540 Low frequencies --- 76.3920 76.3924 99.6767 |
| wavenumber | intensity | IR active | type | animations |
|---|---|---|---|---|
| 76 | 3 | yes | bent | 
|
| 76 | 3 | yes | bent | 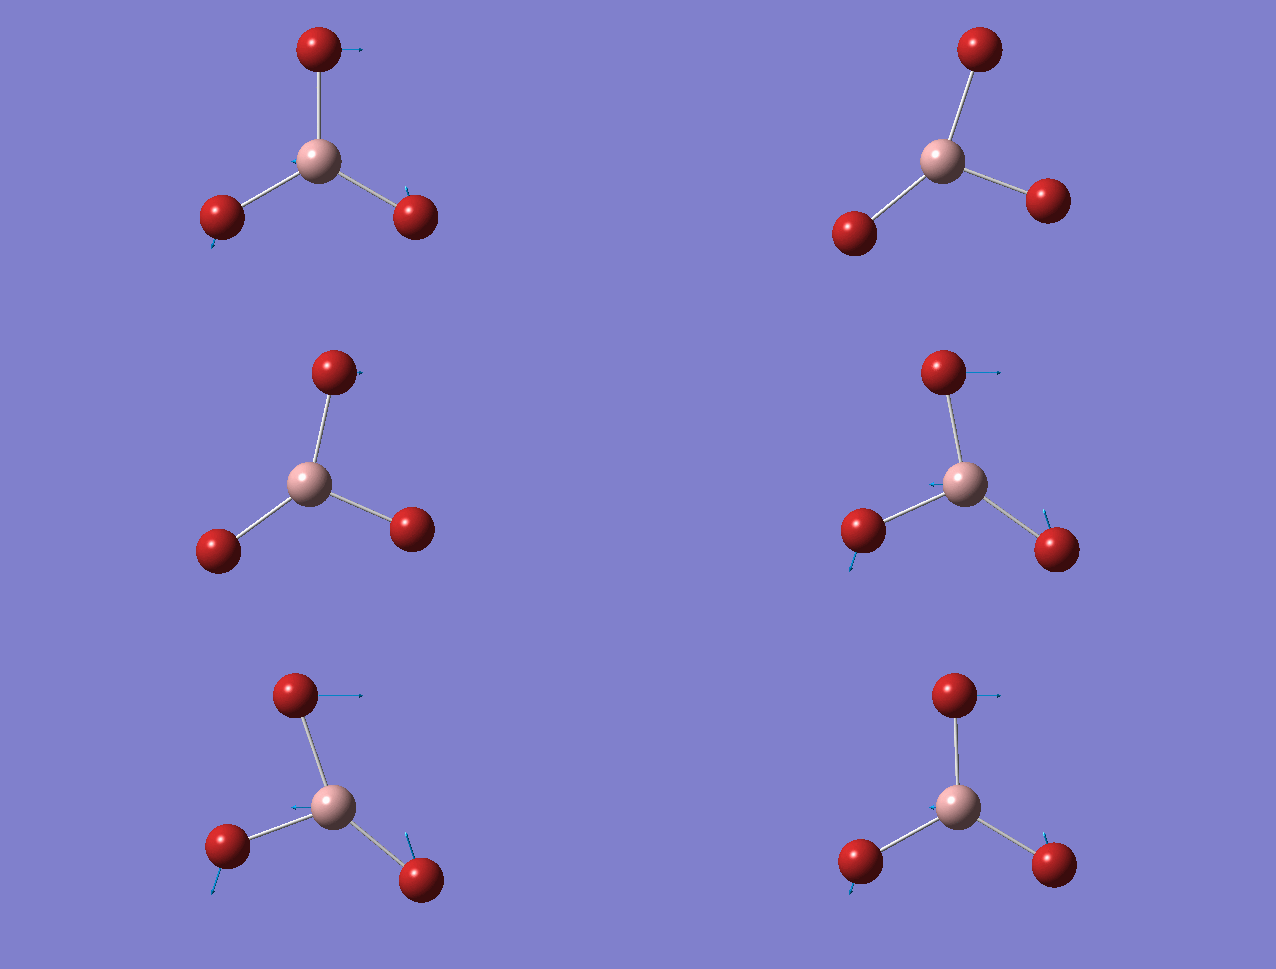
|
| 100 | 9 | yes | bent | 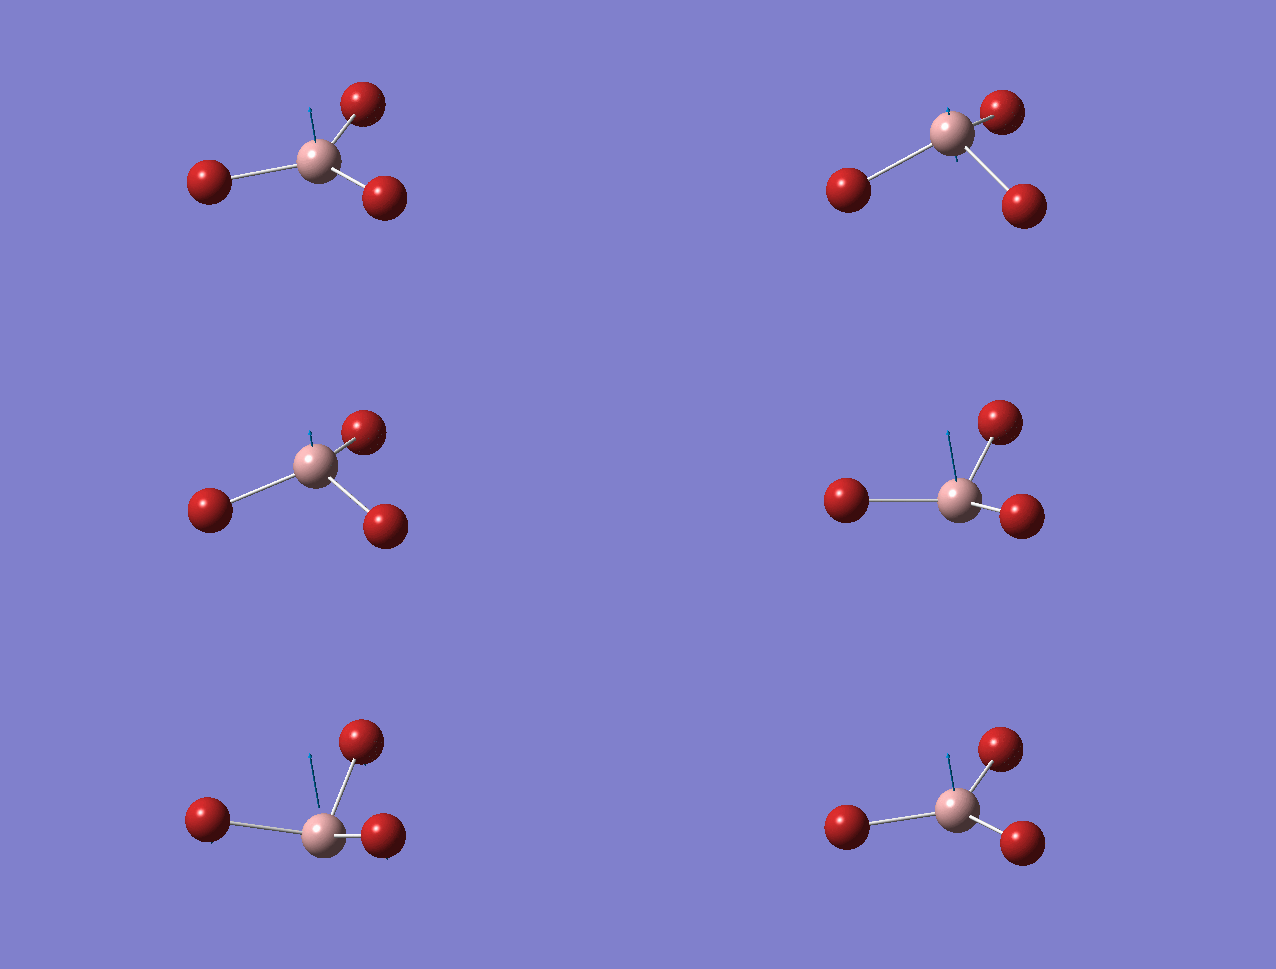
|
| 197 | 0 | no | symmetric stretch | 
|
| 316 | 57 | yes | asymmetric stretch | 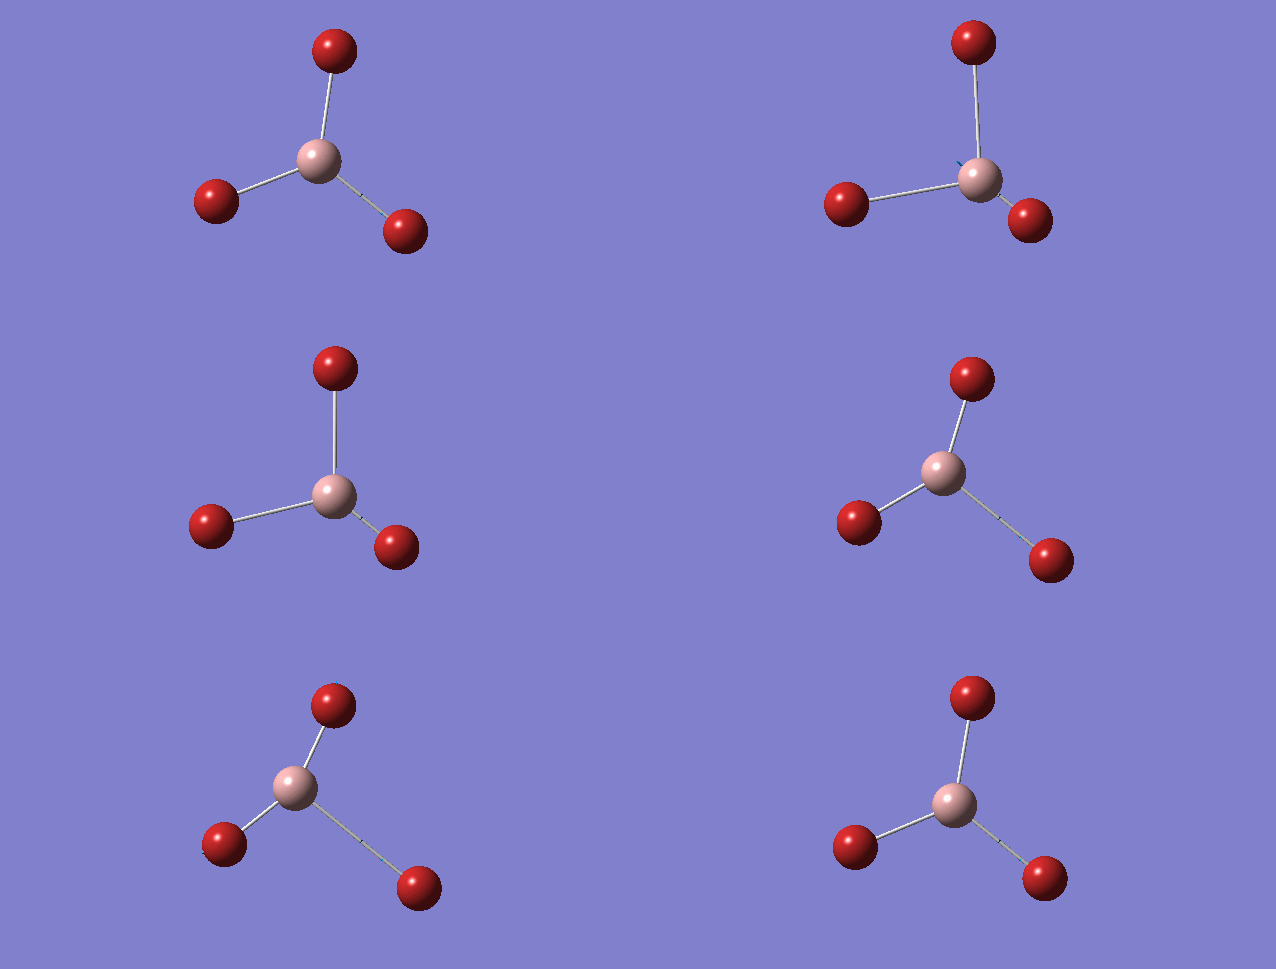
|
| 316 | 57 | yes | asymmetric stretch | 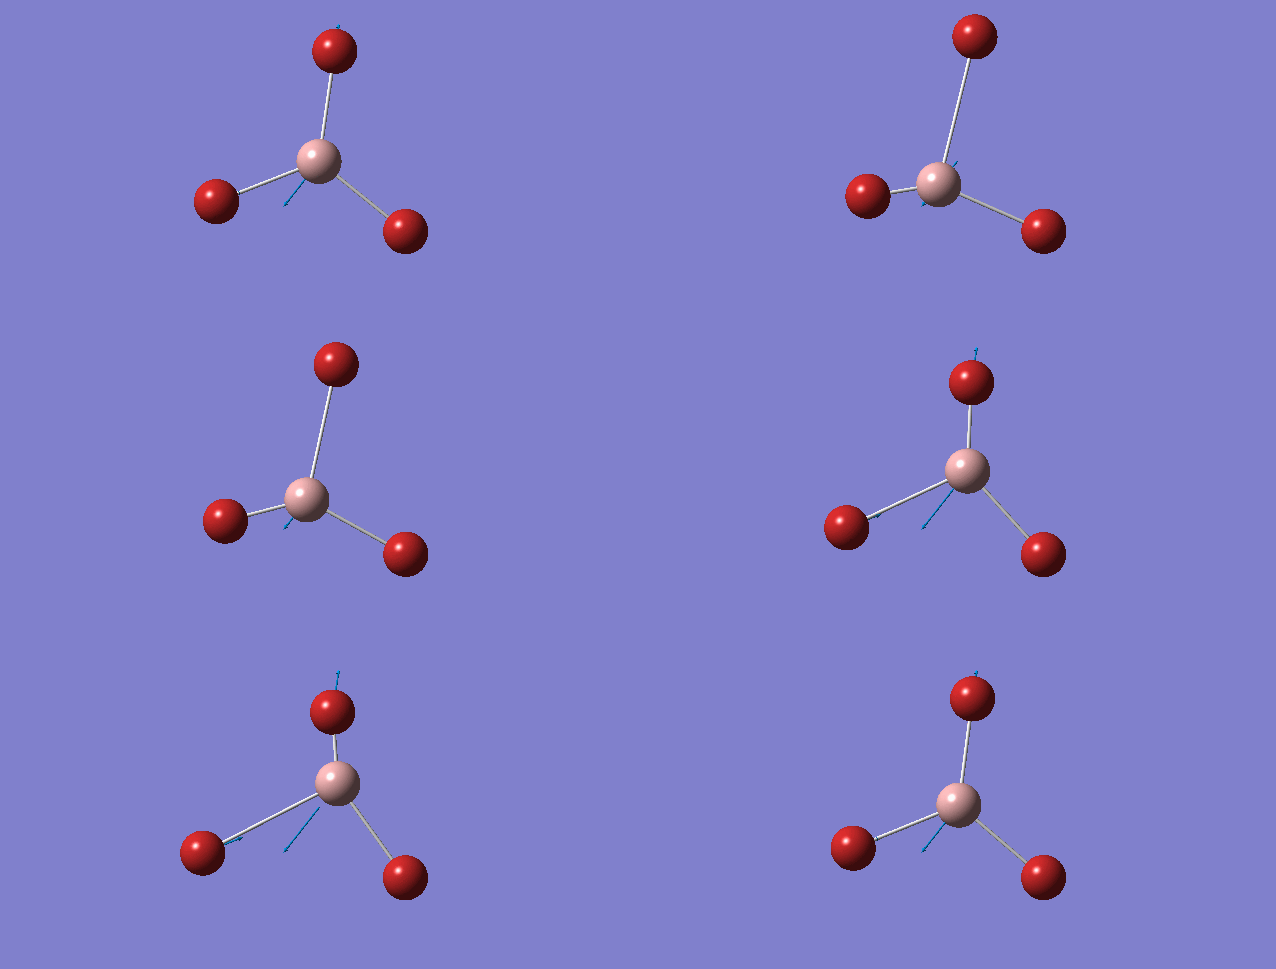
|
Questions
There been a reordering of modes. This can be seen particularly in relation to the A2" umbrella motion. Compare the relative frequency and intensity of the umbrella motion for the two molecules. Looking at the displacement vectors how has the nature of the vibration changed? Why?
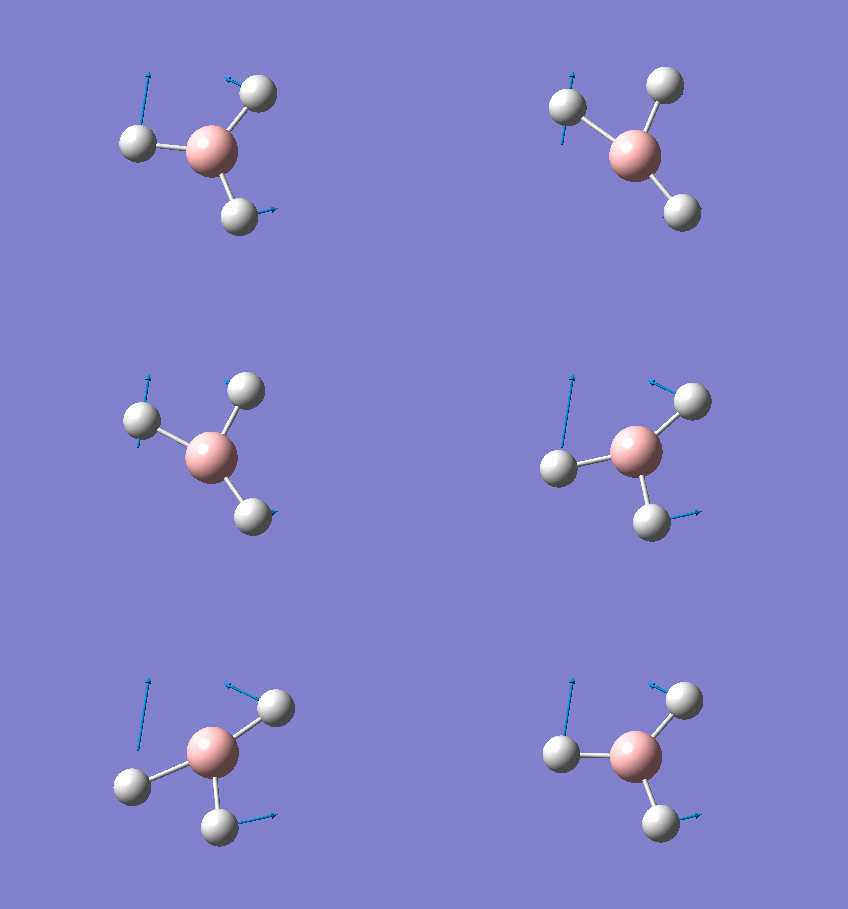
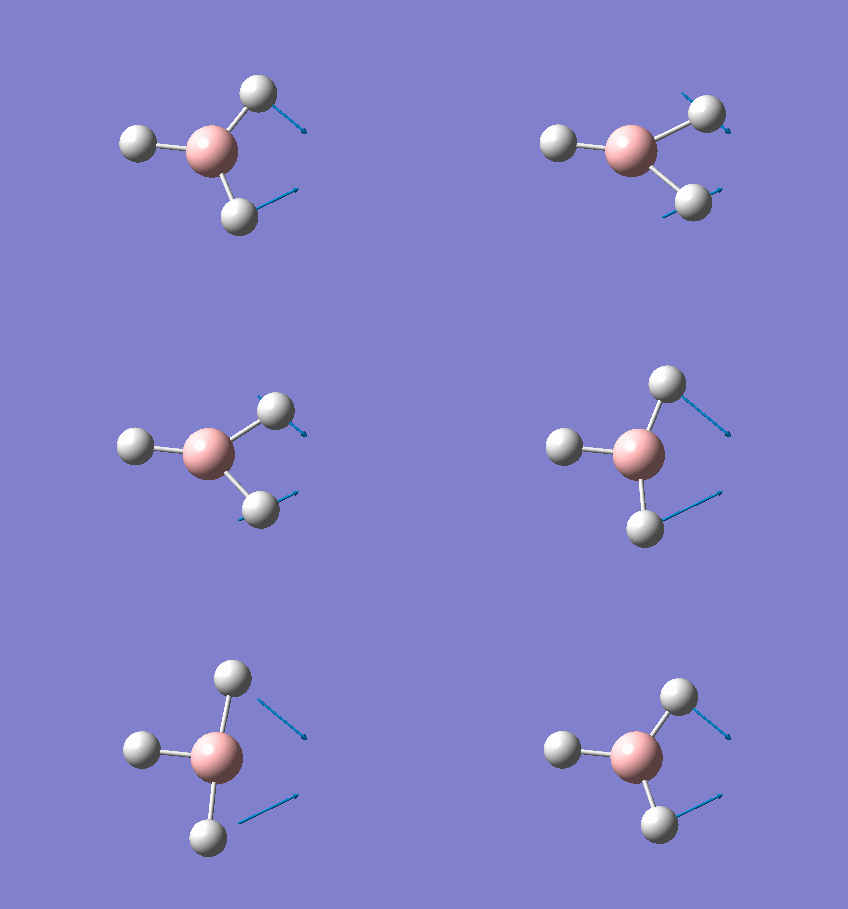
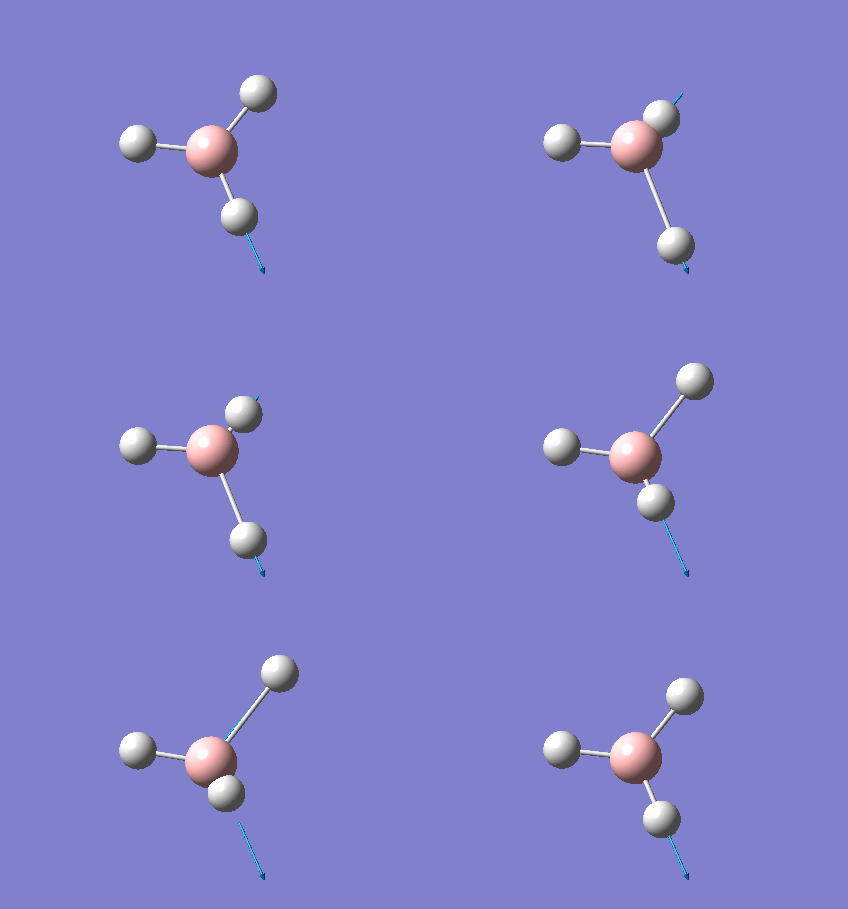
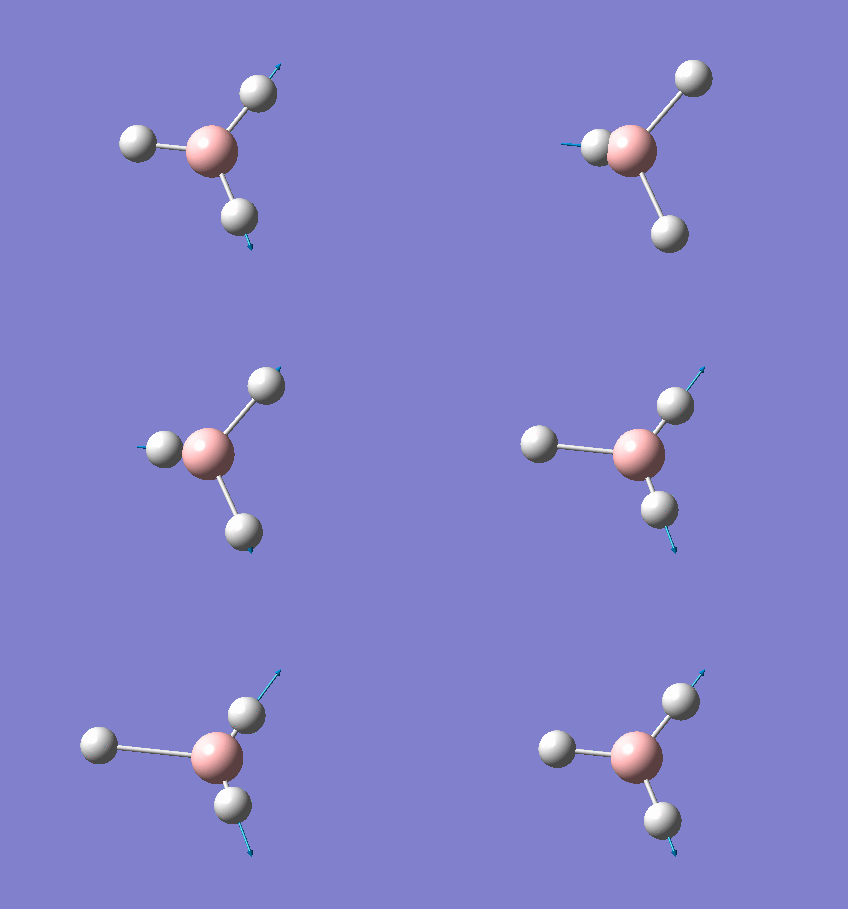
Looking at the A2" umbrella motion, for BH3, it occurs at the 1163 cm-1 while for GaBr3, it occurs at 100 cm-1. The lower frequency wavenumber is observed for GaBr3 is because GaBr3 has a larger reduced mass and lower spring constant (see below for further discussion), hence resulting in a smaller vibrational wavenumbers. By examining the displacement vector of both molecules, what is peculiar about these two modes of vibrations is that for the umbrella motion of BH3, the displacement vector is on the H atom (i.e Hydrogen is moving up and down along the displacement vector). In contrast, for GaBr3 the displacement vector lies on the central Ga atom. One common aspect of this umbrella motion is that the displacement vector lies on the lighter atom of the molecule.
What does the large difference in the value of the frequencies for BH3 compared to GaBr3 indicate?
Under IR spectroscopy, it creates excitation of bonds and causes bond vibrations. These bond vibrations in turn create absorption bands and the intensity of these absorption is dependent on the change of dipole moment. Dipole moment arise due to two factors: charge differences and bond length. Looking at charge differences, it can be examined using the electronegativity of the corresponding atoms in the structure. The greater the electronegativity, the stronger the absorption. So what does the wavenumbers tell us in the IR spectrum? The wavenumbers absorbed indicates the frequency level at which energy is absorbed. The mass of the molecule and strength of bond are two crucial factors in determining the stretching energy in the IR spectrum. This can be explained by treating the two atoms as a spring that obeys the Hooke's law (equation shown below)

Hence looking at the structure BH3 and GaBr3, BH3 will have a higher stretching frequency because it has a smaller reduced mass and the bond strength (analogous to spring constant) of B-H is stronger than Ga-Br due to better overlapping of atomic orbitals. As a results, the vibration wavenumbers for BH3 will be much larger compared to GaBr3.
Why must you use the same method and basis set for both the optimisation and frequency analysis calculations? What is the purpose of carrying out a frequency analysis? What do the "Low frequencies" represent?
One of the most important factors when comparing structures is that the calculations must be done using the same method and basis set. This is because changing the basis set and method will lead to changing the level of accuracy when computing the optimised structure. This can potentially lead to a large difference in the recorded energies or even the bond length and hence will not be an accurate comparision between structures. The role of optimising a structure is to find out the geometry that gives the lowest possible energy. Having acheieved that, frequency analysis is conducted to ensure that the structure is indeed optimised correctly. During optimisation calculation, it can only compute in such a way that it leads to an energy gradient of zero. However, this could indicate either a minimum or a maximum point with the maximum point representing as transition state and the minimum point representing the optimised structure. Frequency analysis giving positive values confirms that the structure is indeed the optimised strucutre. Even in the optimised structure, there can be some distortions due to rotational and translational of the molecule and these are reflected as the low frequencies.
BH3 Molecular Orbitals Analysis using basis set B3LYP/6-31G
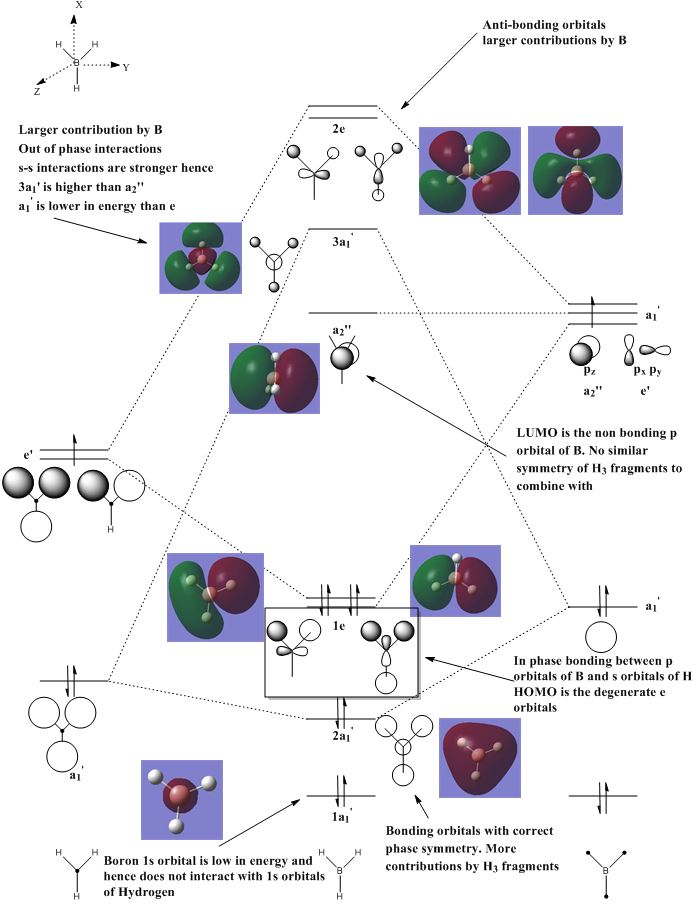
Questions
Are there any significant differences between the real and LCAO MOs? What does this say about the accuracy and usefulness of qualitative MO theory?
Examining the real molecular orbitals (MO) of BH3 with the Linear Combination of Atomic Orbitals Molecular Orbitals (LCAO MO), it seemed that the appearances and the phases of the real MO obtained from calculations were fairly similar to the LCAO MOs. One possible reasons for such close in similarity between the real MOs and the LCAO MOs is perhaps the similarity of electronegativity between B and H atoms. This allows even distribution of MOs in terms of shape and sizes. However, the accuracy of predicting MOs through LCAO may falls when it comes to a more complex molecule such as having constituents atoms with significant difference in electronegativities (this will be covered in the later section). Complex molecules molecular orbitals may be different as predicted from LCAO MOs when looking at unoccupied MOs at higher energy level, as the orbitals may be skewed or deform in order to minimise any unfavourable interactions and in this case, it may not be that useful to use qualitative MO theory to discuss the bonding interactions of the molecule.
NH3 Optimisation and Frequency analysis
Optimisation using B3LYP with basis set:6-31G (d,p)
| summary data | Summary | convergence | Jmol | |||
|---|---|---|---|---|---|---|
| File:NH3 OPT 631G DPTRIAL1.LOG | 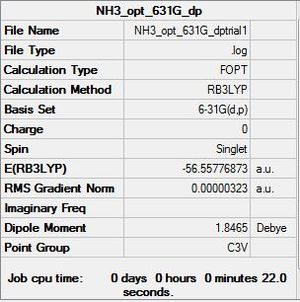
|
       Item               Value     Threshold  Converged?
 Maximum Force            0.000006     0.000450     YES
 RMS     Force            0.000004     0.000300     YES
 Maximum Displacement     0.000012     0.001800     YES
 RMS     Displacement     0.000008     0.001200     YES
 Predicted change in Energy=-9.846084D-11
 Optimization completed.
    -- Stationary point found.
|
|
| Parameter | NH3 |
|---|---|
| r(E-X) | 1.02 |
| θ(X-E-X) | 105.0°, 37.1° |
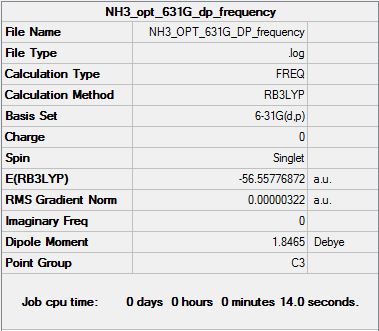
Frequency analysis of NH3
Frequency log files click: File:NH3 OPT 631G DP FREQUENCY.LOG
| Summary | low modes |
|---|---|
|
Low frequencies --- -0.0137 -0.0025 0.0013 7.0781 8.0927 8.0932 Low frequencies --- 1089.3840 1693.9368 1693.9368 |
| wavenumber | intensity | IR active | type | click for animations |
|---|---|---|---|---|
| 1089 | 145 | yes | bent | 
|
| 1694 | 14 | slightly | bent(wag) | 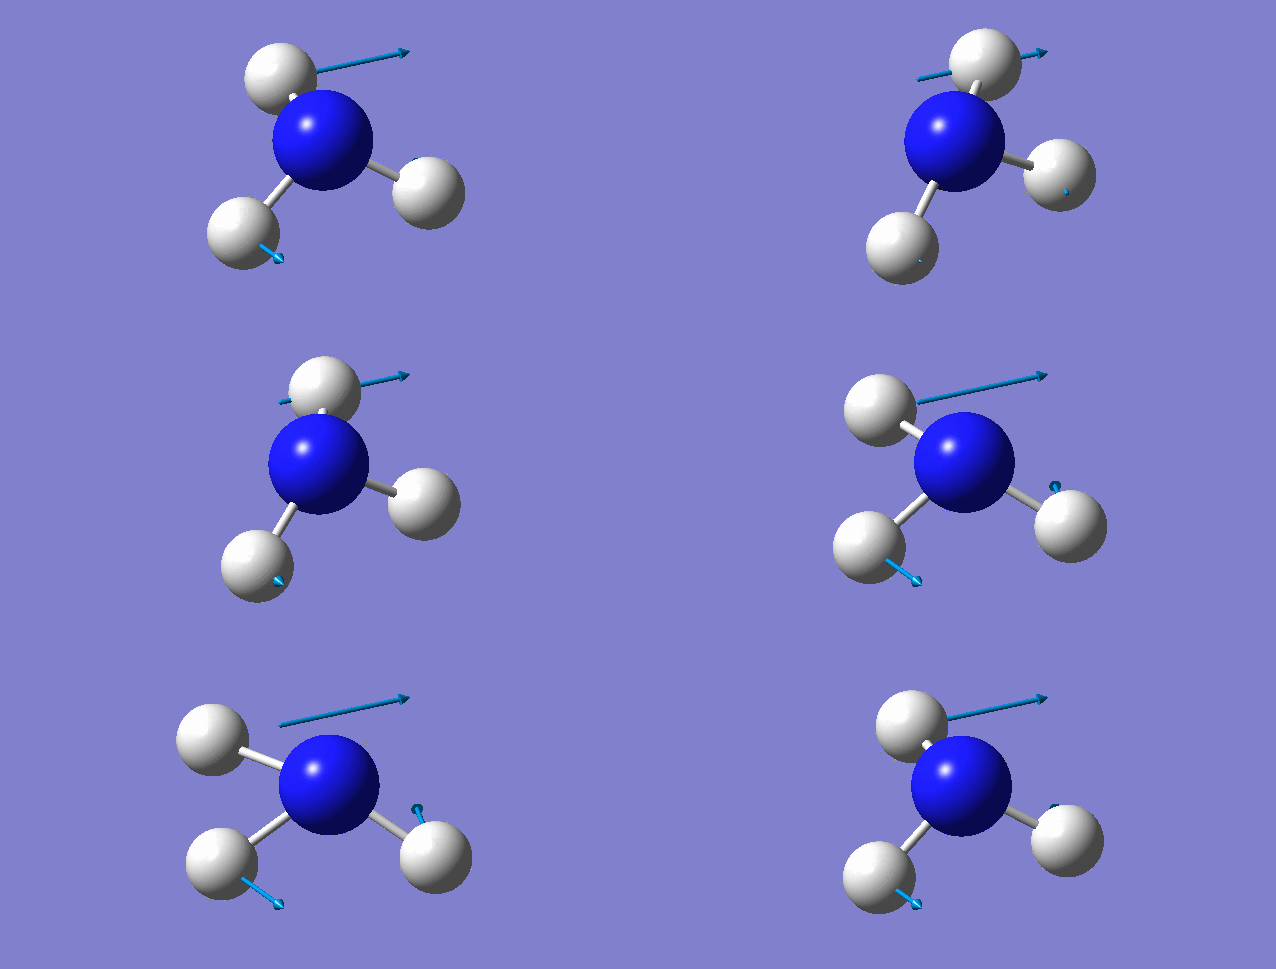
|
| 1694 | 14 | slightly | bent(scissor) | 
|
| 3461 | 1 | no | symmetric stretch | 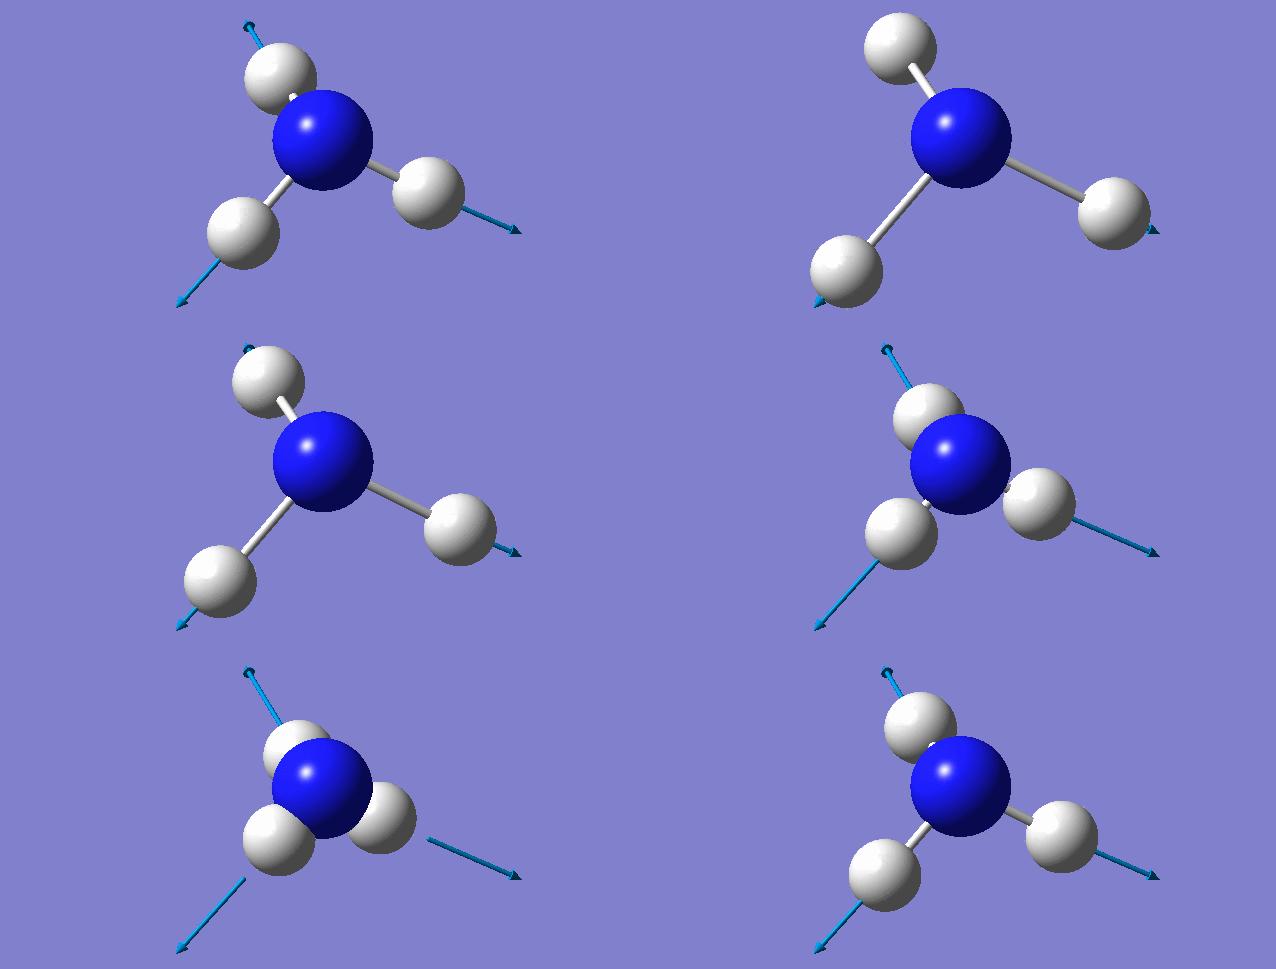
|
| 3590 | 0 | no | stretch | 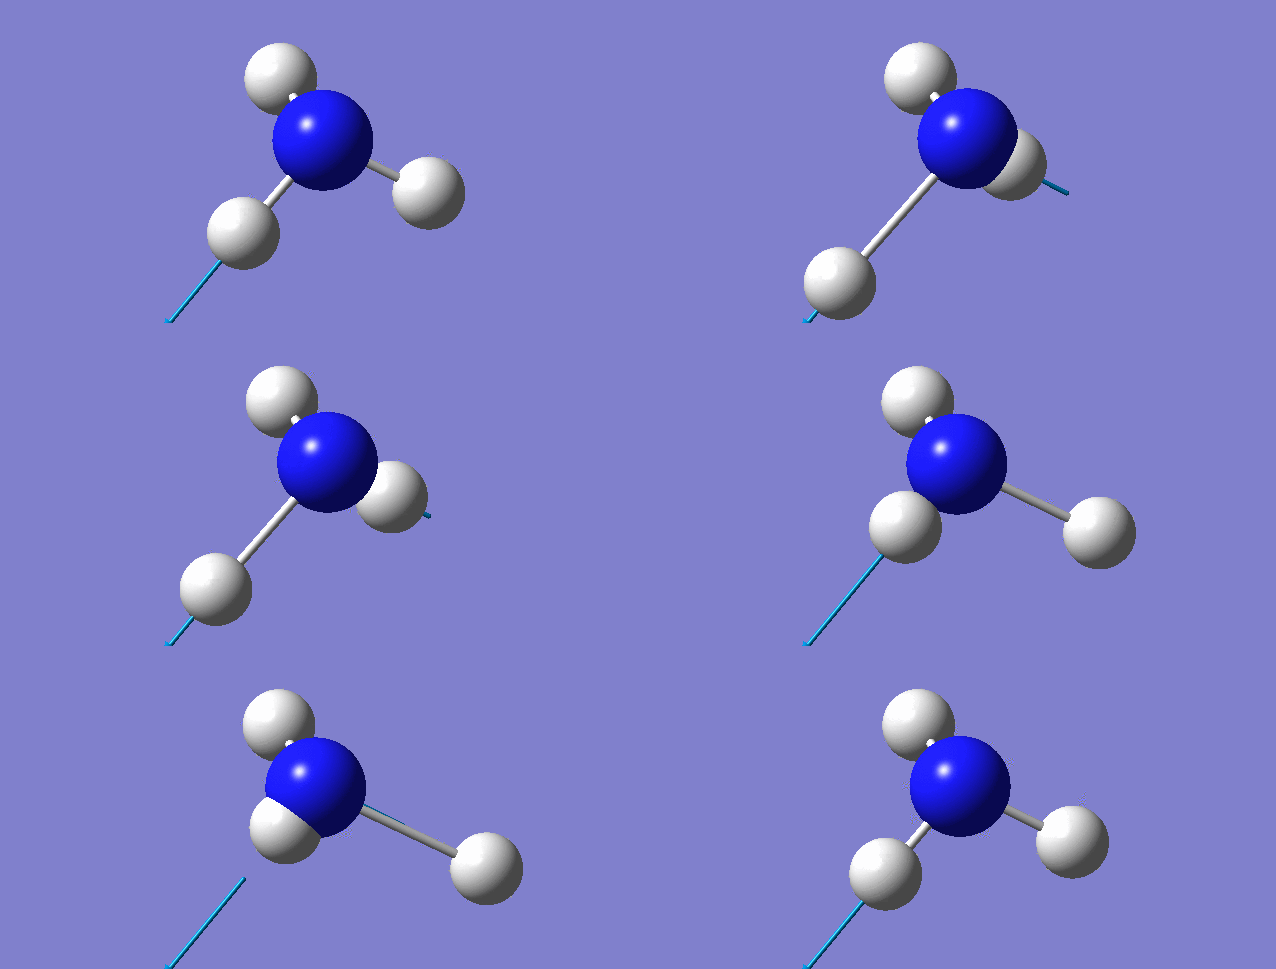
|
| 3590 | 0 | no | stretch | 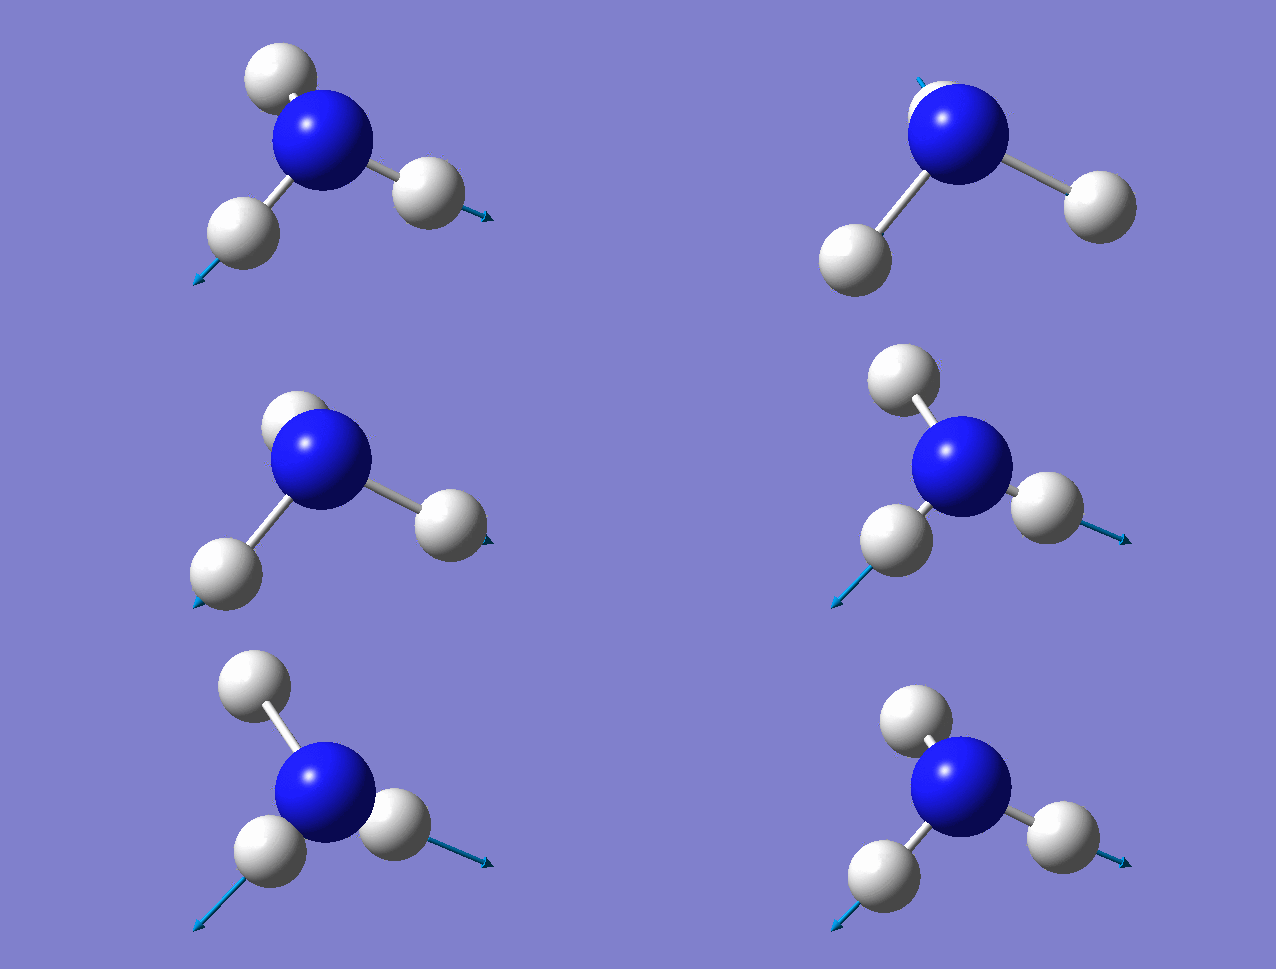
|
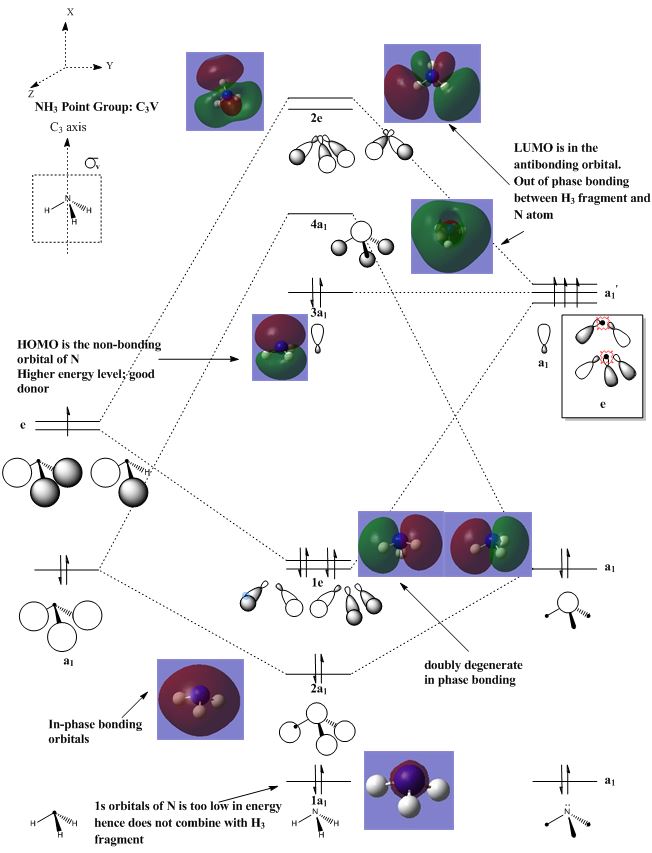
MO and population analysis of NH3
Population analysis: DOI:10042/193797
| Atom | Charge |
|---|---|
| N | -1.11 |
| H | 0.37 |
Analysising the charge distribution of NH3
Looking at the charge distribution table above, the value obtained for N and H atoms are in agreement with theoretical knowledge. Nitrogen being a more electronegative element will acquire a negative charge and has a higher propensity to pull electron density towards itself, thus aquiring a higher value (in terms of magnitude). The negative sign indicates that it is a more electronegative atom. For hydrogen, because there is a pull of electron density towards the nitrogen atom, the value is less than 1 and it is positive because it is more electropositive than nitrogen.
Analysis of NH3BH3 adduct
Optimisation using B3LYP with basis set:6-31G (d,p)
| summary data | Summary | convergence | Jmol | |||
|---|---|---|---|---|---|---|
| File:JN NH3BH3 OPT 631G DP.LOG | 
|
       Item               Value     Threshold  Converged?
 Maximum Force            0.000122     0.000450     YES
 RMS     Force            0.000058     0.000300     YES
 Maximum Displacement     0.000513     0.001800     YES
 RMS     Displacement     0.000296     0.001200     YES
 Predicted change in Energy=-1.631175D-07
 Optimization completed.
    -- Stationary point found.
|
|
Frequency analysis of NH3BH3
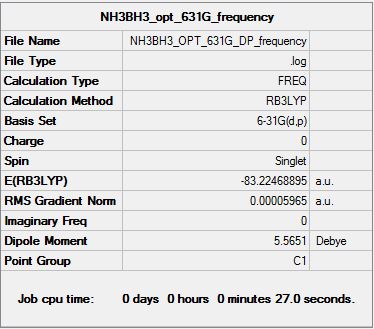
Frequency log files click: File:JN NH3BH3 OPT 631G DP FREQUENCY.LOG
| Summary | low modes |
|---|---|
|
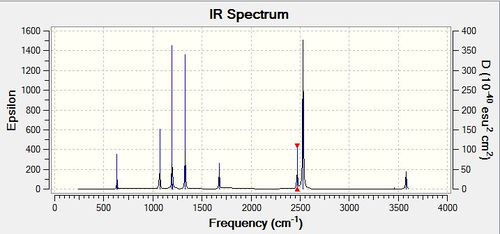
Low frequencies --- -0.0008 0.0005 0.0013 17.1660 17.5746 37.3520 Low frequencies --- 265.9185 632.2125 639.3528 |
| wavenumber | intensity | IR active | type | click for animations |
|---|---|---|---|---|
| 266 | 0 | no | bent | Media:JN_NH3BH3_266frequency.ogg |
| 632 | 14 | slightly | stretch | Media:JN_NH3BH3_632frequency.ogg |
| 639 | 4 | no | bent | Media:JN_NH3BH3_639frequency1.ogg |
| 639 | 4 | no | bent | Media:JN_NH3BH3_639frequency2.ogg |
| 1069 | 41 | yes | bent | Media:JN_NH3BH3_1069frequency1.ogg |
| 1069 | 41 | yes | bent | Media:JN_NH3BH3_1069frequency2.ogg |
| 1196 | 109 | yes | bent | Media:JN_NH3BH3_1196frequency.ogg |
| 1204 | 3 | no | bent | Media:JN_NH3BH3_1204frequency1.ogg |
| 1204 | 3 | no | bent | Media:JN_NH3BH3_1204frequency2.ogg |
| 1329 | 114 | yes | bent | Media:JN_NH3BH3_1329frequency.ogg |
| 1676 | 28 | yes | bent | Media:JN_NH3BH3_1676frequency1.ogg |
| 1676 | 28 | yes | bent | Media:JN_NH3BH3_1676frequency2.ogg |
| 2470 | 67 | yes | stretch | Media:JN_NH3BH3_2470frequency.ogg |
| 2530 | 231 | no | stretch | Media:JN_NH3BH3_2530frequency1.ogg |
| 2530 | 231 | no | stretch | Media:JN_NH3BH3_2530frequency2.ogg |
| 3463 | 3 | no | stretch | Media:JN_NH3BH3_3463frequency.ogg |
| 3580 | 28 | yes | stretch | Media:JN_NH3BH3_3580frequency1.ogg |
| 3580 | 28 | yes | stretch | Media:JN_NH3BH3_3580frequency2.ogg |
Determination of bond dissociation energy
E(NH3)= -56.55776873 a.u E(BH3)= -26.61532364 a.u E(NH3BH3)= -83.22468893 a.u
ΔE=E(NH3BH3)-[E(NH3)+E(BH3)]
ΔE= -0.05159656 a.u (-135.47 kJmo1-1)
Question: With reference to your earlier discussion on the strength of bonds (weak, medium or strong) is the association of NH3 and BH3 to form a B-N bond within NH3BH3 weak, medium or strong.
In earlier section, the strength of bonding was discussed and a table was presented showing examples of a strong, medium and weak covalent bonding. Based on the table shown earlier, it can be observed that the bond strength for the association of NH3 and BH3 to form an adduct can be seen as a weak bonding interaction.
Project section: Lewis acid and bases
From the first part of the project, we have examined simple EX3 molecules by looking at its optimised structures as well as conducting frequency analysis on these compounds. We have also examined in detail what exactly constitutes a bond and some of the limitations that might occur when performing computational work using Gaussview. In the present section, we will examine the formation of dimer from AlCl2Br monomer. We will also look at optimising all 6 different type of possible isomers of the dimer and examining its relative energies. Lastly we will also perform frequency analysis on each of these isomers.
Note: All optimisation calculations for all 6 isomers were performed using identical basis sets for Al and Cl (6-31G, d,p) with pseudo potentials for Br atom (LANL2DZ).
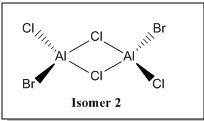
There are 6 possible isomers for the dimer [AlCl2Br]2 of which their structures can be easily determine except isomer 6. Isomer 6 can be obtained by a dynamic exchange of ligands as shown below:

The table below shows the summarised data of all 6 possible optimised isomers with their respective energies
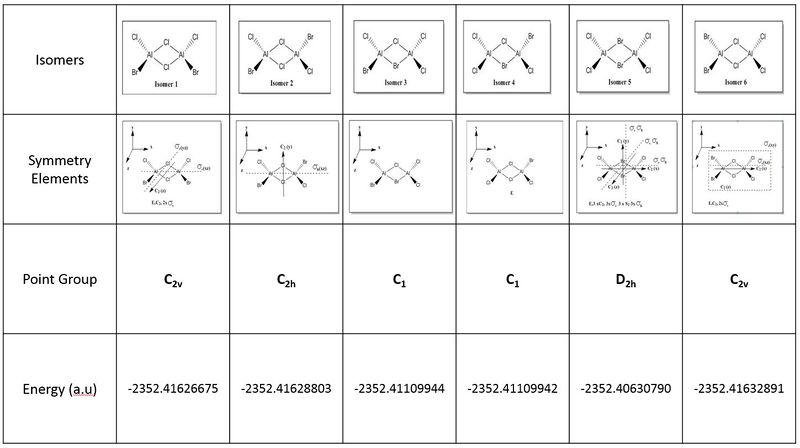
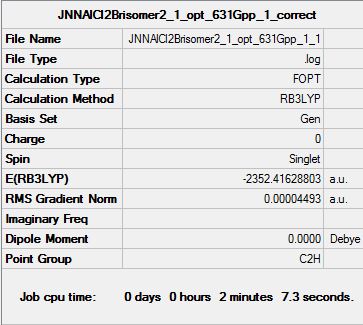
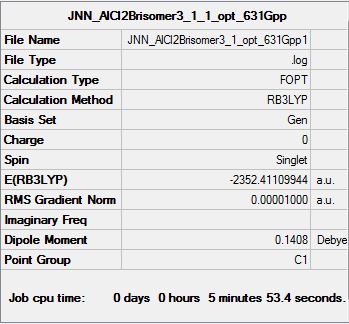
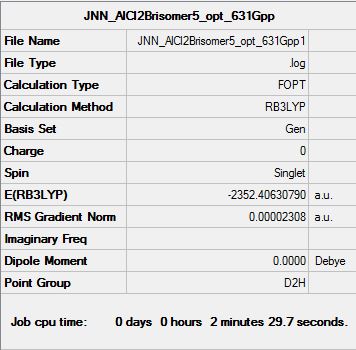
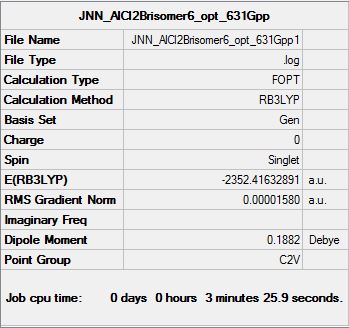
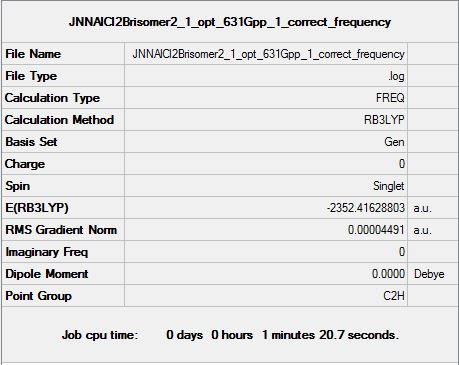
All 6 isomers were optimised and the (.log) file was examined to ensure there was proper convergence for each isomers after each optimisation. These values are tabulated and shown below under the following sub-section (Raw data for optimisation) each isomer's D-space link shown below. It should be noted that during the first optimisation, gaussview was unable to provide the right symmetry for each of the molecules and hence, symmetry was imposed and under "Very tight" restriction before conducting optimisation of structures. From the above calculations, it was observed that isomer 6 has the lowest energy value and hence it is the most stable molecule (see the following sub section for further discussion).
Raw data for optimisation of all 6 isomers
| Isomers | 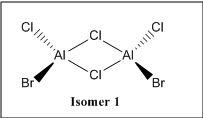 |
 |

| |||||||||
|---|---|---|---|---|---|---|---|---|---|---|---|---|
| Summary data (.log) | File:JNNG AlCl2Brisomer1 opt 631Gpp 1.log | File:JNNAlCl2Brisomer2 1 opt 631Gpp 1 1.log | File:JNN AlCl2Brisomer3 1 opt 631Gpp1.log | |||||||||
| Summary Table | 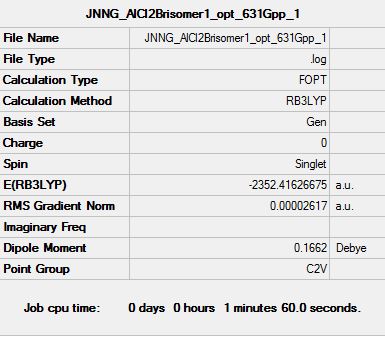 |
 |
| |||||||||
| convergence | Item Value Threshold Converged?
Maximum Force 0.000043 0.000450 YES
RMS Force 0.000019 0.000300 YES
Maximum Displacement 0.001367 0.001800 YES
RMS Displacement 0.000434 0.001200 YES
Predicted change in Energy=-5.052335D-08
Optimization completed.
-- Stationary point found.
|
Item               Value     Threshold  Converged?
 Maximum Force            0.000069     0.000450     YES
 RMS     Force            0.000025     0.000300     YES
 Maximum Displacement     0.000666     0.001800     YES
 RMS     Displacement     0.000209     0.001200     YES
 Predicted change in Energy=-8.510078D-08
 Optimization completed.
    -- Stationary point found.
|
       Item               Value     Threshold  Converged?
 Maximum Force            0.000022     0.000450     YES
 RMS     Force            0.000007     0.000300     YES
 Maximum Displacement     0.001239     0.001800     YES
 RMS     Displacement     0.000585     0.001200     YES
 Predicted change in Energy=-1.187828D-08
 Optimization completed.
    -- Stationary point found.
|
|||||||||
| Click for Jmol file |
|
|
| |||||||||
| DOI | DOI:10042/193828 | DOI:10042/193886 | DOI:10042/193842 |
| Isomers | 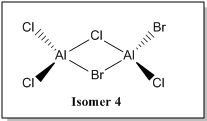 |
 |

| |||||||||
|---|---|---|---|---|---|---|---|---|---|---|---|---|
| Summary data (.log) | File:JNNG AlCl2Brisomer4 1 opt 631Gpp.log | File:JNN AlCl2Brisomer5 opt 631Gpp1.log | File:JNN AlCl2Brisomer6 opt 631Gpp1.log | |||||||||
| Summary Table |  |
 |
| |||||||||
| convergence | Item Value Threshold Converged?
Maximum Force 0.000022 0.000450 YES
RMS Force 0.000008 0.000300 YES
Maximum Displacement 0.001342 0.001800 YES
RMS Displacement 0.000625 0.001200 YES
Predicted change in Energy=-1.462018D-08
Optimization completed.
-- Stationary point found.
|
 Item               Value     Threshold  Converged?
 Maximum Force            0.000043     0.000450     YES
 RMS     Force            0.000021     0.000300     YES
 Maximum Displacement     0.000872     0.001800     YES
 RMS     Displacement     0.000267     0.001200     YES
 Predicted change in Energy=-4.333195D-10
 Optimization completed.
    -- Stationary point found.
|
       Item               Value     Threshold  Converged?
 Maximum Force            0.000030     0.000450     YES
 RMS     Force            0.000010     0.000300     YES
 Maximum Displacement     0.000503     0.001800     YES
 RMS     Displacement     0.000189     0.001200     YES
 Predicted change in Energy=-2.372918D-08
 Optimization completed.
    -- Stationary point found.
|
|||||||||
| Click for Jmol file |
|
|
| |||||||||
| DOI | DOI:10042/193836 | DOI:10042/193838 | DOI:10042/193840 |
Measuring the dissociation energy of dimer to form monomer
Before comparing the relative stability of different conformations of the dimers, the energy values of the dimer has to be compared with its monomer first. The hypothesis that the dimer formation is a more stable compound than its monomer is tested using computational method.
First, the structure of the monomer AlCl2Br was optimised to determine its minimum energy conformation. The results are tabulated as shown below:
| summary data | Summary | convergence | Jmol | |||
|---|---|---|---|---|---|---|
| File:JN monomer opt 631Gpp.log | 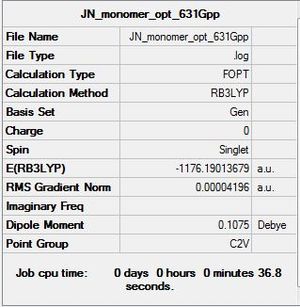
|
       Item               Value     Threshold  Converged?
 Maximum Force            0.000136     0.000450     YES
 RMS     Force            0.000073     0.000300     YES
 Maximum Displacement     0.000681     0.001800     YES
 RMS     Displacement     0.000497     0.001200     YES
 Predicted change in Energy=-7.984447D-08
 Optimization completed.
    -- Stationary point found.
|
|
Therefore, the dissociation energy can be obtained from the following calculations by using the lowest energy conformer (isomer 6):
E([AlCl2Br]2)= -2352.41632891 a.u
E(AlCl2Br)= -1176.19013679 a.u
ΔE=E([AlCl2Br]2)-2[AlCl2Br]
ΔE= -0.03605533 a.u (-94.66 kJmo1-1)
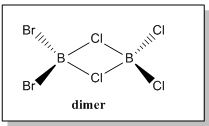
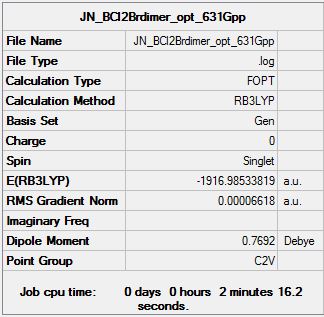
The calculated value concur with our hypothesis and that the dimerisation of AlCl2Br results in forming a more stable compound [AlCl2Br]2. Apart from that, to further proved that the hypothesis stated earlier on was correct, the energy for both the monomer of BCl2Br and its dimer were calculated using the same basis set and pseudo potential. The results are shown below
| Molecule |  |
| ||||||
|---|---|---|---|---|---|---|---|---|
| Summary data (.log) | File:JN BCl2Brmonomer opt 631Gpp.log | File:JN BCl2Brdimer opt 631Gpp.log | ||||||
| Summary Table | 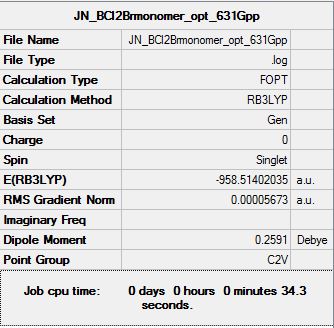 |
| ||||||
| convergence | Item Value Threshold Converged?
Maximum Force 0.000078 0.000450 YES
RMS Force 0.000048 0.000300 YES
Maximum Displacement 0.000611 0.001800 YES
RMS Displacement 0.000303 0.001200 YES
Predicted change in Energy=-6.228978D-08
Optimization completed.
-- Stationary point found.
|
Item               Value     Threshold  Converged?
 Maximum Force            0.000099     0.000450     YES
 RMS     Force            0.000041     0.000300     YES
 Maximum Displacement     0.001697     0.001800     YES
 RMS     Displacement     0.000520     0.001200     YES
 Predicted change in Energy=-2.965087D-07
 Optimization completed.
    -- Stationary point found.
| ||||||
| Click for Jmol file |
|
| ||||||
| DOI | DOI:10042/193854 | DOI:10042/193856 |
To find out the energy change for the formation of dimer:
E([BCl2Br]2)= --1916.98533819 a.u
E(BCl2Br)= -958.51402035 a.u
ΔE=E([BCl2Br]2)-2[BCl2Br]
ΔE= 0.0427025100 a.u (+112.12 kJmo1-1)
This shows that for the monomer BCl2Br, it would prefer to stay as a monomer rather than a dimer unlike that of ACl2Br. Having achieved this, we can now examine the relative energy stability of all the 6 isomers which will be discussed in greater details in the following section.
Analysing Optimised Structures of isomers
Looking at the above summary table, it was noted that isomer 6 has the lowest energy conformations and the following table below shows the tabulated energy values of each optimised isomers as well as the energy difference of each isomer to the lowest energy isomer.

Firstly, looking at the energy of the individual optimised structure, it can initially be ranked as follows with E(isomer 6) < E(isomer 2) < E(isomer 1) < E(isomer 3) < E(isomer 4) < E(isomer 5). However, on a closer examination, the energy differences between isomer 6, 2 and 1 are very small and falls within the accuracy of the program. Hence, this suggests that while isomers 6,2 and 1 are different conformers, they have the same energy values and therefore degenerate. Similarly, isomer 3 and 4 have similar energy values despite being different conformers, and hence their energy levels are degenerate.
Hence the overall energy comparison is shown as:
Isomer 6 = Isomer 2 = Isomer 1 < Isomer 3 = Isomer 4 < Isomer 5
Question: discuss the position of the Br atoms with respect to the stability of the different conformers
Before attempting to answer what effect does the position of Br has on the stability of different conformers, the formation of dimer must be understood first (i.e why some molecules form dimer while some do not). If we compare the molecules between BBr3 and BH3, BBr3 does not form a dimer while BH3 does. Why is this so? While both molecules are trigonal planar in structures, it must be noted that the surrounding ligands for BH3 are much smaller in comparison to BBr3. Further more, H atoms do not have electrons in the p orbitals like Br atoms do, and hence there's no extra π stabilisation. As such, due to size factor, BH3 molecule are able to come together to form a dimer B2H6 with bridging H atoms forming a (3c-2e) bonds that can help to stabilised the electron deficient Boron atom. This does not occurs for BBr3 due to π stabilisation and also Br atoms are too big and it would lead to steric repulsion if both monomers come close together. Similarly, based on earlier calculations, it was observed that it is energetically unfavourable for BCl2Br to dimerise.
So why does AlCl2Br forms a dimer while BCl2Br does not? As we have discussed previously, the π interactions decreases significantly down the group due increase in atomic size and more diffuse orbitals. As such, for AlCl2Br is lewis acidic and it is electron deficient and would want to form dimer to relief the electron deficiency forming a stable dimer (see earlier on for calculations). The formation of dimers could lead to 6 different isomers formed as shown above.
Knowing that AlCl2Br is more likely to dimerise to form a more stable compound, the next leading question would be how will the position of Br affect the relative energy of the dimer. From previous explanation, one of the major factors for formation of dimer is to relief the electron deficiency around the central atom, Al. Hence the position of different ligands are vital in understanding the different energy values obtained for different isomers.
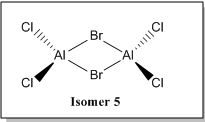
Examining in greater detail on the bridging bonds, we can potentially place two Br atoms as the bridging ligands (Isomer 5). The extra lone pair of electrons on Br atoms can be donated into the empty orbital of Al via a sigma donation fashion forming a dative bond, thereby relieving the electron deficiency of central Al atom as shown below.
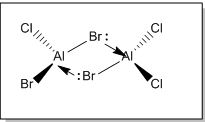
However, based on computational methods, it has shown that this particular structure has the highest energy value as compared to the other conformers (i.e the least stable isomer). This is because while the electron donation by Br atom to Al seems to help to relieve the electron deficiency of the central Al atom, it could potentially lead to steric repulsion at the bridging site region due to the size of Br atoms. Therefore, the availability and ability to donate lone pair of electrons may not be the only factor that can affect the energy value of the dimer [AlCl2Br]2
Assuming that sigma donation of ligands forming dative bond is the only bond mode in forming the dimer, we can then switch the bridging ligands to Cl atoms instead of Br atoms. This can potentially lead to 3 different isomers/conformers (isomer 1, 2 and 6) with Br atoms forming terminal bonds with Al atom. At first sight, one would think that because Cl is more electronegative than Br atom, its lone pair of electrons are more tightly bound and hence not as available to form a dative bond. However, through computational calculations, it turns out that by having 2 Cl atoms as the bridging ligands, the dimers formed have the least energy value (i.e most stable). Why is this so?
There are two main reasons as to why these conformers have the lowest in energy value. Firstly, based on orbital overlap principle. Cl atom and Al atom are in the same period in the periodic table and hence they have roughly similar atomic size and better overlapping of orbitals as compared to Al and Br orbitals. This would mean that the overlapping integral of Al-Cl is greater compared to Al-Br and hence more favourable bonding between Al-Cl than Al-Br. The second reason is due to sterics, Cl is a smaller atom as compared to Br atom. Hence, with Cl as bridging ligands and Br atoms at the terminal ends, it does not experience as much steric hindrance as compared to having Br as the bridging ligands where the Br atoms are confined between the two Al atoms.
The only possible combination left is when one Cl atom and one Br atom are the bridging ligands (isomer 3 and 4). These two conformers have approximately similar energy values and both of these conformers have energy values that are somewhat in the "middle" as compared to isomer 5 and isomer 6,2,1.
In addition, there can be other factors besides considering the effect of position of Br atom on the relative energies of isomers. One of the limitations/assumptions that was made was to treat these dimers as classical Lewis structures and assuming that there is no interactions between the two Al atoms. This would mean that the bridging bond distance is important in determining if the orbital overlapping integral of Al-Al is significant to indicate any form of interactions. From frequency analysis, the data suggests that Al centre is sp2 hybridised in nature (see Frequency analysis section). However, looking at the bond angles between Al-Br, it suggests that Al is sp3 hybridised. In addition, Al3+ is highly polarising and it can easily polarise the bridging ligands and have an effect on the overall stability of the dimer. All these other factors could potentially have an effect on the energy values obtained for each dimer apart from the sigma donation of lone pair of electrons from the bridging ligands to the metal centre.
Raw data for frequency analysis of isomers
| Isomers |  |
 |

| |
|---|---|---|---|---|
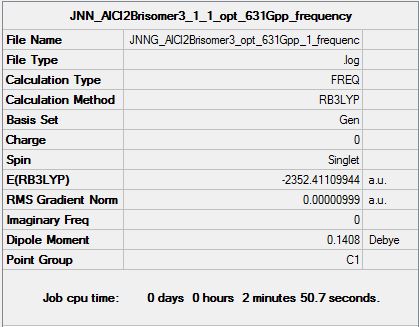
| Summary data (.log) | File:JNNG AlCl2Brisomer1 opt 631Gpp 1 frequency1.log | File:JNNAlCl2Brisomer2 1 opt 631Gpp 1 correct frequency.log | File:JNNG AlCl2Brisomer3 opt 631Gpp 1 frequenc.log | |
| Summary table | 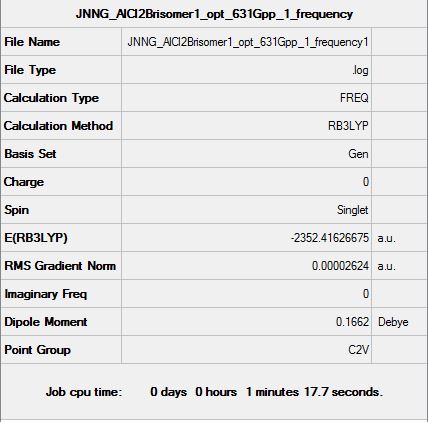 |
 |
| |
| Frequency | Low frequencies --- -4.2139 -1.7201 0.0022 0.0029 0.0031 1.4869 Low frequencies --- 17.1717 50.8720 78.5418 |
Low frequencies --- -3.8988 -1.4228 -0.0044 -0.0037 -0.0036 1.2737 Low frequencies --- 17.7324 48.9423 72.9423 |
Low frequencies --- -2.5330 0.0012 0.0021 0.0029 0.7374 3.0953 Low frequencies --- 17.1262 55.9236 80.0673 |
|
| IR Spectra |  |
 |

| |
| DOI | DOI:10042/193858 | DOI:10042/193887 | DOI:10042/193860 |
| Isomers |  |
 |

| |
|---|---|---|---|---|
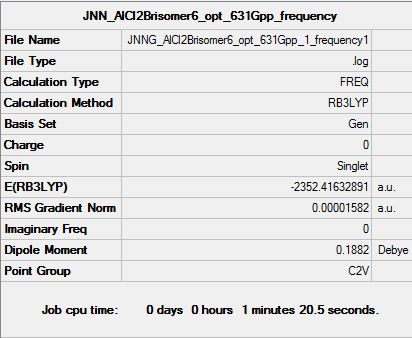
| Summary data (.log) | File:JNNG AlCl2Brisomer4 opt 631Gpp 1 frequency1.log | File:JNNG AlCl2Brisomer5 opt 631Gpp 1 frequency1.log | File:JNNG AlCl2Brisomer6 opt 631Gpp 1 frequency1.log | |
| Summary Table | 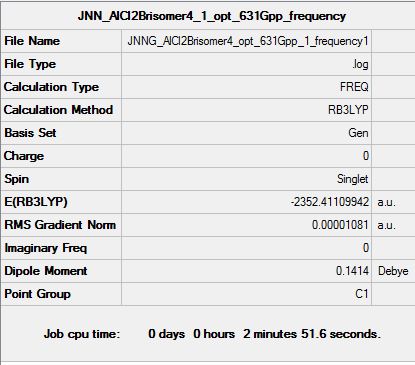 |
 |
| |
| Frequency | Low frequencies --- -2.4954 -0.0028 -0.0028 -0.0027 0.5238 3.1770 Low frequencies --- 17.1311 55.9240 80.0688 |
Low frequencies --- -5.2464 -5.1140 -3.5845 0.0051 0.0051 0.0055 Low frequencies --- 14.8416 63.2960 86.0716 |
Low frequencies --- -4.2293 -2.8454 -1.4641 -0.0030 -0.0027 -0.0021 Low frequencies --- 17.6948 50.9301 72.1685 |
|
| IR spectra | 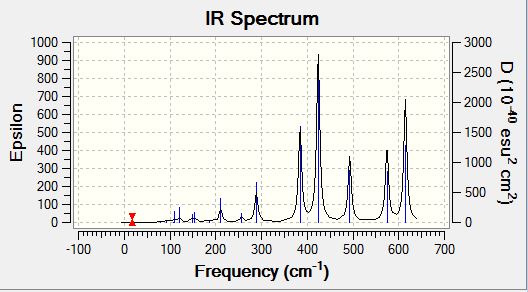 |
 |
| |
| DOI | DOI:10042/193862 | DOI:10042/193863 | DOI:10042/193864 |
Analysisng the position of Br atom effect on IR spectra
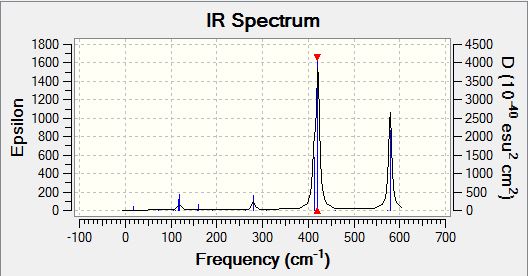
Questions: Discuss the IR spectra with respect to the symmetry of each conformer, why do some spectra have more bands than others? An advantage of computational chemistry is that you can calculate the position of bands that are not experimentally active, what is the requirement for an IR band to be active?
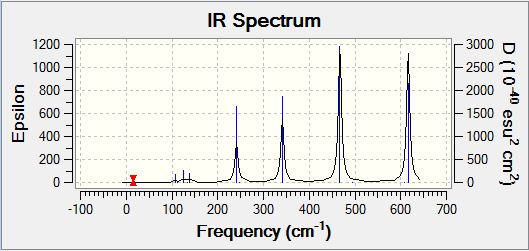
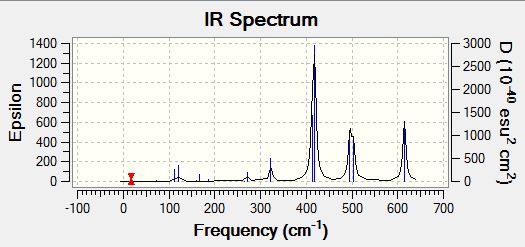
Analysing the IR spectra, it can be observed that are different number of bands seen in the IR spectra for different conformers. This is because of the selection rules for IR spectroscopy. In order for a band to be obeserved (IR active), there must be a change in dipole moment in the molecule. If the dipole moment remain unchanged, the band will not be observed in the spectra (Raman spectroscopy can be employed to examine these stretches). When there are two or more vibrations that have the same energy, it leads to degenerate peaks and will only appear as one peak in the spectra. Using the above criteria and definition, the different number of bands for each conformer can be explained based on its point group of the respective isomers. The following table presented below shows the point group symmetry of each conformer and the number of IR peaks observed (i.e non-zero intensity).
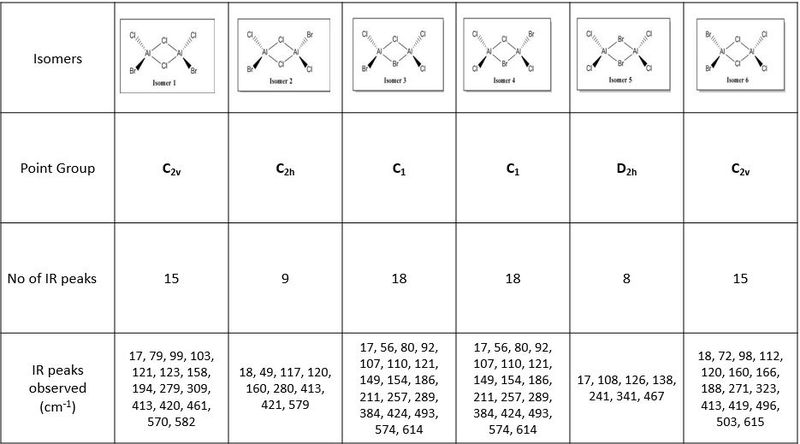
Looking at the above table, isomer 5 has the highest level of symmetry amongst all other isomers and hence, it has the least number of modes of vibrations that are IR active. The next highest in symmetry molecule is isomer 2, with planes of symmetry as well as having the least dipole moment thus accounting for smaller number vibrational modes that are IR active.
In contrast, looking at isomers 3 and 4, both conformers have the highest number of vibration modes that are IR active. This is because both conformers have the lowest level of symmetry in the molecule. One of the reasons accounting for the largest number of IR active modes is because both its symmetrical and asymmetrical stretches are IR active because of the lack of symmetry within the molecule itself. One of the assumption made here was that for any vibration mode, all the atoms in the molecule will be displaced. As both isomers 3 and 4 have no planes of symmetry, any vibration modes involving displacing the atoms cannot be compensated by an equal but opposite motion elsewhere in the molecule. As a result of lack of inherent symmetry within the molecule, both isomers 3 and 4 has the highest number of vibration modes that are IR active. It was also observed that for isomers 1 and 6 while they are two different conformers have similar point group symmetry and hence both molecules have the same number of vibration modes that are IR active.
Discuss the position and nature of Al-Br stretching vibrations with respect to the terminal or bridging position of the Br atom. Placing images of the spectra side by side is not sufficient, tabulate the key vibrational frequencies (remember that they can reorder, so be sure you are comparing similar modes). The key word here is "discuss" just presenting images and tables is not sufficient, you must interpret your results.
Looking at the same terminal asymmetric stretches for the isomers (except isomer 5 which does not have Al-Br stretch), the following values and intensities are tabulated and shown in the table below:
| Isomers |  |
 |
 |
 |

|
|---|---|---|---|---|---|
| modes | 17 | 17 | 17 | 17 | 16 |
| frequency (cm-1) | 570 | 574 | 574 | 574 | 496 |
| Intensity | 32 | 0 | 122 | 121 | 134 |
| Click for animations | Media:JN_isomer1_mode17_1.ogg | Media:JNN_isomer2_mode17_2.ogg | Media:JNN_isomer3_mode17.ogg | Media:JNN_isomer4_mode17.ogg | Media:JNN_isomer6_mode16.ogg |
By looking at the same asymmetric stretch for the above conformers, it can be seen that the Al atoms move in opposite direction in a concerted fashion. This motions resulted in a contraction and lengthening of Al-Br bonds within the molecule in an asymmetric fashion leading to a change in dipole moment (i.e this vibration mode is IR active). However, for isomer 2, this vibration mode is IR inactive because the dipole moment arise due to this vibration is compensated due the position of the Br atoms which are situated opposite of each other resulting in a net zero dipole moment, hence the vibration mode is IR inactive.
In addition, looking at the stretching frequency of the above conformers, the strength of Al-Br terminal bond is shown below:
isomer 6 < isomer 1 < isomer 2 = isomer 3 = isomer 4
Isomer 6 has the smallest freqeuncy (i.e least energy), this is because of the proximity of the two Br atoms which may results in steric clashes and hence making the Al-Br bond slightly weaker than the rest. However, it should also be noted that the differences in frequency is within ± 10 kJ mol-1 within the accuracy of Gaussview program.
Examining the same bridging asymmetric stretch for isomer 3, 4 and 5
| Isomers |  |
 |

|
|---|---|---|---|
| modes | 11 | 11 | 11 |
| frequency (cm-1) | 211 | 211 | 197 |
| Intensity | 21 | 21 | 0 |
| Click for animations | Media:JN_isomer3_mode11.ogg | Media:JN_isomer4_mode11.ogg | Media:JN_isomer5_mode11.ogg |
By comparing the same asymmetric bridging stretches of Al-Br, the strength of Al-Br bond is shown below:
isomer 5 < isomer 3 = isomer 4
This strength of bridging Al-Br bond can be rationalised by invoking the same argument as mentioned previously for terminal stretches, where the population of two Br atoms as bridging ligands resulted in significant steric clash as compared with only one Br atom at the bridging site.
In addition, comparing both the terminal and bridging stretching frequency, it can be seen that the frequency for terminal Al-Br bond is much larger as compared to the bridging Al-Br bond. This can be rationalised that the terminal Al-Br bond is much stronger than the bridging Al-Br bond. This is because for the terminal Al-Br bond, it consists of only 2 centre-2 electrons covalent bond. In contrast, for the bridging Br atom, it consist of one normal covalent bond and one dative bonding due to the donation of lone pair of electron of Br into Al centre. As a result, Br atom now shares 3 of its electrons over 3 atoms (Al-Br-Al) resulting in a larger spread of electron density and a smaller overlap integral. As a results, the bridging Al-Br bond is relatively weaker and thus lower vibration frequency is observed.
Molecular Orbital Analysis of Isomer 6
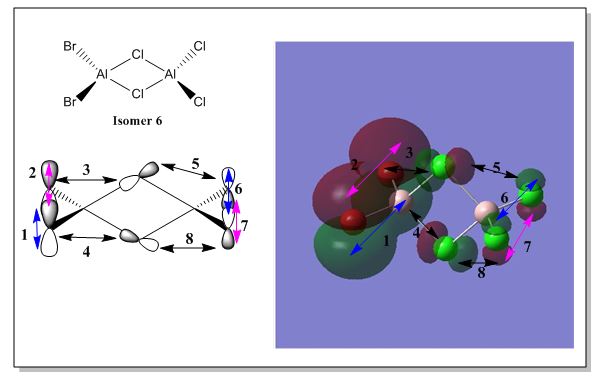
For the lowest energy conformer (isomer 6), the formatted checkpoint file was retrieved from the following D-space DOI:10042/193840 to visualise the occupied molecular orbitals. It was observed that there were 54 molecular orbitals that are occupied in total. The molecular orbitals generated were then analysed to examine the degree of delocalisation of electron density as well as the bonding nature of each of the occupied molecular orbitals. In addition, 5 selected non-core molecular orbitals are shown below where the degree of electron delocalisation and the nature of bonding are discussed. Pictorial diagram of the the contributing atomic orbitals are also generated to aid in deducing the overall bonding nature for each of the 5 non-core MOs.
Non Core Molecular Orbital no: 45
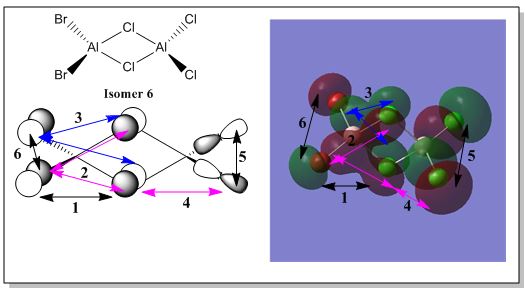
Nodal planes and atomic nodes:
Point (1) : Atoms are far apart, orbitals are out of phase: through space weak anti-bonding interaction
Point (2 & 3): π type interactions. In phase p orbitals of Br and bridging Cl atoms- strong bonding interactions
Point (4): Atoms are far apart, orbitals are in phase: through space weak bonding interactions
Point (5&6): orbitals are out of phase. Moderate through space anti bonding interaction
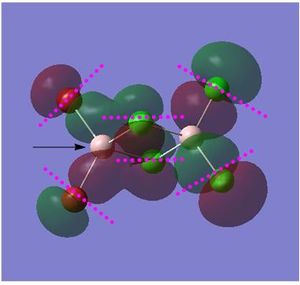
The electron density is delocalised over a region of the molecule (except for the two terminal Cl atoms) as depicted above. The delocalisation of the electron density is due the the in phase bonding interactions between the p orbital of the terminal Br atoms and the p orbitals of the bridging Cl atoms(left of the molecule). Looking at the size of the orbitals of the constituent atoms, all of them have relatively similar size indicating an equal orbital contributions for this non core MO. It is noted that Al orbitals do not contribute as Al is electropositive and hence its orbitals are much higher in energy. In addition, there exist several atomic nodes highlighted in pink as well as a nodal plane that run through both the Al atom as annotated by the black arrow.
Overall interaction: Bonding
Non Core Molecular Orbital no: 46

Nodal planes and atomic nodes:

Point (1): atoms are far apart, orbitals are out of phase: weak through space antibonding interactions
Point (2,3) atoms are separated, orbitals are in phase: weak through space bonding interactions
Point (4): atoms are far apart, orbitals are out of phase: weak through anti-bonding interactions
The electron density is not delocalised with the individual atoms corresponding p orbitals (except for Al atoms) as depicted above. For this non-core orbital, Al atomic orbitals do not contribute. In general, the orbitals are out of phase of each other however, on a closer examination on the bridging Cl atoms, the orbitals are in phase and this lead to a weakly through space bonding interactions. The size of p orbitals of Br is relatively larger than the Cl atoms indicating a larger contribution by Br atoms as compared to Cl atoms. In addition, following atomic nodes are highlighted in pink.
Overall interaction: weakly anti-bonding
Non Core Molecular Orbital no: 48

Nodal planes and atomic nodes:
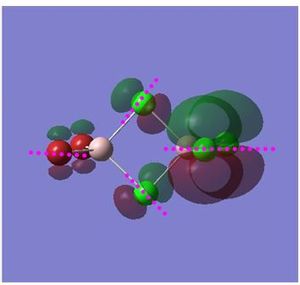
Point (1,4): atoms are far apart. Orbitals are in phase: weak through space bonding interactions
Point (2,3): atoms are far apart, orbitals are in phase: weak through space bonding interactions
Point (5,8): atoms are directly bonded: strong out of phase antibonding interactions
Point (6,7): atoms are directly bonded, orbitals are in phase: Strong π bonding interactions
Point (9): atoms are far apart, orbitals are out of phase weak through space anti-bonding
The electron density is delocalised over a part of the molecule as shown by the overlapping of p orbitals between two Cl atoms as depicted above. The shared electron density observed suggests that there is some degree of bonding interactions between the terminal Cl atoms. This is achieved by having the correct orbital phase the two Cl atoms. For this non-core MO, the size of p orbitals of Br is relatively smaller than p orbitals of Cl suggesting a larger contribution by Cl atoms. Besides that, the following nodal planes and atomic nodes are also highlighted in pink.
Overall bonding: Weakly bonding
Non Core Molecular Orbital no: 50
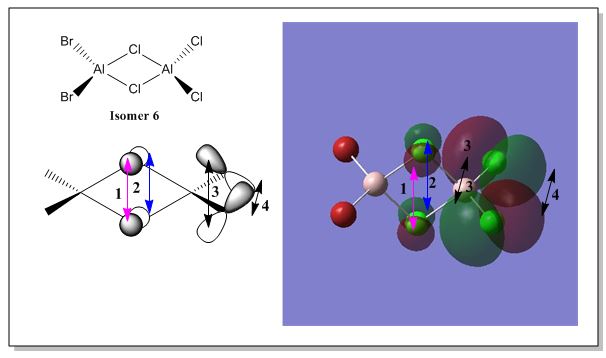
Nodal planes and atomic nodes:

Point (1,2): atoms are far apart, orbitals are in phase: through space weak bonding interactions
Point (3,4): atoms are separated , orbitals are out of phase: through space weak anti-bonding interactions
As depicted in the above diagram, the electron density is localised within the p orbitals of the bridging Cl and terminal Cl atoms. For this non-core MO, the terminal Br atoms and one of the Al atoms do not contribute. There exist a weak through space bonding interaction between the bridging Cl atoms. However, there also exists a anti bonding sigma interactions between the terminal Cl atoms which have a larger contribution to the overall bonding due to the p orbital of the terminal Cl atoms being larger than the bridging Cl orbitals. In addition, there exists atomic nodes for each of the p orbitals as highlighted in pink.
Overall bonding: non-bonding
Non Core Molecular Orbital no: 52
Nodal planes and atomic nodes:
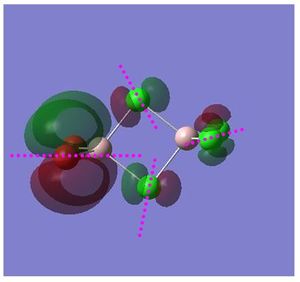
Point (1,2): atoms are directly bonded, strong π interactions orbitals are in phase: strong bonding interactions
Point (3): atoms are directly bonded, but orbitals are in phase but not in the same symmetry. Through space bonding interactions
Point (4): atoms are directly bonded, orbitals are out of phase: through space anti-bonding interactions
Point (5,8): atoms are separated, orbitals are out of phase:through space weakly anti-bonding interactions
Point (6,7): atoms are separated, orbitals are in phase and possess same symmetry: Through space weak bonding interactions
As depicted in the above diagram, in constrast to molecular orbital 48, the electron density is now delocalised within part of a molecule due to in phase and correct p orbitals symmetry that lead to strong π interactions between the two Br atoms. There is also a localised electron density within the bridging Cl atoms which formed weakly anti-bonding interactions as depicted in the above picture. Looking at size of the individual atomic orbitals, it can be seen π interactions between Br-Br has a larger contribution. The delocalisation of electron density over the two Br atoms also suggests that there is some degree of bonding between the two terminal Br atoms. In addition, there exists atomic nodes for each of the p orbitals as highlighted in pink as well as a nodal plane that run through in between the Al atoms. The delocalisation of electron density over the terminal Br atoms occurs at a higher energy level as compared to the delocalisation of Cl atoms (MO 48) because the p orbitals of Cl are lower in energy as compared to Br. This can be accounted by Cl is more electronegative than Br, hence the p orbitals of Cl lies lower in energy than Br atoms.
Overall bonding: Strongly bonding
Conclusion
In summary, this project has examined the structures of different EX3 by having different central atom as well as analysing the effect of changing the ligands have on the bond length and bond angle. In addition, it has been noted that by using different basis set, it can result in obtaining different energy values for the same molecule. Therefore, in order to compare the structures of the molecule, the same basis sets or pseudo potentials have to be employed for accurate comparison. Frequency analysis on BH3 and GaBr3 have also been discussed at length. This project has also looked at the stability of various compounds by looking at their dissociation energies and relating it to their stability. Lastly, the effect of substituting Br atoms between the terminal and bridging positions have been examined, looking at not only the energies of the various conformers but also the molecular orbitals of the dimer [AlCl2]2.

