Rep:Mod:jm module3
Cope Rearrangement
Optimising the Reactants and Products

In this part of the module the [3,3]-sigmatropic shift rearrangement of 1,5-hexadiene will be modelled and then computational techniques will be used to locate the transition state(s) of this reaction.
First of all, 1,5-hexadiene was drawn in GaussView with anti-linkages (i.e. anti-periplanar arrangement) between the 4 central Carbon atoms; the structure was then cleaned up. Following this the molecule was then optimised using the Hartree-Fock method and 3-21G basis set. The total energy was worked out to be -231.69260 Hartrees. Next the optimised molecule was symmetrized returning a point group symmetry of C2. The structure is illustrated below.
Anti 1 Conformation |
In terms of structure, total energy and Point Group symmetry this conformation is the same as "Anti 1" as seen in appendix 1[1].
For the next part, 1,5-hexadiene was drawn again, this time with the 4 central carbon atoms arranged Gauche to one another. Optimisation returned a total energy of -231.68772 Hartrees and C2 Point Group symmetry. Consultation of appendix 1[1] confirms that this structure is the Gauche 1 conformation. This (Gauche) conformation is higher in energy than the anti conformation computed previously. This fits the expected trend where the anti-periplanar arrangement is lower in energy on account of reduced steric repulsion of opposing groups on neighbouring atoms and a favourable overlap interaction between σC-H/σ*C-H orbitals.
Gauche 1 Conformation |
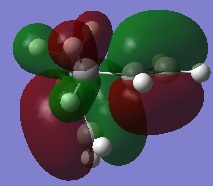
It is in fact shown, as supported by literature[2], that the Gauche conformers are generally lower in energy than the Anti conformers. As previously explained it would be expected that the Gauche-conformer would be higher in energy than the anti-conformer on account of steric effects and an orbital overlap. Whilst such steric repulsions are present, there is an additional stabilising effect seen in the Gauche-conformer. It is seen in the HOMO that there is a good overlap between the π-bonding orbital of the C=C bond with the σ* orbitals of the neighbouring C-H groups. The picture on the right illustrates the Gauche 1 conformation which contains these stabilising orbital interactions. The high energy of the π-bonding orbital and low energy of the σ* orbital makes this a favourable interaction giving rise to a relatively large stabilisation energy when these two overlap sufficiently well. Such interactions must therefore be more stabilising than the orbital interactions of anti-periplanar molecules if the Gauche conformers are generally lower in energy.
Further investigation of the orbitals of all of the conformations show that each of the conformers (including anti- conformers) show a degree of positive orbital overlap. Additionally the length of these molecules makes it possible that sterics do not even play a part in the relative stability/instability of each conformer. As such a solid conclusion is hard to make given how many factors dictate the adopted geometries of each conformer.
To further minimise the energy of the Gauche-1 conformation the overlap of the two Carbon-Carbon double bonds was reduced as much as possible and the vinyl C-H overlap with the double bonds were maximised. This obtained a Gauche conformation with a total energy of -231.69266 Hartrees and C1 Point Group symmetry. This structure is the Gauche-3 conformation and is the lowest energy conformation obtained thus far suggesting that this conformation could be the most stable one.
Next, the Anti-2 conformation was drawn and optimised, again using the HF method and 3-21G basis set. The total energy is -231.69254 Hartrees and this conformation shows Ci Point Group symmetry. This agrees strongly with the Anti-2 conformation provided in appendix 1[1]. The structure is as follows.
Anti-2 Conformation |
Now this structure will be taken and re-optimised using the DFT (Density Function Theory) B3LYP method with the 6-31G* basis set. This is a higher level set and as such should provide a more accurate geometry and total energy; comparing will confirm this. The total energy obtained from the DFT/B3LYP method is -234.55970 Hartrees and the Point Group symmetry is still Ci . The structure is illustrated below.
Gauche 3 Conformation |
This diagram illustrates that upon moving from the lower level HF method to the higher level DFT method the geometry hasn't changed much. Because the geometry hasn't changed all that much the Ci point Group symmetry is retained as well. The only difference between the two methods is the optimised molecule's total energy. The energy difference between the two methods is 2.86716 Hartrees with the DFT/B3LYP yielding the lower energy value. The Hartree-Fock method often overestimates the total energy upon optimisation and as such this result is to be expected. It may be concluded that in this case the HF method is sufficient for the needs of this part of the experiment.
For the next part of this experiment, the DFT/B3LYP-optimised Anti-2 conformation was taken and a frequency calculation performed (using the same method and basis set as before)on it. The results file shows no imaginary vibrations and no negative vibrational frequencies suggesting that the frequency calculation has run correctly. The IR spectrum is pictured right.

The reason for carrying out this frequency calculation is to obtain a summary of the different energy terms for this conformation. These values are found by looking at the thermochemistry section of the output file. Originally it was planned to compare the energy terms at room temperature (298.15K) with those at absolute zero (0K). Unfortunately the frequency calculations would not run at 0K (kept calculating for 298K) so instead a temperature of 1K was used. The results are tabulated below.
| Temperature/K | Electronic+Zero-Point Energy | Electronic+Thermal Energy | Electronic+Thermal Enthalpy | Electronic+Thermal Free Energy |
|---|---|---|---|---|
| 298.15 | -234.41625 | -234.40895 | -234.40801 | -234.44790 |
| 1.00 | -234.41625 | -234.41624 | -234.41624 | -234.41627 |
The experimental values shown above agree well with those provided in appendix 2. These results show that the total energy of the molecule doesn't change with temperature which is what we expect.
Optimising the "Chair" and "Boat" Transition Structures
First of all, a H2CCHCH2 allyl fragment was drawn into GaussView, cleaned and then optimised using the HF/3-21G method and basis set. Following this, the optimised fragment was copied twice into a new window and the fragments organised to resemble the chair transition state. It was arranged such that the distance between the terminal Carbon atoms was approximately 2.2Å. This distance is less than the optimal C-C distance (3.2 Å) required for an attractive interaction and as such one may assume that such an interaction will be somewhat repulsive. This will be a high energy interaction and as such so it can be seen why the transition state corresponds to a maximum (saddle point) on the potential energy surface.
Here the optimisation works by computing the bond force constants within the molecule (the fragments in this case). The force constant is a proportionality constant linking bond length and restoring force. Accordingly, as a bond moves away from its equilibrium length the force constant will rise corresponding to a greater restoring force (i.e. the force trying to return the bond to its equilibrium length will increase). It is also true that the potential energy rises as the force constant k does. The transition state of a reaction lies at the maximum of the potential energy surface where the bond have been disorted sufficiently for a reaction to proceed. By computing the force constants of the transition state structure’s bonds the true transition state structure may be found at the point where the force constants (and correspondingly, the potential energy) are at a maximum. This is how the transition state structure will be computed for the first part of this section.
An “Opt+Freq” calculation was then run on this transition state structure, again using the HF/3-21G method and basis set. Under the Job Type tab this calculation was changed so that the structure would be optimised using the Berny algorithm. The Berny algorithm simplifies calculations somewhat by incrementally moving along the potential energy surface (reaction coordinate) and computing the force constant each time.
This calculation was run such that it will calculate the force constants only once, stopping after a maximum has been reached. This effectively means that only one “imaginary” structure will be returned by the frequency analysis. Working in such a manner assumes that the rough transition state structure is very close to the transition state’s true structure. Naturally, such a method is more prone to error if the originally drawn structure is incorrect.
The optimisation returned the TS structure pictured below.
Anti-2 Conformation |
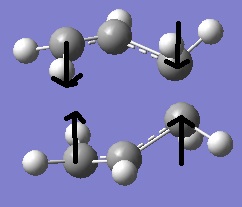
An imaginary vibrational mode was found at -818cm-1 with an intensity of 6. This mode corresponds to the bending (there’s a small stretching component as well) of the Carbon-Carbon bonds in both fragments, resulting in a concerted motion where the terminal Carbon atoms at one end move toward one another and away from one another and the other end. This seems logical as it corresponds to the concerted formation of a C-C bond on one side of the molecule as another breaks on the other side.
If it is assumed that the terminal atoms either side of the forming bonds are regarded as masses on a spring that oscillate harmonically the following equation may be used to relate frequency and force constant.
f = (1/2π)*(k/m)-1/2
Where f is the frequency, k the force constant and m the mass.
When a bond is stretched to the point of dissociation the force constant increases, one may assume then that the force constant will decrease if a new bond is being formed (and decreasing in length up to the equilibrium length). Because the square root of a negative cannot be solved it is easy to see why these vibrational modes may be considered imaginary.
It was noted that the C-C distances had been decreased to 2.02Å as a result of the optimisation which may be expected as a shorter bond will be more stable and stronger if it's shorter.
Next the structure was optimised using the frozen coordinate method. In this method parts of the molecule/fragments may be “frozen” with respect to optimisation allowing for smaller parts of the structure to be optimised and their force constants computed. Doing so simplifies calculations somewhat as not all of the force constant matrices need to be calculated at once. In this case, the terminal Carbon atoms will be frozen with respect to one another and the structure optimised. Following this the terminal atoms will be “unfrozen” and the optimisation run again.
In this case the input was modified such that the distance between the terminal Carbon atoms were set to 2.2Å. This is reflected in the optimised structure which is almost identical to that obtained previously except for the terminal C-C lengths which are still 2.2Å as specified.
Now the terminal Carbon atoms will be optimised as well. Doing so results in a structure which closely resembles the transition state structure obtained from the first TS optimisation method. This is supported by the fact that the terminal C-C distances have reverted back to 2.02Å as before as well. One may assume that this means that the guessed structure for the transition state was sufficiently close to that of the “true” transition state.

Now the boat transition state will be drawn and optimised. This time the QST2 method will be used instead. In this method the expected reactants and products are drawn and a transition state structure is guessed by interpolating between the provided reactant and product structures. To carry out this optimisation a molgroup was opened such that both the reactant and product are pictured next to one another in the same window. After doing so the molecules were arranged as if they were mirror images of one another and then the atoms were labelled as follows. This looks like the following with the reactant molecule on the left-hand side and the product molecule on the right.
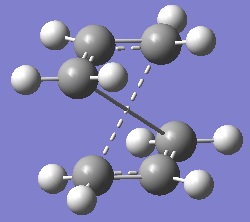
It is found that running this calculation fails with the transition structure reverting back to a chair-like transition state. The reason for this being that the optimisation works by translating only 1 of the allyl fragments and doesn't consider rotation about the central bonds. In simple terms, both molecules are closer to the chair-like conformation than the boat-like conformation. Upon optimisation the calculation reaches and ends on the chair transition structure because it is the closest conformation (minimum). To correct this problem, both the reactant and product must be arranged to more closely resemble the boat transition structure. This was done simply by changing the C2-C3-C4-C5 dihedral angle to 0o and the inner C-C-C angles were reduced to 100o . This yielded the following reactant and product molecules.

Having improved the input, the QST2 optimisation was run again. Unfortunately the Gaussian did not run to completion with the check file showing a structure resembling a chair transition with a very large distance between terminal Carbon atoms. The QST2 method requires that the reactant and product molecules are arranged close to the expected transition structure to obtain a reasonable optimised transition structure. Unfortunately, rearranging the reactant and product molecules did not return a boat transition structure. The QST3 method was used instead which allows more control over the optimisation calculation. In the QST3 method a guess transition structure is also drawn, giving Gaussian a basis to build upon.

Bearing this in mind, a guess boat transition structure was drawn in as well and the QST3 method run. Doing so proved successful yielding the transition structure pictured right. The vibrational analysis shows a single imaginary vibrational mode as before at -840cm-1 . This vibrational mode, like that of the chair transition structure, is a result of a concerted motion in which the terminal Carbon atoms at one end of the molecule move toward one another whilst those at the other end move away from each other. As before this corresponds to the respective (concerted) formation of a C-C bond and breaking of another.
At room temperature (and above) it is likely that the reacting 1,5-Hexadiene molecule will readily inter-convert between all of the confirmations (perhaps not the higher energy ones) seen in appendix 1. By looking at the conformation of the transition structure it may be predicted which conformation 1,5-Hexadiene adopts before moving towards the transition state and undergoing the reaction.
It can be seen in the Gauche-2[3] conformation that the central Carbon atoms (atoms 2 and 5) although not connected, are anti-periplanar to one another with respect to the attached Hydrogen atom. Such an overlap closely resembles the chair transition structure and as such it may be predicted that 1,5-Hexadiene adopts the Gauche-2 conformation before being able to form the chair transition structure.
The Gauche-4[4] conformation on the other hand shows the C-H overlap of the same central Carbon atoms (2 and 5) to be much greater, more closely resembling the boat transition structure. In this case however more severe translation of one allyl fragment may be required to form the Boat transition structure. Given that the Gauche-4 conformation is closer to the boat transition structure than any of the other 1,5-Hexadiene conformations it may be predicted that 1,5-Hexadiene must adopt the Gauche-4 conformation in order to pass through the boat transition structure.
Unfortunately predicting which 1,5-Hexadiene conformation is adopted in the product molecule isn't so easy and instead must be done using the intrinsic reaction coordinate method. In this method Gaussian moves along the reaction coordinate away from the transition state until the nearest potential minimum has been reached. In doing so the geometry of the final product may be predicted. This will now be carried out for the chair transition structure obtained earlier.
The chair transition check file obtained earlier will be opened up again and a new Gaussian input file made. The IRC job type was selected from the appropriate menu, the reaction coordinate was set to forward only (moving away from the TS towards the product), the force constants were set to be worked out only once (calculation runs faster that way) and the number of steps was increased to 50 (to ensure convergence at the minimum potential energy). This calculation returned a geometry which clearly wasn't a minimum (the bonds were stretched and distorted to unrealistic lengths (10Å). The IRC pathways reflect this.
| Total Energy/a.u. | RMS Gradient/a.u. |
|---|---|
 |

|
This shows the energy decreasing by small amounts each time before spiking at the end of the calculation. Ignoring the peak, the energies (as shown by the RMS gradient) are converging towards a minimum value. As such the product obtained in the step directly before the spike was taken and then optimised to give the following product.

This conformation closely matches that of the Gauche-2[3] conformer. At room temperature and above it will be the case that 1,5-Hexadiene will readily inter-convert between its different conformations. Given that the Gauche-3 conformation is the lowest in energy it may be expected that a time average would shows this conformation to exist in the greatest proportion. It is not until the Gauche-2 conformation is adopted that the groups and orbitals are sufficiently well aligned to pass through a chair transition structure to the product. Equally, the chair transition structure will degrade in such a way that the immediate product also adopts the Gauche-2 conformation before undergoing interconversion as before.
Given a boat transition structure is also possible, reaction via this pathway may also be observed. The conformation which most closely resembles the boat transition structure is the Gauche-4 conformation. It may be predicted that the same product conformation will be adopted as well. Because the Gauche-4 conformation is slightly higher in energy as is the boat transition structure it may be predicted that the conversion rate via this pathway will be lower than that which proceeds via the chair transition state.
Finally, the activation energies leading to both transition structures must be calculated. To do so the HF/3-21G-optimised geometries were taken for both transition structures and re-optimised using the B3LYP/6-31G method and basis set under a combined Opt+Freq calculation. Previously, Gaussian optimised the transition structures well enough using the Berny algorithm and as such it was used once again. The force constants were set to be calculated only once to simplify the calculations.
In both cases the resultant transition structures showed identical geometries to those obtained at the HF/3-21G level of theory with similar dihedral angles and similar distances between terminal carbon atoms at either end of each allyl fragment. The similarity between the two levels of theory does not extend to the total energy and activation energies however; these values have been tabulated below. Unfortunately the results for very low temperature could not be obtained despite altering the Gaussian input file in wordpad as instructed. Because of this these results have not been included below.
Summary of energies (in hartree)
| HF/3-21G | B3LYP/6-31G* | |||||
|---|---|---|---|---|---|---|
| Electronic energy | Sum of electronic and zero-point energies | Sum of electronic and thermal energies | Electronic energy | Sum of electronic and zero-point energies | Sum of electronic and thermal energies | |
| at 1.0 K | at 298.15 K | at 1.0 K | at 298.15 K | |||
| Chair TS | -231.619322 | - | -231.461341 | -234.505467 | - | -234.356751 |
| Boat TS | -231.602802 | - | -231.445298 | -234.492915 | - | -234.345053 |
| Reactant (anti2) | -231.692540 | - | - | -234.559700 | -234.416250 | -234.408950 |
*1 hartree = 627.509 kcal/mol
Summary of activation energies (in kcal/mol)
| HF/3-21G | HF/3-21G | B3LYP/6-31G* | B3LYP/6-31G* | Expt. | |
| at 0 K | at 298.15 K | at 0 K | at 298.15 K | at 0 K | |
| ΔE (Chair) | - | 45.94 | - | 34.03 | 33.5 ± 0.5 |
| ΔE (Boat) | - | 56.31 | - | 41.91 | 44.7 ± 2.0 |
As expected, the total energies of the transition states are higher than the reactant/product molecules. As before the higher level of theory yields lower energy values as the HF method often tends to overestimate the energy terms. Interestingly, the energies of the chair and boat transition structure do not closely match their respective Gauche-2 and Gauche-4 products as predicted by analysing their geometries. In this case the high energy transition states more closely match the anti- conformations for instance. This is an interesting result as it seems to go against Hammond's postulate which states that the preferred geometry is the one closest in free energy to the transition state. Because the methods/basis sets used are still only at medium level theory it is perhaps the case that the "true" transition energy does in fact match that of the respective Gauche conformers.
The higher activation energy to the boat transition state suggests that this would be a slower pathway and potentially the thermodynamically controlled pathway. The lower activation energy to the chair transition state however, suggests that reaction via this pathway would be quicker making it potentially kinetically controlled. Given that the same product may be derived from each pathway by virtue of interconversion at room temperature such a suggestion is hard to validate.
The Diels-Alder Cycloaddition
Using the techniques learned in the first part of this module the transition structures of some Diels-Alders reactions will be found and characterised. In the first part, Cis-butadiene and its molecular orbitals will be looked at before characterising the transition structure arising from the reaction of cis-Butadiene with ethylene. In the final part, the same in depth analysis of the reaction of cyclohexa-1,3-diene with maleic anhydride will be performed.
Cis-Butadiene and Ethylene
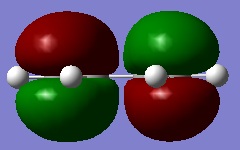
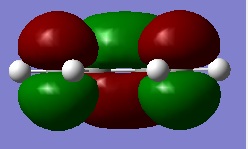
First of all, the structure of cis-butadiene was drawn into GaussView and optimised using the AM1 semi-empirical MO method. This is done so that the HOMO and LUMO of cis-butadiene may be plotted and their respective plane symmetries determined. The HOMO and LUMO of cis-butadiene are pictured on the right.
Considering the plane of symmetry is perpendicular to the molecular plane it can be said that the HOMO is anti-symmetric and the LUMO symmetric with respect to the plane of symmetry.
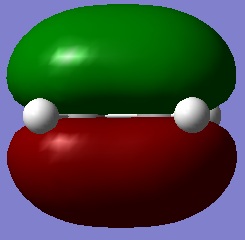
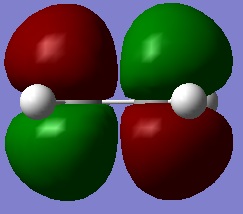
Next, an Ethylene molecule was drawn into GaussView and was optmised in the same way. Doing so yielded the HOMO/LUMO pictures shown on the right. As these pictures illustrate, the HOMO is symmetric and the LUMO anti-symmetric with respect to the plane of symmetry.
A reaction is allowed if it results from a HOMO/LUMO interaction. If this reaction is to be allowed the HOMO/LUMO of cis-butadiene must match the respective LUMO/HOMO of Ethylene. The molecular orbitals may overlap and interact if they share they same symmetry with respect to the molecule's plane of symmetry. Because the HOMO of cis-butadiene and the LUMO of Ethylene are both anti-symmetric with respect to the plane of symmetry they do in fact match one another and may mix. Equally, the LUMO of cis-butadiene and HOMO of Ethylene are both symmetric and may mix as well. Because such HOMO/LUMO interactions are possible this reaction is said to be allowed.
Because cis-butadiene contributes 4 π-electrons and ethylene contributes 2 π-electrons this reaction can be said to be a π4s+π2s cycloaddition reaction where the "s" refers to the suprafacial components dictating the bond formation at either end of the molecules. This is a result of the matching MO symmetries which means the bonds will form on the same face (top or bottom) of the terminal atoms on each molecule. Because bonds may form on either the top or bottom faces of the terminal atoms two products will be possible in theory, the endo- and exo- products. This is not a concern here however as there are no substituents on either reactant molecule.
To maximise the HOMO/LUMO overlap of the reactants the ethylene molecule lies above the cis-butadiene molecule resulting in a transition structure that represents an "envelope" type structure. This transition structure will be optimised using the QST3 method whereby Gaussian is provided with the reactant molecules, the product and a guess transition structure as well. Whilst this method can be time consuming as each of the atoms must be labelled the same for each molecule group window it also more reliable if the transition structure isn't known or well understood.
According to literature[5] the forming Carbon-Carbon bond length is 1.93Å when the reaction proceeds via a diradical mechanism. The literature then goes on to say that this length is reduced when reacting in supra-supra manner which is the case here. Bearing this in mind the terminal Carbon atoms were placed approximately 1.8Å apart (simply a guess).
The transition structure was optimised using the semi-empirical AM1 method. This is ideal because it is medium level basis set/method and also allows the molecular orbitals of the resultant transition structure to be plotted.
The transition structure looked like this.
Cis-Butadiene/Ethylene TS |

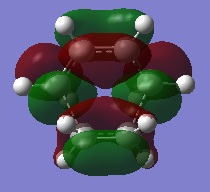
As this picture shows, the Ethylene molecule lies above the plane of the cis-butadiene molecule forming a transition structure which looks almost like a boat conformation. The transition structure has C1 point group symmetry. Both Carbon-Carbon bonds that are being formed are 2.12Å in length. Interestingly this is larger than the suggested value provided by the literature above. Having said that, this value seems sensible given that the Van Der Waals radius of the Carbon atom is 1.7Å[6]. One would expect that for a bond to form there must be an attractive interaction between the terminal atoms before they are bonded. For an attractive non-bonding interaction the internuclear separation must lie outside the Van Der Waals radius of atoms in question. This is explains why the forming bond is perhaps slightly longer than expected. The original guess of approximately 1.7/1.8Å lies in the region where the interactions between 2 Carbon atoms become repulsive, as such this was an unreasonable guess in hindsight. Summing the Van Der Waals radii of both terminal Carbon atoms gives 2.8Å. Because the C-C interaction in the TS is less than this it may be confirmed that a bond is in the process of being formed.

GaussView shows the sp2 Carbon-Carbon bond lengths to be 1.4Å and the sp3 carbon-carbon bond lengths to be 1.38Å. Bearing this in mind it may be concluded that the bonds that are in the process of being made will shorten to approximately 1.38Å in the product as the terminal Carbon atoms are sp3 hybridised in the product. The frequency analysis shows a single imaginary frequency at -956cm-1 with an intensity of 6. This imaginary mode corresponds to the formation of both bonds at either end of both molecules. The imaginary mode of vibration is illustrated on the right.
This vibrational mode corresponds to the synchronous (symmetric) stretching of both forming Carbon-Carbon bonds. It can be concluded then that the two new bonds are formed synchronously to one another. The lowest positive frequency consists of a lateral twisting of the Ethylene molecule with respect to cis-butadiene about the newly forming bonds. For the two molecules to twist and bend with respect to each other it is fair to suggest that this lowest "real" vibration shows that there must be attractive interactions occurring between the terminal Carbon atoms.
The HOMO and LUMO of this transition structure are pictured right.
These molecular orbital pictures show that the cis-butadiene LUMO mixes with the HOMO of Ethylene to form the transition structure's LUMO. Conversely, the LUMO of Ethylene and the HOMO of cis-butadiene mix to form the transition structure's HOMO. As the pictures show, the transition structure's HOMO is anti-symmetric with respect to the plane of symmetry and its LUMO is symmetric with respect to the plane of symmetry. As described above, this reaction is allowed because the respective HOMO/LUMOs share the same symmetry and overlap very well.
Cyclohexa-1,3-diene and Maleic Anhydride
Next, the Diels-Alder reaction between cyclohexa-1,3-diene and Maleic Anhydride will be looked at. First of all the respective reactant molecules will be drawn and optimised separately before a guess transition structure will be drawn and optimised. The reactant molecules were optimised using the DFT B3LYP method and 6-31G basis set to improve the initial guesses as much as possible. Additionally, the both the exo- and endo- products were drawn and optimised at the same level of theory. Having done this the QST3 method was used once again to find the optimised transition structure for each reaction. The transition structure optimisation was first carried out at the lower level AM1 semi-empirical level of theory. In the additional keywords section "Opt=NoEigen" was typed and the force constants were specified to be calculated only once. These results seem sensible and as such will be used for MO analysis.
A higher level of theory will be used however to more accurately look at the geometric properties and total energies of each transition structure. Bearing this in mind, the resultant transition structures were re-submitted for a combined optimisation and frequency calculation using the higher B3LYP/6-31G level of theory.
Pictured on the right are the transition structures obtained from the B3LYP/6-31G level of theory.


As obtained by B3LYP/6-31G, imaginary frequencies of -448cm-1 for the exo- TS and -446cm-1 for the endo- TS were found. A single imaginary mode of vibration for each structure shows that a transition state has been achieved.
The total energies (obtained from the B3LYP/6-31G level of theory) for the exo- and endo- transition structures are -612.4910 Hartrees and -612.4955 Hartrees respectively. Although the energy difference between the two is quite small this result suggests that the exo- transition structure is higher in energy than the endo- transition structure. This will be revisited later on.
The Carbon-Carbon forming bonds in the exo- transition structure are 2.29Å in length and are 2.28Å in the endo- transition structure . The added bulk surrounding the terminal Carbon atoms will likely have increased the Van Der Waals radius increasing the repulsive term on shorter length non-bonded interactions. Accordingly the forming bonds are slightly longer than those seen for the previous cycloaddition reaction.
The through-space distance between the (O=C)-O-(C=O) group from the maleic anhydride molecule and the H2C-CH2 bridge of the cyclohexa-1,3-diene molecule in the exo- transition structure is approximately 3.34Å. The through-space distance between the same maleic anhydride-derived group and the HC=CH group of cyclohexa-1,3-diene in the endo- transition structure is approximately 2.28Å. The reduced distance of the through-space interaction of the endo- transition structure suggests that there will be a larger steric factor and greater non-bonded repulsion. It may also be seen from the TS pictures on the right that the Hydrogen atoms on the maleic anhydride molecule will unfavourably interact with those of the opposing H2C-CH2 group in the endo- TS. Such 1,3 interactions are highly destabilising and are not present in the exo- TS. This contradicts the total energies obtained above and would suggest that the exo- TS should form faster (i.e kinetic pathway). Obviously, this is not the case.
To fully understand what is going on, one must also look at any secondary orbital overlap interactions which occur between these groups. Before this can be done, one must look at the HOMOs of each transition state.
| Endo- TS | Exo- TS |
|---|---|
 |

|
| Maleic Anhydride LUMO | Cyclohexa-1,3-diene HOMO |
|---|---|
 |

|
It can be seen that in the endo- transition structure there is a significant orbital overlap between the C=C π*-orbital and what could be either the C=O π*-orbital or a C-O σ*-orbital. There seems to be no such orbital overlap between the same C/O based orbitals with the opposing H2C-CH2 group's orbitals. This in-phase orbital overlap would be stabilising and as such can be used to explain why the endo- transition state is actually lower in energy despite steric considerations. The second table shows that these transition structure structure molecular orbital pictures arise from the interaction of maleic anhydride's LUMO and the HOMO of cyclohexa-1,3-diene. One may assume then that the converse interaction of maleic anhydride's HOMO and the LUMO of cyclohexa-1,3-diene gives rise to the LUMO in both transition states.
Because the endo- transition state is lower in energy it is the lower energy pathway and has a lower activation energy relative to the exo- transition state. These results would perhaps suggest then that the endo- transition state leads to the kinetic product where the product which is formed the fastest predominates (due to lower activation energy barrier). Unfortunately this technique does not consider the control of the reaction or the conditions (thermodynamic/kinetic control?) and as such cannot predict which product will predominate or why.
Computationally it is also very difficult to account for solvent effects and the like. It is possible that changing the solvent may stabilise a particular transition state more or less than the other hence favouring the reaction pathway suggested to be less favourable and less likely by computer run calculations.
The conditions under which the reaction can be run are not consider computationally. For instance it is possible that this reaction may be promoted either by light or by heat. The type of transition state the reaction proceeds through depends on these conditions and may give different outcomes as a result. Again this is something which would have to be determined experimentally in the lab.
Bearing this in mind it may be concluded that computational techniques are extremely useful for interpreting reaction pathways and calculating activation energies. Whilst this is a particularly useful and powerful tool to have available it is only useful in predicting reaction pathways, such a technique tends to fall apart when it comes to determining thermodynamic/kinetic control of a reaction and which product will predominate. Carrying out experiments such as this in the lab still prove the definitive means of fully understanding a reaction pathway and the preferred product.
Reference
- ↑ 1.0 1.1 1.2 https://wiki.ch.ic.ac.uk/wiki/index.php?title=Mod:phys3#Appendix_1
- ↑ B.G. Rocque, J.M. Gonzales, H.F. Schaefer, An Analysis of the Conformers of 1,5-hexadiene, Molecular Physics, 2002, Vol. 100, No. 4, 441-446 DOI:10.1080/00268970110081412
- ↑ 3.0 3.1 https://wiki.ch.ic.ac.uk/wiki/index.php?title=Image:Gauche2.jpg
- ↑ https://wiki.ch.ic.ac.uk/wiki/index.php?title=Image:Gauche4.jpg
- ↑ F. bernardi, A. Bottoni, M. Olivucci, J.J.W. Mcdouall, M.A. Robb, G. Tonachini, Potential Energy Surfaces of Cycloaddition Reactions, Journal of Molecular Structure, 165, 1988, pp. 341-351.
- ↑ F.A. Carey, R.J. Sundberg, Advanced Organic Chemistry Part A: Structure and Mechanisms, 5th Edition, 2007, pp. 24-25.
