Rep:Mod:jm3109
Joe McDermott Wiki, Module 1
The basic techniques of molecular mechanics and semi-empirical molecular orbital methods for structural and spectroscopic evaluations
The Hydrogenation of Cyclopentadiene Dimer
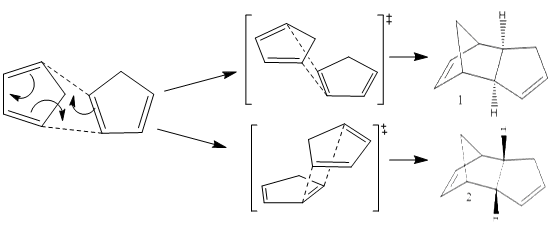
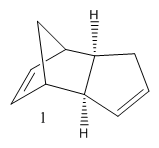
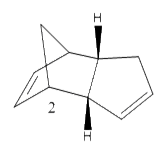
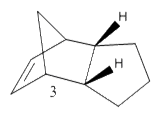
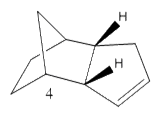
Cyclopentadiene has many different applications in chemistry, can be used as a precursor for a popular ligand or some homogeneous catalyst. The ligand form (Cp) has the formula C5H5- which is useful due to the variations of its hapticity; cyclopentadiene is the ligand used in the synthesis of ferrocene. Dimerisation occurs between cyclopentadiene molecules via a Diels-Alder 4πS + 2πS cycloaddition reaction; this can be problematic when preforming synthesis reactions. The dimer returns to a polymer upon heating. The cyclopentadiene dimer can be either the exo(molecule 1) or endo(molecule 2) isomer; hydrogenation of the endo isomer produces molecules 3 and 4.
|
|
|
|
|---|
Dimerisation Mechanism
Results
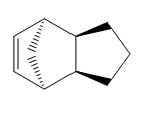
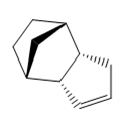
Using molecular modeling methods on ChemBio 3D the optimized geometries and energies could be determined for each isomer and hydrogenated isomer of dicyclopentadiene. Table 1 and 2 below show the optimized geometries and energies respectively.
| Compound 1 (exo) | Compound 2 (endo) | Compound 3 | Compound 4 |
|---|---|---|---|

|

|
|
|
Table 1
| Compound | Stretch/kcalmol-1 | Bend/kcalmol-1 | Stretch-Bend/kcalmol-1 | Torsion/kcalmol-1 | Non-1,4 VDW/kcalmol-1 | 1,4 VDW/kcalmol-1 | Dipole/Dipole/kcalmol-1 | Total Energy/kcalmol-1 |
|---|---|---|---|---|---|---|---|---|
| 1 | 1.29 | 20.58 | -0.84 | 7.65 | -1.42 | 4.23 | 0.38 | 31.88 |
| 2 | 1.25 | 20.85 | -0.84 | 9.51 | -1.54 | 4.32 | 0.45 | 34.00 |
| 3 | 1.28 | 19.87 | -0.83 | 10.81 | -1.22 | 5.63 | 0.16 | 35.69 |
| 4 | 1.10 | 14.50 | -0.55 | 12.50 | -1.07 | 4.51 | 0.14 | 31.15 |
Table 2
After comparing the optimized energies (table2) of compounds 1 (exo) and 2 (endo) the exo isomer is found to have the lower energy and therefore is the more thermodynamically stable isomer by 2.12 kcalmol-1. This is due to 1-4 strain which is present in the endo isomer and not the exo. So the exo isomer is expected to be dominant but Diels-Alder cycloaddition reactions are under kinetic not thermodynamic control, which means that endo isomer is dominant[1].
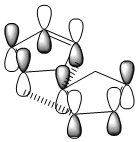
Transition states for the endo approach are lower in energy and therefore more stable than the those for the exo isomer. Secondary orbitals of cyclopentadiene have a greater HOMO-LUMO overlap for the endo approach (Figure 1) than the exo approach (Figure 2). Diels-Alder cycloaddition reactions will proceed via the most stable transition state which means the endo isomer is dominant.[2].

|
|
|---|---|
| Figure 1 endo approach | Figure 2 exo approach |
Hydrogenation of the endo dimer
Compound 4 has a lower energy and is therefore more thermodynamically stable than compound 3 by 4.54kcalmol-1; the main difference between the two compounds is due to bending energy, with a change in 5.37kcalmol-1 from compound 3 to compound 4. The carbons in the alkene are sp2 hybridized, so are most stable when at the ideal angle of 120o. Compound 4's angle of 113.0o is closer to ideal angle than compound 3's angle of 107.8o; so there is more angular strain for compound 3 than compound 4, thus making compound 3 the most thermodynamically stable.

|

|
|---|---|
| Figure 3 compound 3 | Figure 4 compound 4 |
Compound 4 has a lower total energy than endo compound 2 so this hydrogenation is thermodynamically favorable.
Stereochemistry and Reactivity of an Intermediate in the Synthesis of Taxol
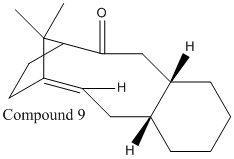
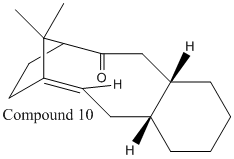
Taxol is an important drug used in treatment of ovarian cancers; compound 9 or 10 is an intermediate in its synthesis. Compounds 9 and 10 are isomers with the carbonyl group changing its orientation between "up" and "down"; this is an example of atropisomerism which arises due to high steric demands of the compounds preventing free rotation of the carbonyl group about the single bond.
|
|
|---|
Using molecular modeling methods MM2 and MMFF94 on ChemBio 3D the optimized geometries and energies could be determined for each isomer, results are shown in table 3. Using these optimization methods it was found that the chair conformation is the most stable conformation for cyclohexane.
| Compound | Stretch/kcalmol-1 | Bend/kcalmol-1 | Stretch-Bend/kcalmol-1 | Torsion/kcalmol-1 | Non-1,4 VDW/kcalmol-1 | 1,4 VDW/kcalmol-1 | Dipole/Dipole/kcalmol-1 | Total Energy (MM2)/kcalmol-1 | Total Energy (MMFF94)/kcalmol-1 | Geometry using MMFF94 |
|---|---|---|---|---|---|---|---|---|---|---|
| 9 | 2.79 | 16.54 | 0.43 | 18.24 | -1.55 | 13.11 | -172 | 47.84 | 70.54 | |
| 10 | 2.62 | 11.34 | 0.34 | 19.67 | -2.16 | 12.87 | -2.00 | 42.68 | 60.56 |
Table 3
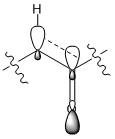
The "down" isomer, compound 10, is shown to be the more thermodynamically stable of the two compounds by 5.16 kcalmol-1 when using MM2 optimization method and by 9.98kcalmol-1 when using the MMFF94 optimization method. The compound 10 is the preferred isomer due to σ(C-H) orbital overlapping with π*(C=O) orbital when the carbonyl group is "down" providing stability, illustrated in figure 5; this conjugation doesn't occur in compound 9 when the carbonyl group is "up".
|
|---|
| Figure 5 |
These contributions are not analyzed by the MM2 optimization method as it does not include molecular orbital interactions, this may be why the MMFF94 optimization method shows a larger difference in energy of the two isomers.
Compounds 9 and 10 are both very unreactive and are referred to as a group of olefins called hyperstable olefins; due to the strain of the compounds compared to the saturated or parent hydrocarbon, this is caused by the positioning of the double bond which gives a more cage like structure and decreasing the reactivity[3].
Modelling Using Semi-empirical Molecular Orbital theory
The reaction between compound 12 and dichlorocarbene, (shown below), happens via a [1+2] cycloaddtion and forms two different products with the syn trichloride being the dominant product. This section will concentrate on the electrophilic attack of compound 12.
Results
Table 4 shows the molecular orbitals of compound 12 obtained using MOPAC/PM6 in ChemBio 3D.
| HOMO-1 | HOMO | LUMO | LUMO+1 | LUMO+2 |
|---|---|---|---|---|

|

|

|

|

|
Table 4
The HOMO shows that the double bond syn to the chlorine has a large proportion of electron density on the π bond, so this π bond will be the most reactive towards electrophilic attack. The LUMO shows that the double bond anti to the chlorine has a large π * antibonding orbital, so this π bond will be the most reactive towards nucleophilic attack. Considering the HOMO and LUMO it can be concluded that the dichlorocarbene will attack at the syn π bond.
The HOMO-1 shows a large proportion of electron density at the anti double π bond. The anti double bond is stabilized through orbital-orbital overlap with the σ* antibonding orbital of C-Cl, shown in the LUMO+1; the syn double bond does not have this stabilization. This explains the regioselectivity of the reaction between compound 12 and dichlorocarbene[4].
The double bond anti to the chlorine is hydrogenated, (shown below), the vibrational absorption frequencies for both this compound and compound 12 are calculated using B3LYP/6-31G(d,p)/PM6 with the values and symmetry for both compounds shown in table 5. The IR spectra for both compounds is shown in figure 6.
| IR for compound 12 | IR for hydrogenated compound 12 |
|---|---|

|

|
| DOI:10042/to-10353 | DOI:10042/to-10354 |
Figure 6
| Compound | Syn double bond stretch (cm-1) | Anti double bond stretch (cm-1) | C-Cl bond stretch (cm-1) | Symmetry |
|---|---|---|---|---|
| Compound 12 | 1757 | 1737 | 771 | Cs |
| Hydrogenated compound 12 | 1754 | N/A | 780 | C1 |
Table 5
The data from table 5 shows an increase in C-Cl wavenumber after hydrogenation of the double bond anti to the chlorine, therefore the C-Cl bond is stronger in the hydrogenated compound; also shows the presences of only one olefinic bond. The LUMO+1 shows donation of electron density from the anti double bond into the σ* of C-Cl causing it to weaken; so the loss of the anti double bond via hydrogenation is expected to strengthen the C-Cl, this is confirmed in table 5.
Monosaccharide chemistry: glycosidation
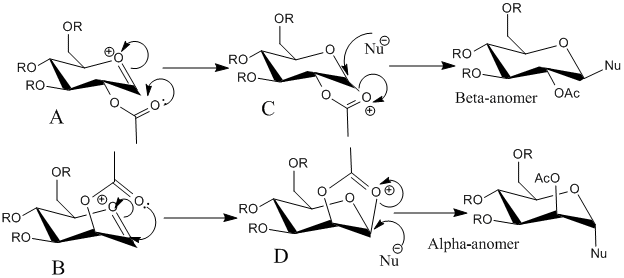
Glycosidation reactions involve replacing group X with a nucleophile, this is shown below with two sugars forming an alpha and a beta anomer due to the differing orientations of the OAc group on the carbon adjacent to where the addition is taking place; in C the orientation of OAc allows attack of the nucleophile from the top face of the molecule and in D the orientation of OAc allows attack of the nucleophile from the bottom face of the molecule. This is known as neighboring-group-partition and causes most glycosidation reactions to produce 1,2-trans products, but there are other possible conformers.
The two possible conformers are of the OAc group pointing "above" or "below" the plane of the molecule and both will be analyzed using MM2 and Mopac/PM6 to obtain optimized geometries and energies; a ' next to the letter used to represent each molecule means the OAc group is pointing in the opposite direction to what is shown in the image above.
For the calculations the R will be methyl groups as using methyl removes the possibility of hydrogen bonding in the molecule to avoid a large effect on the molecules geometry and energy. Also methyl has a much smaller electron count than OAc, 8 compared to 19 electrons, so a small work load.
Table 6 shows the minimized energies of each monosaccharide obtained using MM2 and Mopac/PM6.
| Monosaccharide | Stretch/kcalmol-1 | Bend/kcalmol-1 | Stretch-Bend/kcalmol-1 | Torsion/kcalmol-1 | Non-1,4 VDW/kcalmol-1 | 1,4 VDW/kcalmol-1 | Charge/Dipole/kcalmol-1 | Dipole/Dipole/kcalmol-1 | Total Energy (MM2)/kcalmol-1 | Total Energy (Mopac/PM6)/kcalmol-1 |
|---|---|---|---|---|---|---|---|---|---|---|
| A | 2.89 | 11.58 | 1.09 | 3.59 | 1.02 | 18.81 | -19.98 | 5.87 | 24.87 | -91.65 |
| A' | 2.59 | 11.72 | 1.01 | 1.46 | -2.66 | 18.18 | -2.25 | 4.84 | 34.90 | -77.40 |
| B | 2.85 | 11.43 | 1.02 | 2.01 | 0.89 | 18.43 | -21.03 | 6.23 | 21.82 | -88.73 |
| B' | 2.51 | 9.85 | 0.90 | 2.66 | -1.52 | 19.22 | -9.47 | 3.85 | 28.00 | -77.51 |
| C | 2.06 | 13.72 | 0.74 | 9.65 | -2.66 | 17.89 | -9.91 | -2.23 | 29.26 | -91.65 |
| C' | 2.69 | 20.03 | 0.86 | 8.46 | -2.82 | 18.62 | -2.70 | -1.40 | 43.72 | -67.00 |
| D | 1.81 | 20.05 | 0.74 | 9.41 | -2.27 | 17.92 | -22.88 | 0.10 | 24.88 | -90.51 |
| D' | 2.90 | 18.29 | 0.90 | 9.28 | -2.05 | 19.06 | 1.79 | -1.54 | 48.64 | -66.84 |
Table 6
Table 6 shows that the main factor effecting the difference in energy of A, A' and B, B' is due to the large difference in Charge/Dipole energy; 17.73kcalmol-1 and 11.56kcalmol-1 respectively. The large difference in Charge/Dipole energy is caused by the variation of the polar oxygen in the OAc groups orientation. The differences in all other energies of the two monosaccharides is minimal.
The C and D monosaccharides are much more thermodynamically stable the C' and D' isomers by 13.46kcalmol-1 and 23.76kcalmol-1 respectively.
For the Mopac/PM6 calculations monosaccharides A and C have exactly the same energy and monosaccharides B and D have very similar energies (difference of 1.78kcalmol-1). This is because Mopac/PM6 calculations incorporate neighboring-group-partitions so the intermediates will not be treated as classical carbocations.
Table 7 shows the optimized geometry of each monosaccharide obtained using MM2 and Mopac/PM6.
| Monosaccharide | Optimized geometry using MM2 | Optimized geometry using Mopac/PM6 |
|---|---|---|
| A | ||
| A' | ||
| B | ||
| B' | ||
| C | ||
| C' | ||
| D | ||
| D' |
Table 7
The optimization method MM2 does not take neighboring-group-partition into account so is less representative of the monosaccharide geometry compared to the Mopac/PM6 optimization method which does factor in neighboring-group-partition.
Structure based Mini project using DFT-based Molecular orbital methods
Assigning regioisomers in "Click Chemistry"
Introduced in 2001 by K.Barry Sharpless, "Click Chemistry" is a type of chemical philosophy tailored to produce substances quickly and reliably by joining small molecules together; inspired by nature where substances are generated by joining small modular units. An azide and an alkyne will react via a 1,3-dipolar cycloaddtion to give a 1,2,3-triazole, shown in figure 7 below where R1 is Ph and R2 is -CH2Ph as to correspond to the literature (ref given). Using a Cu(I) catalyst for the reaction yields a 1,4-isomer, structure A, whereas using a Ru(II) catalyst for the reaction yields a 1,5-isomer, structure B. Both catalyst greatly increase the rate of the reaction[5].
Figure 7
The aim of the mini project is to use molecular modelling techniques in ChemBio 3D and Gaussian to determine whether the isomers can be differentiated using their spectra.
Results
MM2 and Mopac/AM1 were used to find the optimized geometry and the minimized energy of both isomers A and B. Figure 8 shows the optimized geometries, a ' corresponds to geometries obtained using Mopac/AM1 and table 8 shows the minimized energies.
| Isomer A | Isomer A' | Isomer B | Isomer B' |
|---|---|---|---|

|

|

|

|
Figure 8
| Isomer | Stretch/kcalmol-1 | Bend/kcalmol-1 | Stretch-Bend/kcalmol-1 | Torsion/kcalmol-1 | Non-1,4 VDW/kcalmol-1 | 1,4 VDW/kcalmol-1 | Dipole/Dipole/kcalmol-1 | Total Energy (MM2)/kcalmol-1 | Total Energy (Mopac/AM1)/kcalmol-1 |
|---|---|---|---|---|---|---|---|---|---|
| A | 0.77 | 13.17 | -0.03 | -14.98 | -1.58 | 14.70 | -1.39 | 10.66 | 142.13 |
| B | 1.11 | 18.30 | 0.11 | -15.72 | 0.72 | 14.37 | -1.66 | 17.22 | 143.44 |
Table 8
MM2 modeling method for isomer A shows the phenyl substituted at carbon 4 is in the same plane as the triazole and that the two aromatic rings are perpendicular to each other; the angle of the bridging carbon is 109.4°, this is very close to the expected 109.5° for an sp3 hybridized carbon bend. Mopac/AM1 modeling method for isomer B shows the phenyl substituted at carbon 1 is in the same plane as the triazole and that the two aromatic rings are still perpendicular to each other; the angle of the bridging carbon is 114.4°, this is larger than the MM2 angle so Mopac/AM1 will incorporate neighboring-group-partition between the two aromatic rings, which will repel each other.
MM2 modeling method for isomer B shows the phenyl substituted at carbon 5 is in the same plane as the triazole ; the angle of the bridging bond is 112.9°, this is greater than the expected value due repulsion between the two aromatic rings. Mopac/AM1 modeling method shows neither the phenyl or benzyl ring in plane with the triazole and a the bridging bond angle 115.0°, indicating a higher level of repulsion than in the simpler MM2 modeling method.
The MM2 optimization method shows that isomer A is more thermodynamically stable than isomer B by 6.56kcalmol-1. The greatest difference between the two isomers comes from the bend energy. The minimized energy obtained using Mopac/AM1 also confirms that isomer A is more thermodynamically stable. This is to be expected as isomer B is more sterically hinder so will have less free rotation of the phenyl groups.
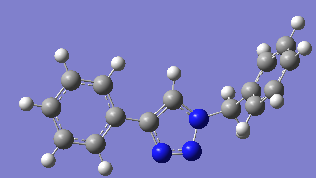
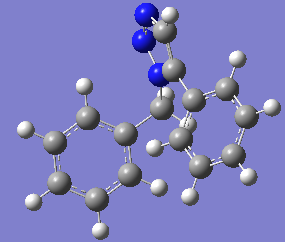
The geometry of both isomers was calculated again using Gaussian DFT=mpw1pw91 (d,p) through SCAN, the results are shown in table 9.
| Isomer A | Isomer B |
|---|---|
|
|
| DOI:10042/to-10366 | DOI:10042/to-10367 |
Table 9
The DFT calculated geometry for isomer A shows a bridging angle of 113.3° and the phenyl substitution at carbon 4 is still planar with the triazole. The DFT calculated geometry for isomer B shows a bridging angle of 112.8°.
NMR spectra
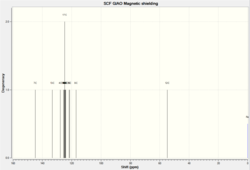
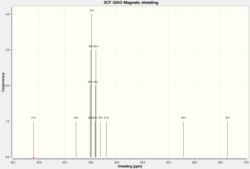
The 13C, 1H and 15N NMR's are shown below in table 10 for both of the isomers; the NMR's were obtained using Gaussian DFT/MPW1PW91/6-31G(d,p) through SCAN and using the GIAO approach.
| Isomer | Full NMR | 13C | 1H | 15N | DOI |
|---|---|---|---|---|---|
| A | 
|
|
|

|
DOI:10042/to-10369 |
| B | 
|

|

|

|
DOI:10042/to-10370 |
Table 10
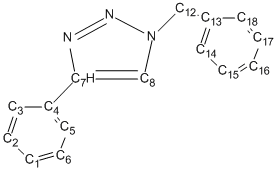
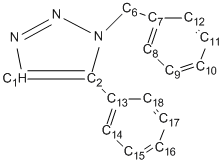
The 13C NMR analysis is shown below, table 11 corresponds to isomer A and table 12 corresponds to isomer B; both are compared to literature values[6] and discrepancy is calculated. The carbons attached directly to nitrogen are corrected using the equation δcorr = 0.96δcalc + 12.2, this is necessary because of errors caused by spin-orbital coupling.
| Carbon | Gaussian Shift ppm | Literature Shift ppm | Correction | Discrepancy |
|---|---|---|---|---|
| 1 and 6 | 124.5 | 129 | N/A | 4.5 |
| 2 | 125.2 | 129 | N/A | 3.8 |
| 3 and 5 | 121.4 | 126 | N/A | 4.6 |
| 4 | 127.7 | 130 | N/A | 2.3 |
| 7 | 144.8 | 149 | 151.2 | 2.2 |
| 8 | 117 | 120 | 124.5 | 4.5 |
| 12 | 54.9 | 54 | N/A | 0.9 |
| 13 | 133.2 | 134.5 | N/A | 1.3 |
| 14 and 18 | 124.3 | 128 | N/A | 3.7 |
| 15 | 125.6 | 129 | N/A | 3.4 |
| 16 and 17 | 124.7 | 129.5 | N/A | 4.8 |
Table 11
| Carbon | Gaussian Shift ppm | Literature Shift ppm | Correction | Discrepancy |
|---|---|---|---|---|
| 1 | 128.6 | 133.3 | 135.7 | 2.4 |
| 2 | 136.7 | 138.26 | 143.4 | 5.1 |
| 6 | 52.4 | 51.85 | N/A | 0.65 |
| 7 | 134.8 | 135.7 | N/A | 0.9 |
| 8 and 12 | 123.5 | 128.2 | N/A | 4.7 |
| 9 and 11 | 125.3 | 126.9 | N/A | 1.6 |
| 10 | 124.5 | 127.2 | N/A | 2.7 |
| 13 | 124.7 | 129.1 | N/A | 4.4 |
| 14 and 18 | 126.3 | 133.3 | N/A | 7 |
| 15 and 17 | 125.9 | 128.2 | N/A | 2.3 |
| 16 | 125.88 | 129.6 | N/A | 3.7 |
Table 12
The 13C NMR for isomer A (table 11) shows an average discrepancy of 3.27ppm with the largest being 4.8 ppm for carbons 16 and 17 which are on the benzene ring attached to nitrogen 1.
The 13C NMR for isomer B (table 12) shows an average discrepancy of 3.22 ppm with the largest being 7 ppm for carbons 14 and 18 which are on the phenyl ring attached to carbon 2 the most deshielded carbon; this could be the reason for the large discrepancy and the orientation of the ring to the carbon, being above the plane of the triazole would cause increased shielding on carbons 14 and 18.
Both sets of data match the literature reasonably well, isomer B has the lowest average discrepancy so matches its literature values slightly better than isomer A.
The best way to use 13C NMR to identify the two isomers is to concentrate on one or two carbons with large differences in ppm for each. Here the most convenient carbons to use are the two which are directly bonded to the nitrogens, carbons 7&8 for isomer A and carbons 1&2 for isomer B. These carbons are useful because going from isomer A to B carbon 7/1 becomes a lot more shielded and carbon 8/2 becomes a lot more deshielded; this is due to the change in coordination of the phenyl ring, the carbons with high chemical shift are attached to the phenyl ring as it is electron withdrawing and causes the deshielding.
IR spectra
The IR spectra of the isomers are shown in table 11 and were obtained using Gaussian b31yo/6-31G(d,p) through SCAN.
| Isomer A | Isomer B | |
|---|---|---|

|

| |
| DOI | DOI:10042/to-10374 | DOI:10042/to-10375 |
Table 13
The analysis for both IR spectra is shown in table 14 below.
| Stretch | Isomer A wavenumber (cm-1) | Isomer B wavenumber (cm-1) |
|---|---|---|
| N-N | 1309 | 1282 |
| C=C (benzyl) | 1665 | 1662 |
| C=C (phenyl) | 1665 | 1662 |
| CH2 | 3071 | 3076 |
Table 14
The majority of peaks in the IR spectra are very similar with one major difference being the N-N stretch, this was to be expected due to the change in phenyl positioning. The difference in N-N stretch is 27cm-1, this is slightly smaller than quoted in the literature, also the other absorptions are slightly different to the literature as was expected due to Gaussian's inaccuracies.
Conclusions and other tests
There was not much point in producing a 3J H-H coupling spectra as both isomers have a mostly flat structure nor an optical rotation as there is not a chiral carbon in either isomer. It would be useful to run an NOESY NMR as this would provide information about the distance between hydrogen atoms in both isomers.
Molecular modeling techniques used on ChemBio 3D proved useful in determining the relative energies of each isomer and obtained the expected result of isomer A being more thermodynamically stable. Gaussian DFT was a good method for optimizing the geometry of the isomers and this is shown in the high quality 13C NMR obtained. 13C NMR and IR spectra are useful methods of analysis for determining differences between isomers.
Conclusion
The use of MM2, Mopac/PM6 and Mopac/AM1 proved efficient in solving the energies and geometries of the investigated compounds, the few problems encountered were solved through chemical understanding of the compound being investigated. Mopac methods were found to be a more in depth way of determining energies and geometries, this was reflected in the longer running time for some of the more complected compounds. Spectra obtained through SCAN were analyzed to provide a method of detecting the difference between too isomers. Overall the project was successful.
References
- ↑ William L. Jorgensen et al, J. Am. Chem. SOC. 1993, 115, 2936-2942
- ↑ Daniel H. Ess Amy E. Hayden and K. N. Houk, J. Org. Chem. Vol. 73, No. 19, 2008
- ↑ Pelayo Camps, Francesc Perez and Santiago Vdzquez, Elsevier Science Ltd, 1997, Tetrahedron, Volume 53, Issue 28, 1997, 9727-9734
- ↑ B. Halton, R. Boese and H. S. Rzepa., J. Chem. Soc., Perkin Trans 2, 1992, 447
- ↑ Li Zhang, Xinguo Chen, Peng Xue, Herman H. Y. Sun, Ian D. Williams, K. Barry Sharpless, Valery V. Fokin, and Guochen Jia, J. Am. Chem. Soc. 2005, 127, 15998
- ↑ Li Zhang, Xinguo Chen, Peng Xue, Herman H. Y. Sun, Ian D. Williams, K. Barry Sharpless, Valery V. Fokin, and Guochen Jia, Supporting information, J. Am. Chem. Soc. 2005, 127, 15998

