Rep:Mod:jl7816
NH3
Information of NH3
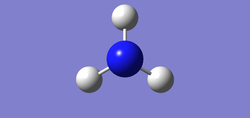
Image of NH3 molecule |
| Molecule Name | NH3 |
| Calculation Method | RB3LYP |
| Basic Set | 6-31G(d.p) |
| E(RB3LYP) | -56.55776873a.u. |
| RMS Gradient Norm | 0.00000485a.u. |
| Point Group | C3V |
| N-H Bond Length | 1.30Å |
| H-N-H Bond Angle | 109.471 |
Item Table
 Item               Value     Threshold  Converged?
 Maximum Force            0.000004     0.000450     YES
 RMS     Force            0.000004     0.000300     YES
 Maximum Displacement     0.000070     0.001800     YES
 RMS     Displacement     0.000033     0.001200     YES
 Predicted change in Energy=-5.785197D-10
The optimisation file is liked to log file link
Display Vibration Modes of NH3
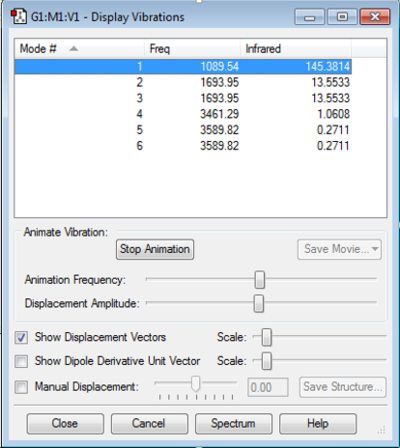
How many modes do you expect from the 3N-6 rule?
3x4-6= 6 modes
Which modes are degenerate (ie have the same energy)?
Modes 2 and 3 are degenerated, and modes 5 and 6 are degenerated.
Which modes are "bending" vibrations and which are "bond stretch" vibrations?
Modes 1,2 and 3 are "bending" vibrations, modes 4,5 and 6 are "bond stretch" vibrations.
Which mode is highly symmetric?
Mode 4 is highly symmetric.
One mode is known as the "umbrella" mode, which one is this?
Mode 1.
How many bands would you expect to see in an experimental spectrum of gaseous ammonia?
Four.
Charge Analysis of NH3
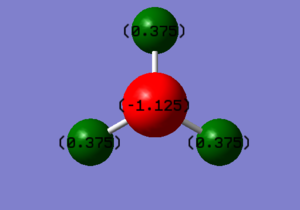
The charge on N is -1.125 and the charge on H is 0.375.
The N atom would be expected to be negatively charged and H atom would be expected to be positively charged, because nitrogen atom is more electronegative than hydrogen atom.
N2
Information of N2

Image of N2 molecule |
| Molecule Name | N2 |
| Calculation Method | RB3LYP |
| Basic Set | 6-31G(d.p) |
| E(RB3LYP) | -109.52412868a.u. |
| RMS Gradient Norm | 0.00000003a.u. |
| Point Group | D∞h |
Item Table
 Item               Value     Threshold  Converged?
 Maximum Force            0.000000     0.000450     YES
 RMS     Force            0.000000     0.000300     YES
 Maximum Displacement     0.000000     0.001800     YES
 RMS     Displacement     0.000000     0.001200     YES
The optimisation file is liked to log file link
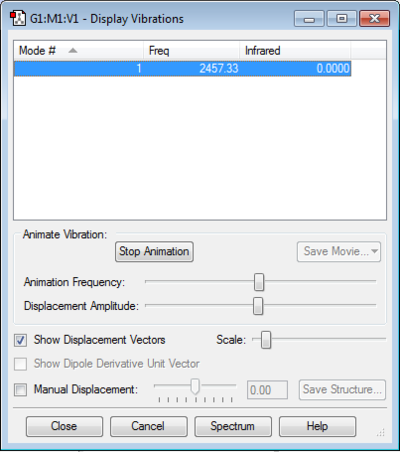
Display Vibration Modes of N2
H2
Information of H2

Image of H2 molecule |
| Molecule Name | H2 |
| Calculation Method | RB3LYP |
| Basic Set | 6-31G(d.p) |
| E(RB3LYP) | -1.17853936a.u. |
| RMS Gradient Norm | 0.00002276a.u. |
| Point Group | D∞h |
Item Table
 Item               Value     Threshold  Converged?
 Maximum Force            0.000039     0.000450     YES
 RMS     Force            0.000039     0.000300     YES
 Maximum Displacement     0.000052     0.001800     YES
 RMS     Displacement     0.000073     0.001200     YES
The optimisation file is liked to log file link
Display Vibration Modes of H2

Determining the energy in a.u. for the Haber-Bosch reaction (N2 + 3H2 → 2NH3)
Energy
E(NH3)= ''-56.55776873''
2*E(NH3)= ''-113.11553746''
E(N2)=''-109.52412868''
E(H2)=''-1.17853936''
3*E(H2)=''-3.53561808''
ΔE=2*E(NH3)-[E(N2)+3*E(H2)]=''-0.05579070''
Energy difference in kJ/mol
ΔE=-146.47848285
The product is more stable as it is an exothermic reaction, energy is released. Therefore, the product has a lower energy than the reactants.
The literature value of the energy change is -92.0kJ/mol.[1] Percentage error= (146.4785-92.0)/92.0= 59.2%. This %error is very large, which means the ΔE we have calculated is not accurate.
F2
Information of F2
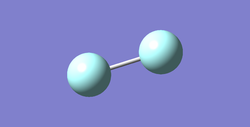
Image of F2 molecule |
| Molecule Name | F2 |
| Calculation Method | RB3LYP |
| Basic Set | 6-31G(d.p) |
| E(RB3LYP) | -199.49825220a.u. |
| RMS Gradient Norm | 0.00000019a.u. |
| Point Group | D∞h |
| F-F Bond Length | 1.40298Å |
Item Table
 Item               Value     Threshold  Converged?
 Maximum Force            0.000000     0.000450     YES
 RMS     Force            0.000000     0.000300     YES
 Maximum Displacement     0.000000     0.001800     YES
 RMS     Displacement     0.000001     0.001200     YES
 Predicted change in Energy=-1.347388D-13
The optimisation file is liked to log file link
Display Vibration Modes of F2

Charge Analysis of F2
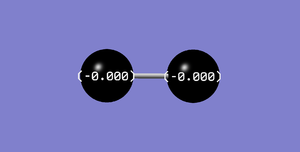
The charges on both F atom are 0 as they are non-polar and have the same electronegativity.
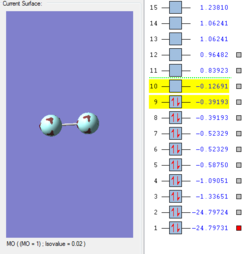
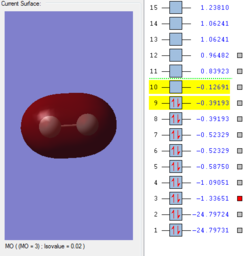
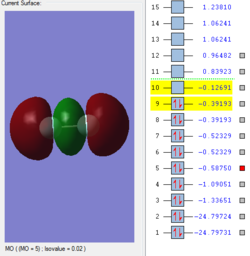
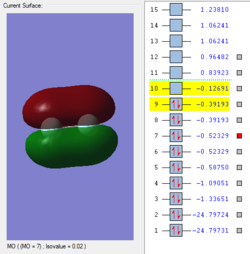
Molecular Orbitals of F2
References
[1]Literature value: https://chem.libretexts.org/Core/Physical_and_Theoretical_Chemistry/Equilibria/Case_Studies/Haber_Process

