Rep:Mod:jl5810mod2
Week 1
BH3 Optimisation
Using the 3-21G Basis Set
A molecule of BH3 was created in GaussView and optimised. Optimisation involves approximating the energy by solving the Schrodinger equation for the electronic distribution for a given arrangement of the composite atoms. The atoms are then moved and the energy approximated again. This is repeated for many arrangements until a minimum is found, which is the optimised geometry. All optimisations are carried out using the B3LYP method, which determines the type of approximations used to solve the Schrodinger equation, and for this first optimisation the 3-21G basis set, which has a fairly low accuracy, is selected. The optimised bond length is 1.19A and the bond angle is 120.0o.
Here is the .log optimisation file calculated by GaussView File:JAL BH3 OPT 3 21G.LOG
Here is the summary of the BH3 optimisation.
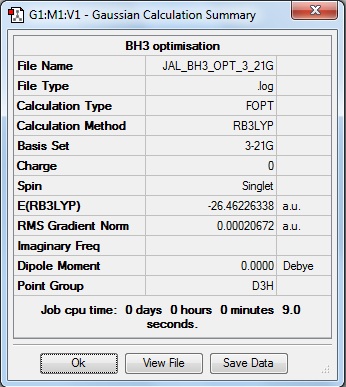
The RMS Gradient Norm value is less than 0.001, which shows a minimum has been found and that the optimisation has worked. Further to this, the following "Item table" shows the forces and displacements have converged, which means that for a small change in either of these the energy of the molecule does not change.
         Item               Value     Threshold  Converged?
 Maximum Force            0.000413     0.000450     YES
 RMS     Force            0.000271     0.000300     YES
 Maximum Displacement     0.001610     0.001800     YES
 RMS     Displacement     0.001054     0.001200     YES
 Predicted change in Energy=-1.071764D-06
 Optimization completed.
    -- Stationary point found.
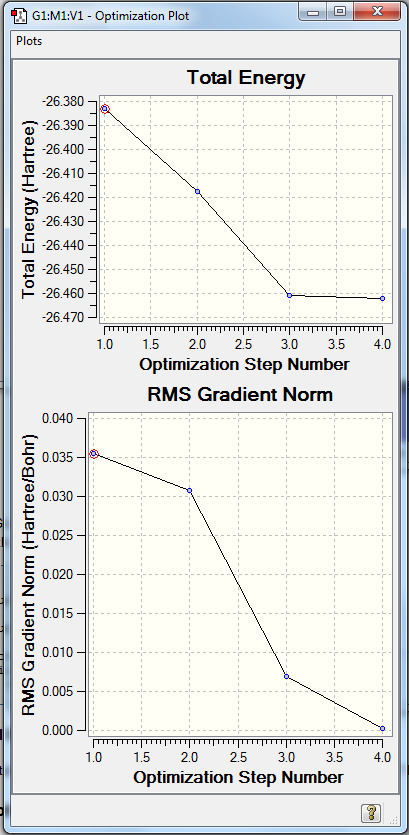
The following graphs show the energy and gradient as the BH3 molecule is optimised.
A Better Basis Set: 6-31G(d,p)
The previously optimised BH3 molecule was then further optimised, now using the 6-31G(d,p) basis set. The optimised bond length is 1.19A and the bond angle is 120.0o again (the bond length actually changes from 1.193 A to 1.192A with the reoptimisation, however the accuracy of Gaussian is insufficient to use these values).
Here is the .log optimisation file calculated by GaussView File:JAL BH3 OPT 6 31G DP.LOG
Here is the summary of the BH3 optimisation.
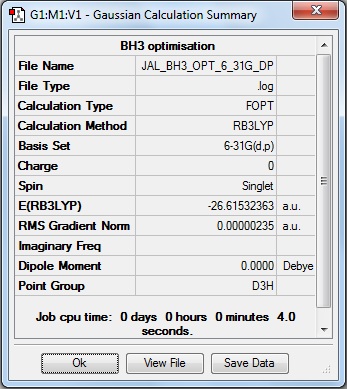
The RMS Gradient Norm value is less than 0.001, and the item table (below) shows the forces and displacements have converged, therefore the the optimisation was successful. It is noted that the specific value for the gradient, 0.00000235 a.u., is lower than the value after the less accurate optimisation, 0.00020672 a.u., highlighting the improved accuracy.
         Item               Value     Threshold  Converged?
 Maximum Force            0.000005     0.000450     YES
 RMS     Force            0.000003     0.000300     YES
 Maximum Displacement     0.000019     0.001800     YES
 RMS     Displacement     0.000012     0.001200     YES
 Predicted change in Energy=-1.304899D-10
 Optimization completed.
    -- Stationary point found.
BH3 Total Energy
The BH3 total energy from the 3-21G calculation is -26.46226338 a.u. = 69476.67 kJmol-1, and from the 6-31(d,p) calculation is -26.61532363 a.u. = 69878.53 kJmol-1.
TlBr3 Optimisation
Pseudo Potentials: The LanL2DZ Basis Set
A molecule of TlBr3 was created in GaussView and optimised using the B3LYP method with the LanL2DZ basis set. The LanL2DZ basis set uses a pseudo potential, which is used when a lot of electrons need to be considered. This is due to relativistic effects that cannot be accounted for by the standard Schrodinger equation. By assuming the chemistry is based on the valence electrons, the pseudo potential models the core electrons, making the calculation much simpler. However the calculation is still far more complicated than the previous optimisations, so they are run on the HPC service. The optimised bond length is 2.65A and the bond angle is 120.0o.
Here is the link to the deposited TlBr3 optimisation file in the "D-Space" DOI:10042/23383
Here is the summary of the TlBr3 optimisation.
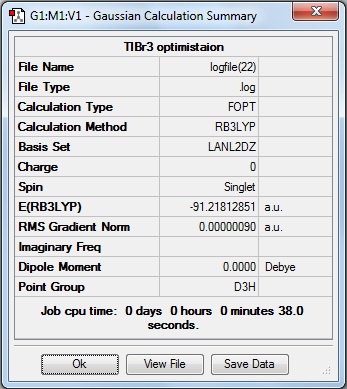
The RMS Gradient Norm value is less than 0.001, and the item table (below) shows the forces and displacements have converged, therefore the the optimisation was successful.
         Item               Value     Threshold  Converged?
 Maximum Force            0.000002     0.000450     YES
 RMS     Force            0.000001     0.000300     YES
 Maximum Displacement     0.000022     0.001800     YES
 RMS     Displacement     0.000014     0.001200     YES
 Predicted change in Energy=-6.084094D-11
 Optimization completed.
    -- Stationary point found.
TlBr3 Total Energy
The TlBr3 total energy is -91.21812851 a.u. = 239493.20 kJmol-1.
BBr3 Optimisation
Mixing 2 Basis Sets: GEN
A molecule of BBr3 was created in GaussView and optimised using the B3LYP method with the GEN basis set. This allows the basis set to be specified for each atom, and by editing the input file created (as below) we can use a 6-31G basis set for the boron atom, and a LanL2DZ basis set for the bromine atoms.
%chk=H:\3rdyearlabs\BBr3_opt_GEN.chk
# opt b3lyp/gen geom=connectivity pseudo=read gfinput

BBr3 optimisation

0 1
 B                  0.00000000    0.00000000    0.00000000
 Br                 0.00000000    2.02000000    0.00000000
 Br                 1.74937095   -1.01000064    0.00000000
 Br                -1.74937095   -1.01000064    0.00000000

 1 2 1.0 3 1.0 4 1.0
 2
 3
 4

B 0
6-31G(d,p)
****
Br 0
LanL2DZ
****

Br 0
LanL2DZ
The optimised bond length is 1.93A and the bond angle is 120.0o.
Here is the link to the deposited BBr3 optimisation file in the "D-Space" DOI:10042/23396
Here is the summary of the BBr3 optimisation.
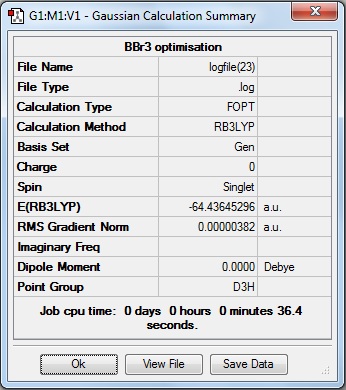
The RMS Gradient Norm value is less than 0.001, and the item table (below) shows the forces and displacements have converged, therefore the the optimisation was successful.
         Item               Value     Threshold  Converged?
 Maximum Force            0.000008     0.000450     YES
 RMS     Force            0.000005     0.000300     YES
 Maximum Displacement     0.000036     0.001800     YES
 RMS     Displacement     0.000023     0.001200     YES
 Predicted change in Energy=-4.026911D-10
 Optimization completed.
    -- Stationary point found.
Analysing the Results
Comparison of the BH3, BBr3 and TlBr3 Bond Lengths
The following table summarises the bond lengths of BH3, BBr3 and TlBr3.
| Bond Length (A) | Literature | |
| BH3 | 1.19 | 1.111 [1] |
| BBr3 | 1.93 | 2.005 [2] |
| TlBr3 | 2.65 | 2.498,[3] |
The literature values are all close to my predicted values, however the bond length references used a trigonal planar AB3 type structures in as similar molecules found.
By comparing the B-H and the B-Br bond lengths we can see the influence of the ligand on the bond length. The bromine atom is much larger than the hydrogen atom, so bromine's valence orbitals are a lot more diffuse. This leads to a less efficient overlap with the boron atom, where the electron density between the two is less than in the BH bond, which leads to a weaker, longer bond. Also, if the bond was any shorter there would be an unfavorable interaction between the shared bonding electrons and the core bromine electrons.
The hydrogen and bromine both form a covalent bond with the boron as they each have 1 unpaired electron in the valence shell. However bromine has 3 lone pairs in its valence shell, which hydrogen does not, which could interact with the boron's empty p orbital.
By comparing the B-Br and Tl-Br bond lengths we can see the influence of the central atom on the bond length. Similarly to the difference between hydrogen and bromine, the thallium is much larger than the boron, so its orbitals are much more diffuse which leads to a less efficient overlap than when boron is the central atom, and overall a weaker, longer bond.
Thallium and boron are both in group 3 of the periodic table. However due to the inert pair effect, boron prefers a +3 oxidation state, whereas thallium prefers +1. This is also reflected by the Tl-Br bond being longer as TlBr3 is less stable.
What is a Bond
A bond is the favorable electrostatic interaction between the negatively charged electrons of one atom with the positively charged nucleus of another. Gaussview draws bonds based on a distance criteria, where they have set a predetermined distance at which a bond is formed. If the molecule has the atoms further apart than this distance then it does not show a bond, however this is not to say the bond doesn't exist. There molecule will still be held together by the same forces, the interaction will just not be as strong so the bonds are longer.
BH3 Frequency Analysis
Predicting the Vibrational Stretches of BH3
A frequency analysis was performed on the previously 6-31G optimised BH3 molecule, again using the B3LYP method with the 6-31G basis set. The same basis set must be used for the frequency analysis as used in the optimisation as the basis set determines the accuracy of the calculation, and if different accuracies are used then they will not be compatible.
Here is the .log frequency analysis file calculated by GaussView File:JAMESLAMB BH3 FREQ.LOG
Here is the summary of the BH3 frequency analysis.
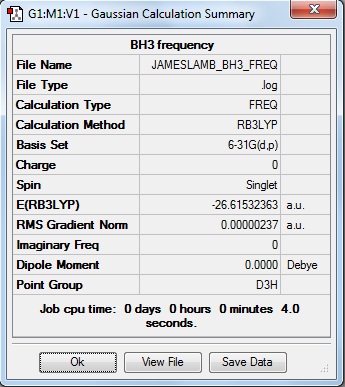
When a frequency analysis is performed, the second derivative of the potential energy surface is calculated. The potential energy surface maps the potential energy for different arrangements of a molecule. The second derivative tells us whether a minimum or a maximum is found. If all the frequencies are positive, then a minimum has been found, if one is negative then it is a transition state, and if more than one is negative the analysis failed. The first line of the following "Low Frequencies" represent the rotational and translational modes of the molecule, and should be close to 0cm-1. In general, if they are within +/- 15cm-1 then the frequency analysis was successful, as below. In addition all the frequencies are positive showing a minimum was found in the optimisation.
 Low frequencies ---   -0.9033   -0.7343   -0.0054    6.7375   12.2491   12.2824
 Low frequencies --- 1163.0003 1213.1853 1213.1880
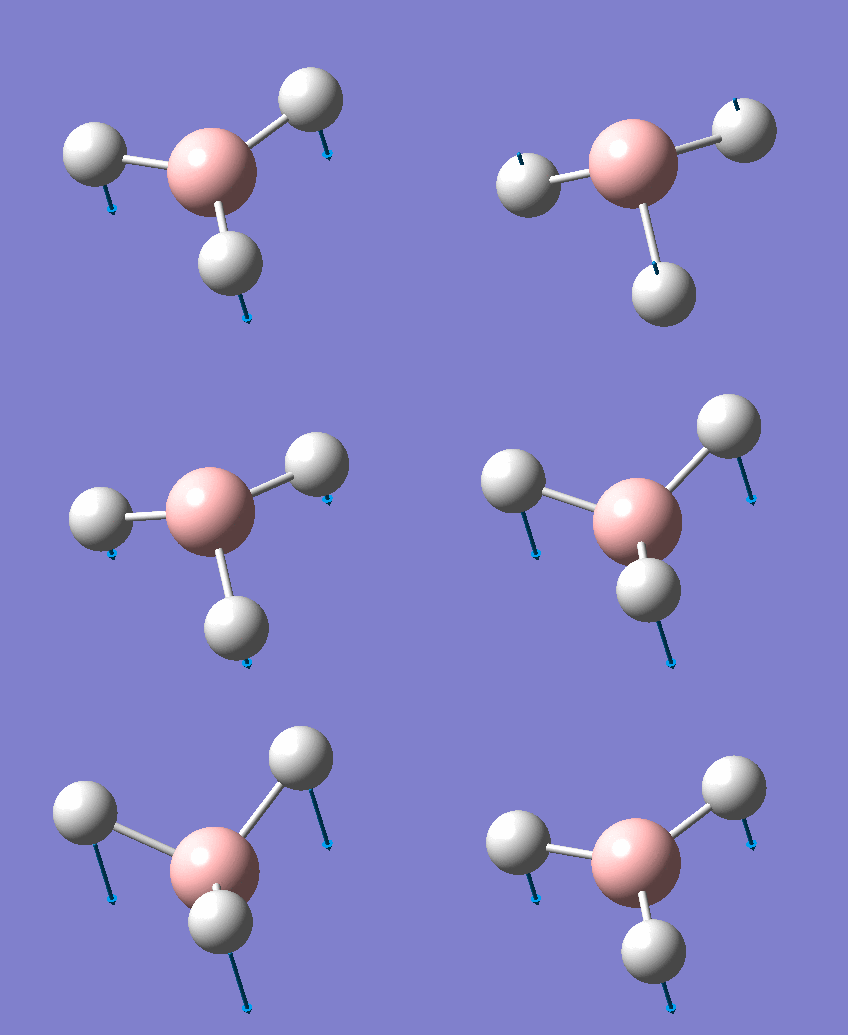
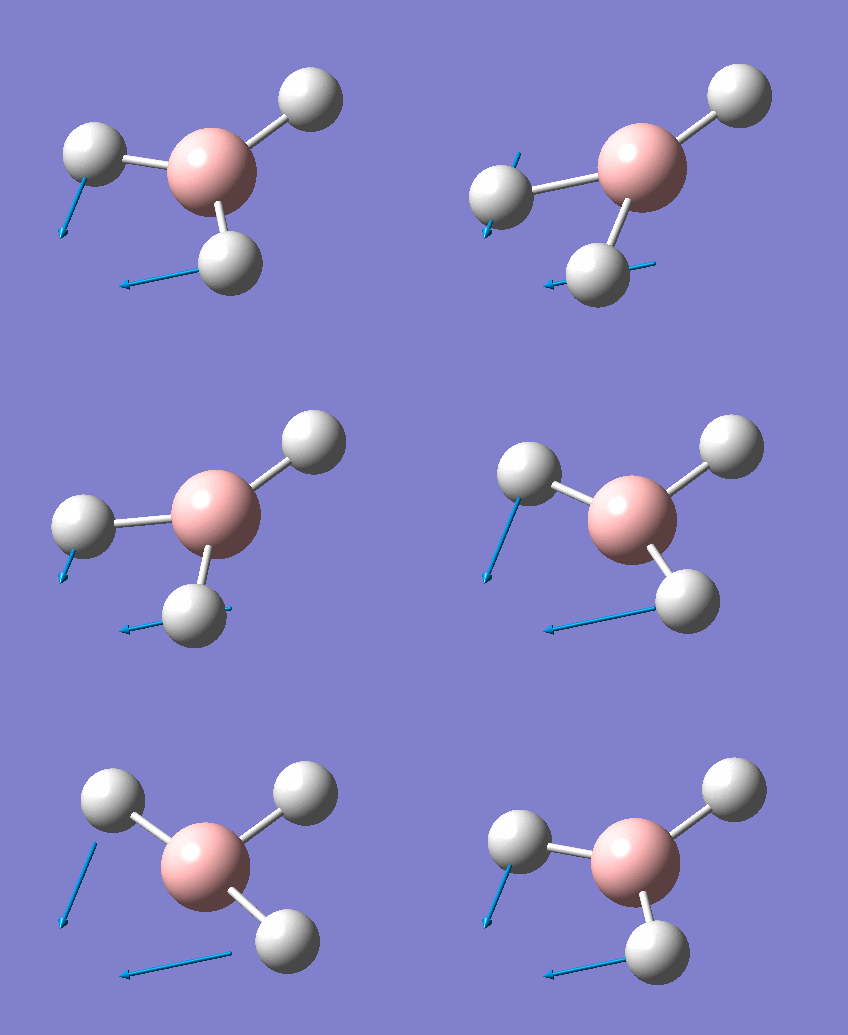
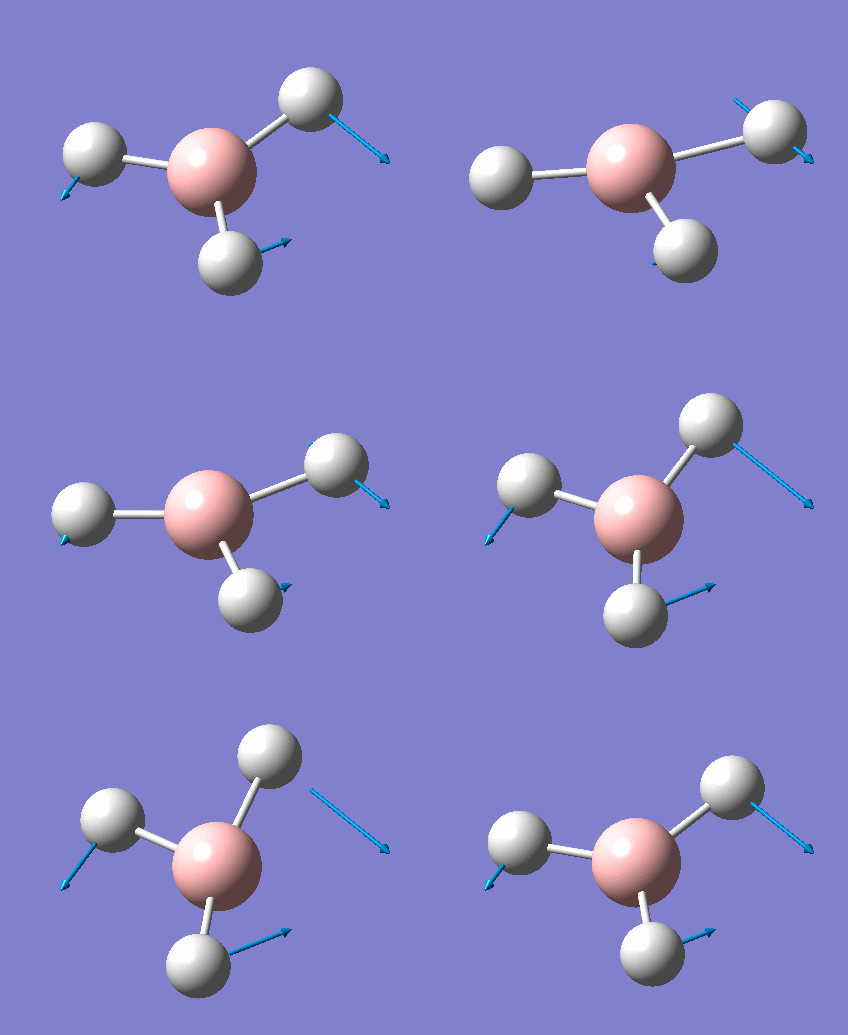
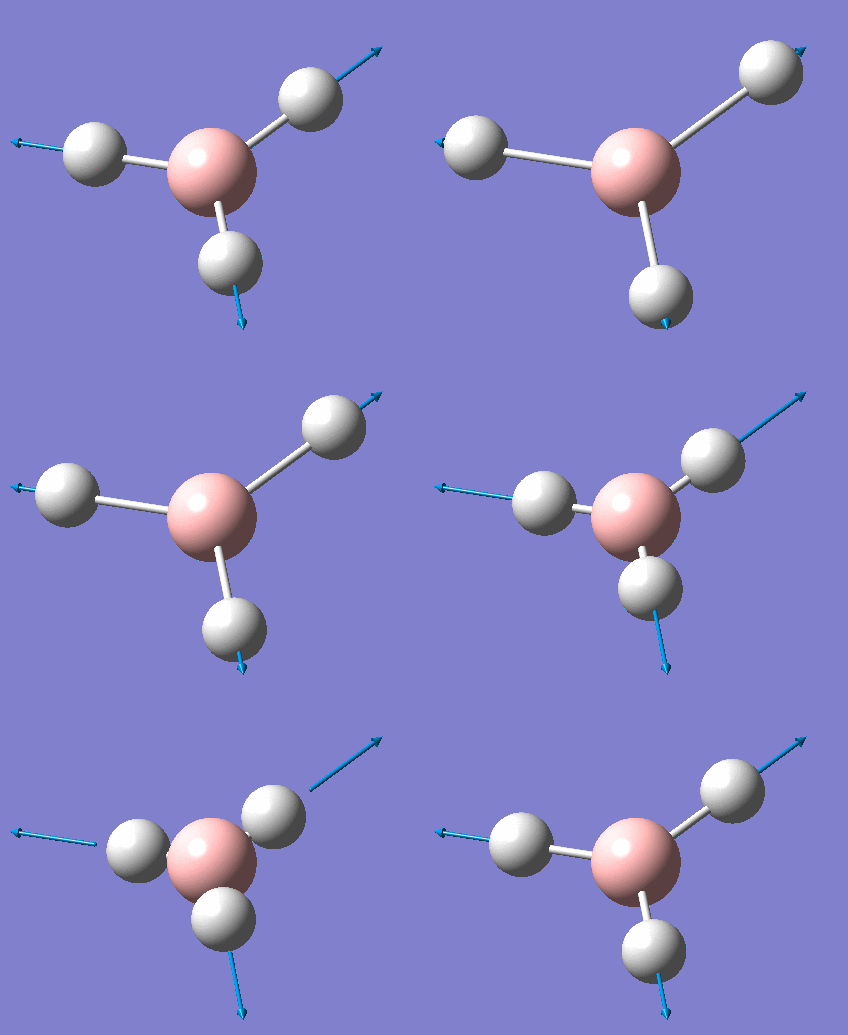
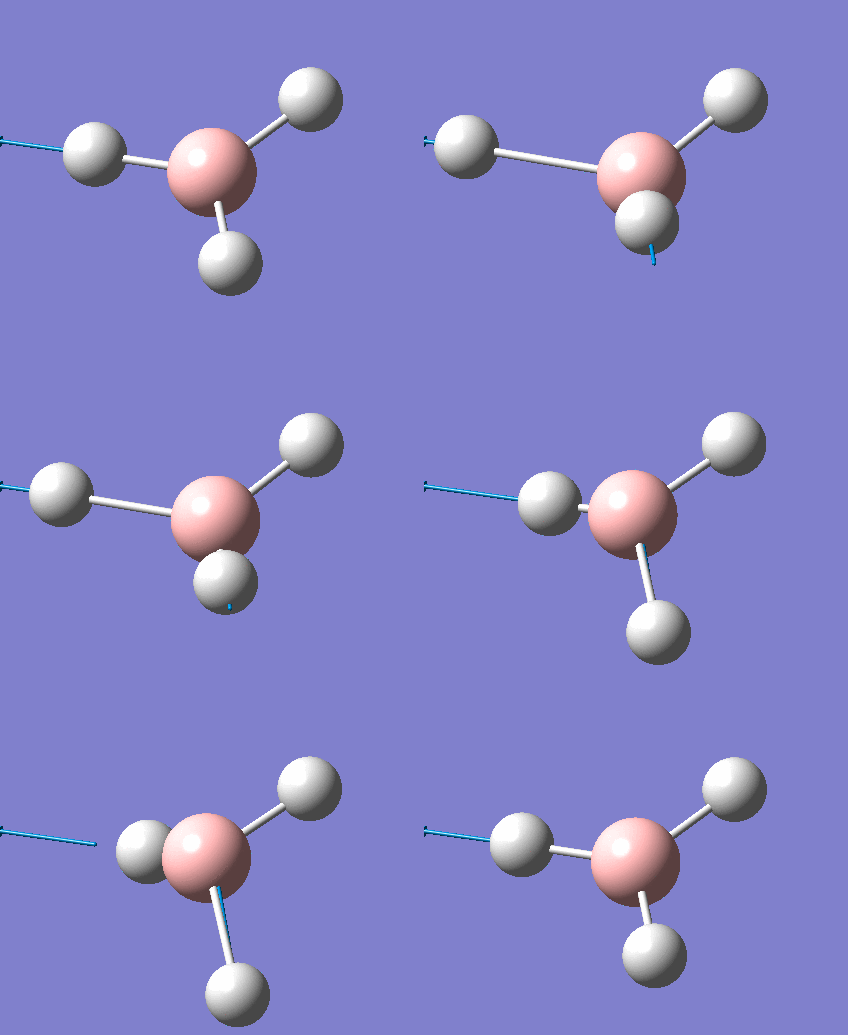
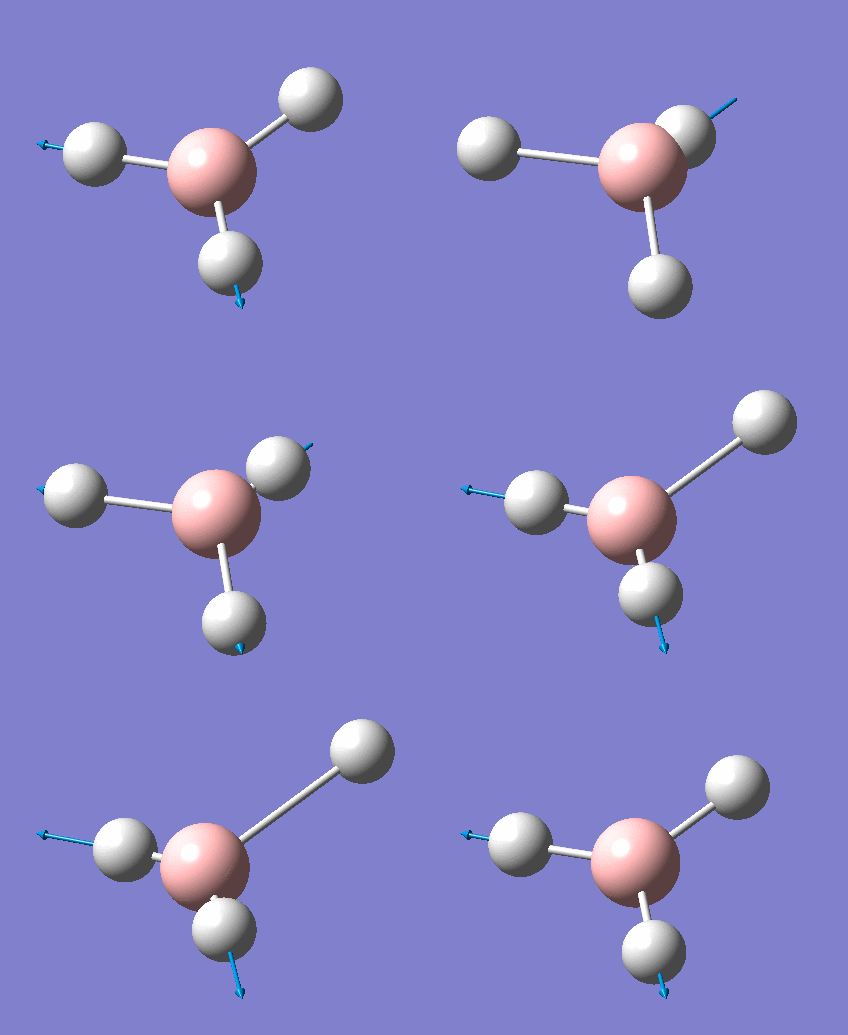
The following table summarises the BH3 IR stretching frequencies, the form of each vibration and the intensity.
Here is the predicted IR spectrum of BH3
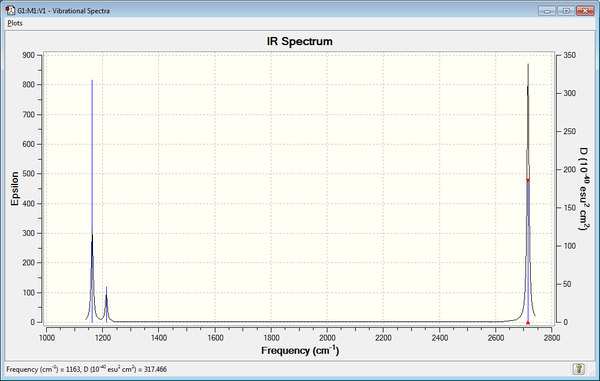
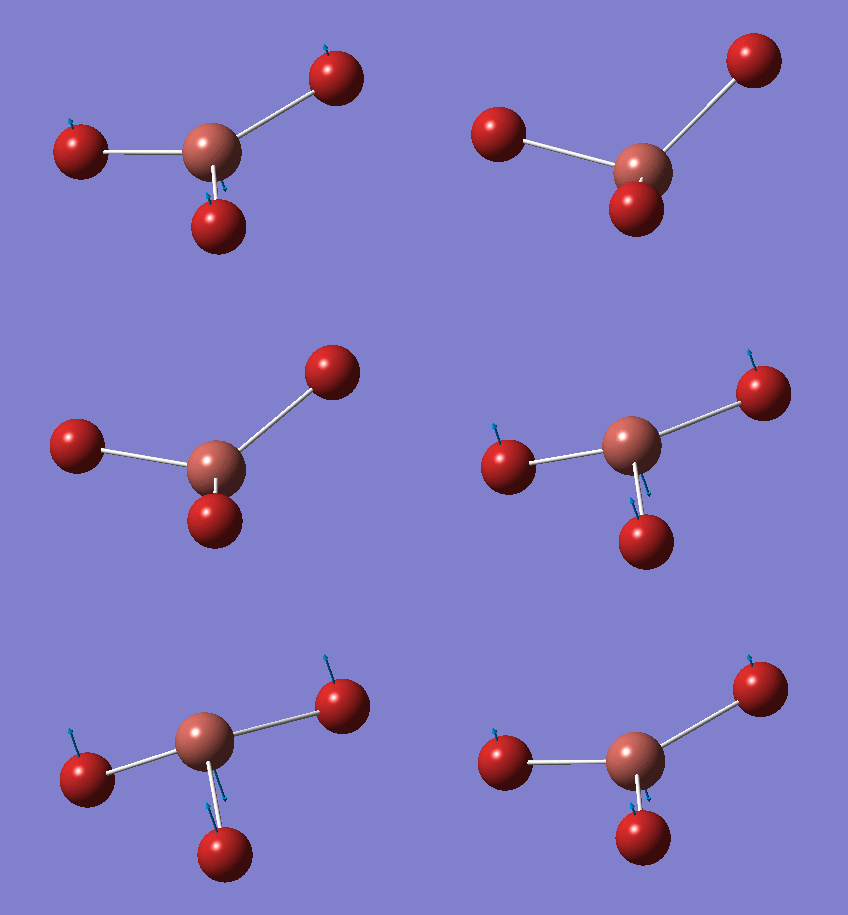
Even though we see 6 vibrational modes in the frequency analysis, the IR spectrum only shows 3 peaks. This is because the totally symmetric A1' mode does not have a change in the dipole moment, which means it is IR inactive. Of the 5 active modes left, there are 2 sets of doubly degenerate E' modes, which will produce only a single peak for each, so overall there are only 3 peaks observed, the A2" mode at 1163cm-1 and 2 E' modes at 1213 cm-1 and 2715cm-1.
TlBr3 Frequency Analysis
Predicting the Vibrational Stretches of TlBr3
A frequency analysis was performed on the previously LanL2DZ optimised TlBr3 molecule, again using the B3LYP method with the LanL2DZ basis set.
Here is the link to the deposited TlBr3 frequency analysis file in the "D-Space" DOI:10042/23455
Here is the summary of the TlBr3 frequency analysis.
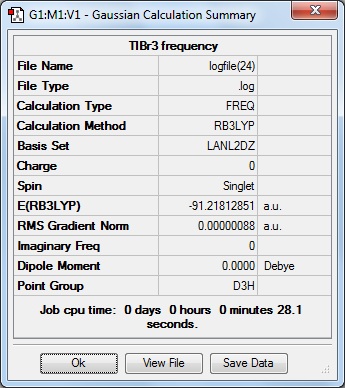
The following "Low Frequencies" are within +/- 15cm-1, and all the frequencies are positive showing the frequency analysis was successful and a minimum was found in the optimisation.
 Low frequencies ---   -3.4213   -0.0026   -0.0004    0.0015    3.9367    3.9367
 Low frequencies ---   46.4289   46.4292   52.1449
The lowest "real normal mode" is 46.4cm-1.
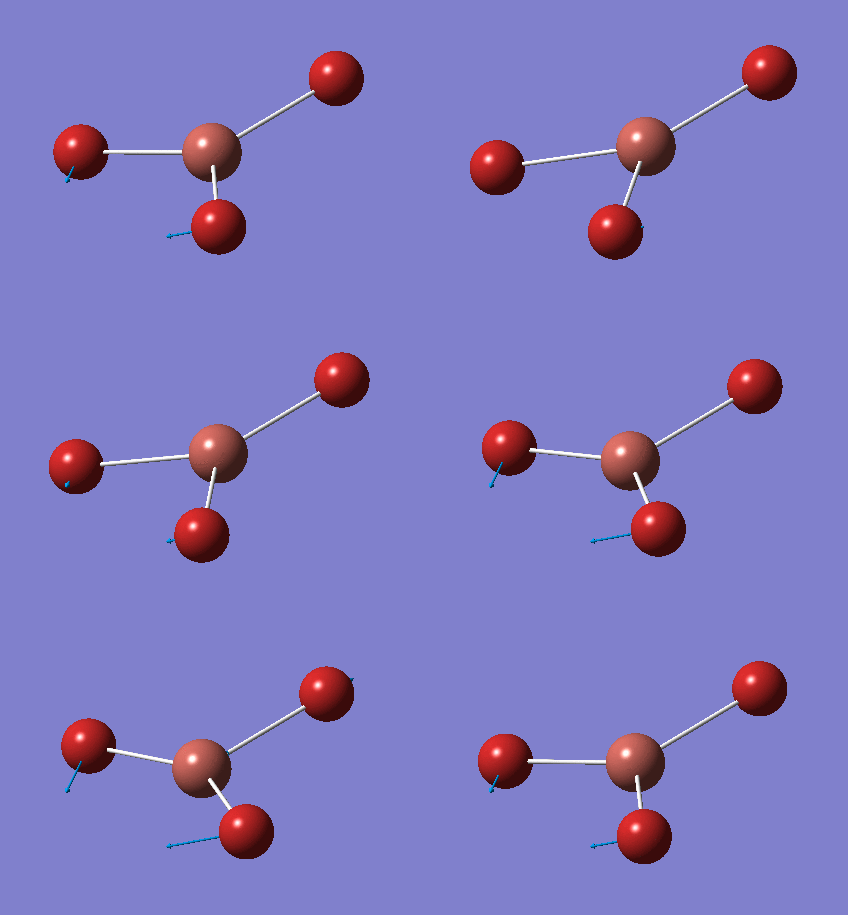
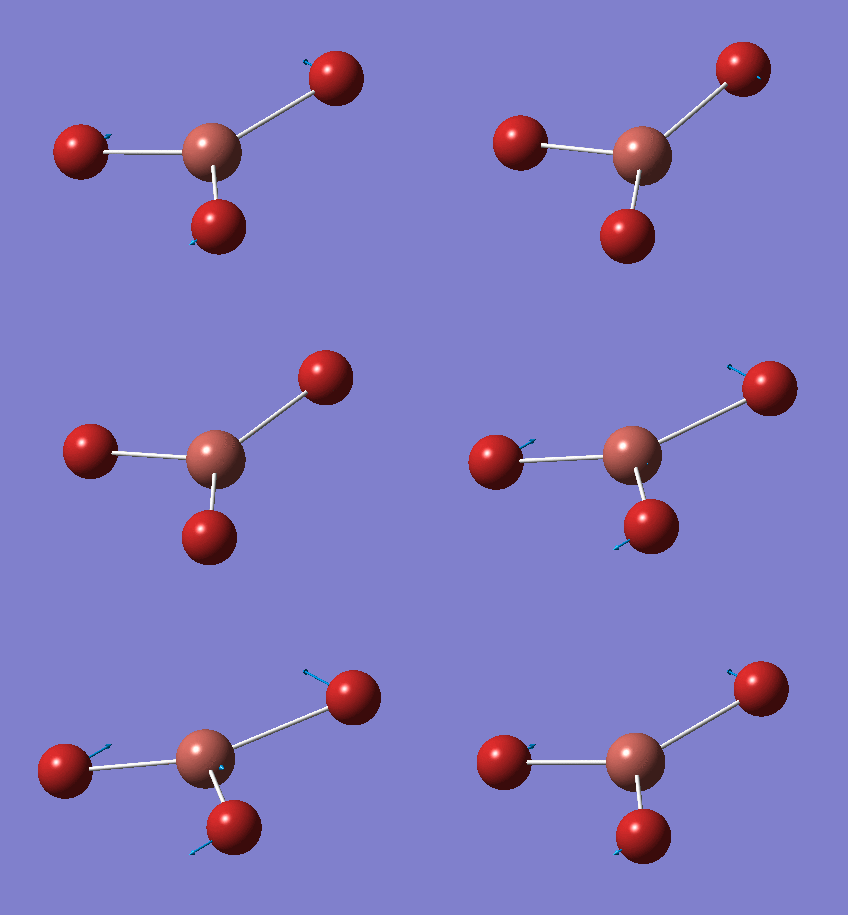
The following table summarises the TlBr3 IR stretching frequencies, the form of each vibration and the intensity.
Here is the predicted IR spectrum of TlBr3
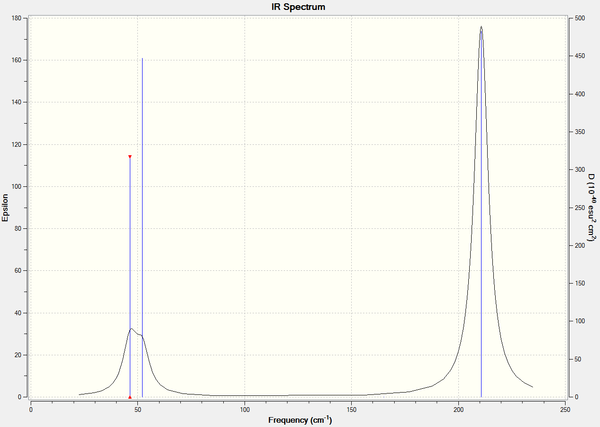
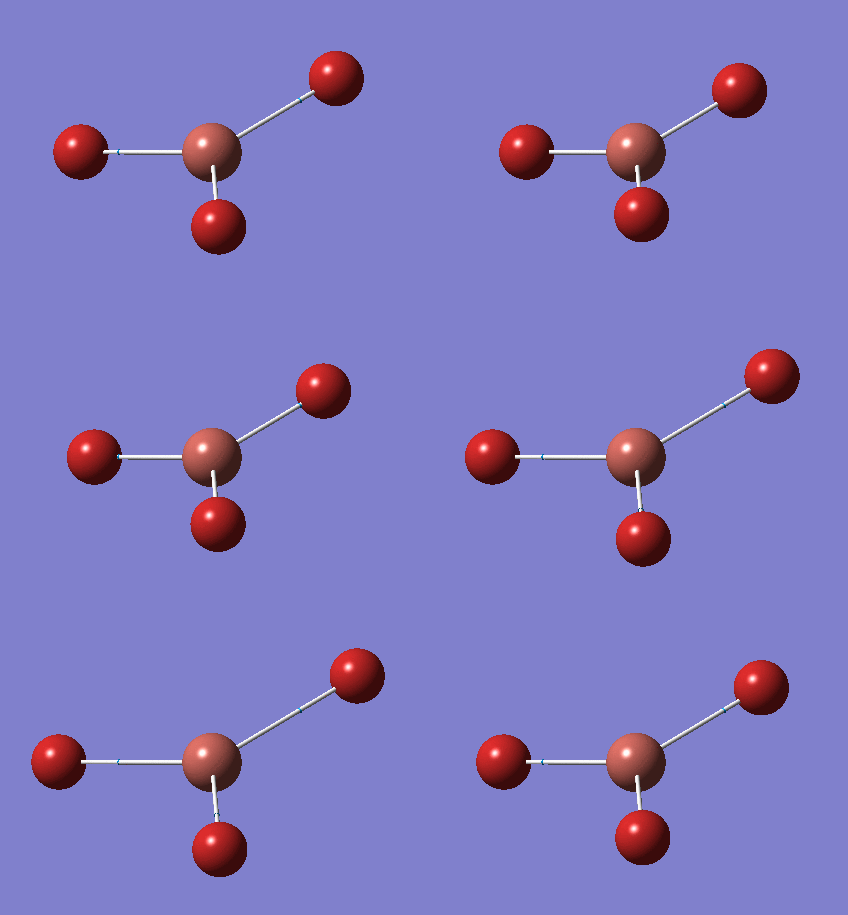
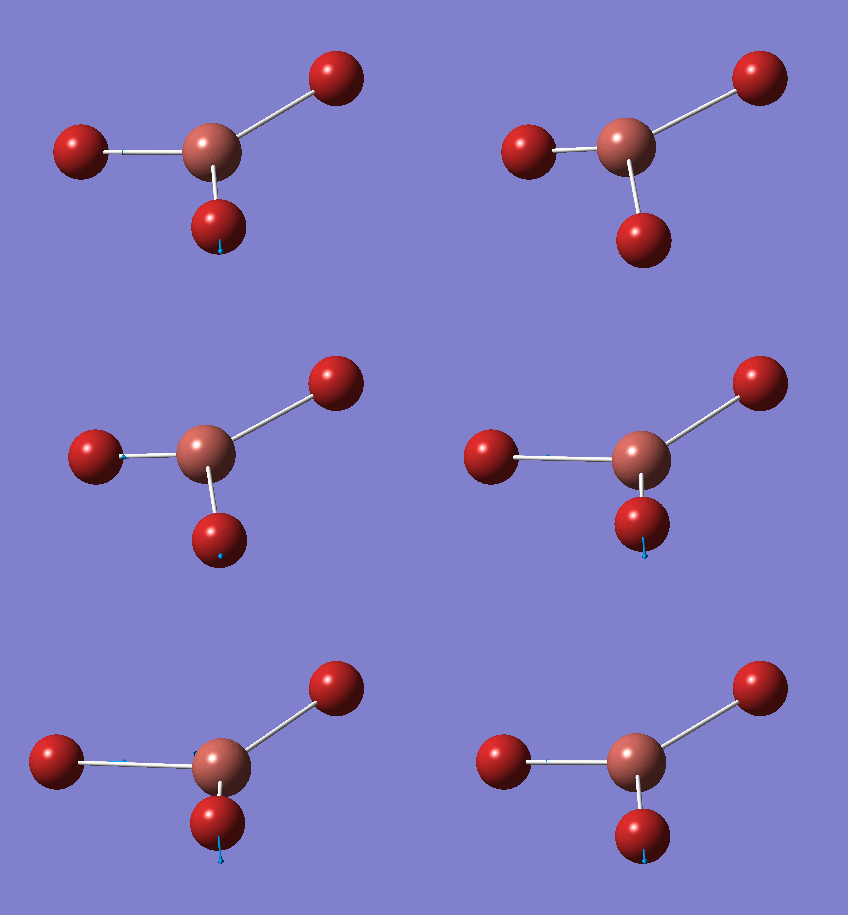
Much like the BH3 spectrum, there are only 3 peaks for the 6 vibrations as the A1' is IR inactive, and there are again 2 doubly degenerate E' modes. Therefore the peaks correspond to the A2" mode at 52cm-1 and 2 E' modes at 46cm-1 and 210cm-1.
Comparison of the BH3 and TlBr3 Frequencies
The following table summarises the vibrational frequencies, intensities and point groups of the BH3 and TlBr3 stretching modes.
| BH3 | TlBr3 | ||||
| Frequency (cm-1) | Intensity (cm-1) | Point Group | Frequency (cm-1) | Intensity (cm-1) | Point Group |
| 1163 | 93 | A2" | 46 | 4 | E' |
| 1213 | 14 | E' | 46 | 4 | E' |
| 1213 | 14 | E' | 52 | 5 | A2" |
| 2582 | 0 | A1' | 165 | 0 | A1' |
| 2715 | 126 | E' | 210 | 25 | E' |
| 2715 | 126 | E' | 210 | 25 | E' |
It is clear that the frequencies for the TlBr3 stretches are much smaller than for BH3. This is due to the Tl-Br bonds being weaker than the B-H bonds, as previously discussed. The frequency of a vibrational stretch can be approximated by Hooke's Law, at a classical level at least, where F = -kx, with the constant k being proportional to the bond strength. Therefore a weaker bond leads to a smaller frequency.
The A2" and lowest E' vibrational modes have interchanged when comparing BH3 to TlBR3. This is because in the A2" mode the central atom moves a lot more than in the E' mode. For TlBr3 the central atom is a lot heavier than the in BH3, so requires more energy, hence the reordering.
As the molecules have the same geometry, the spectra show the same number of peaks with a similar ordering. The A2" and lower E' modes lie close together, and the A1' and higher E' do too. The A1' and higher E' are much higher in energy for both molecules however. This is because in these modes the bond between the central atom and substituent stretches, which causes a change in the electron density so are far more energetic. The A2" and lower E' however are bending motions, in which there is little change in electron density so the frequencies are lower.
BH3 Analysis
BH3 Molecular Orbital Analysis
A molecular orbital analysis was performed on the previously 6-31G optimised BH3 molecule, again using the B3LYP method with the 6-31G basis set. The keyword pop=full was used and "Full NBO" was selected in the NBO tab.
Here is the link to the deposited BH3 MO analysis file in the "D-Space" DOI:10042/23494
Here is the summary of the BH3 MO analysis.
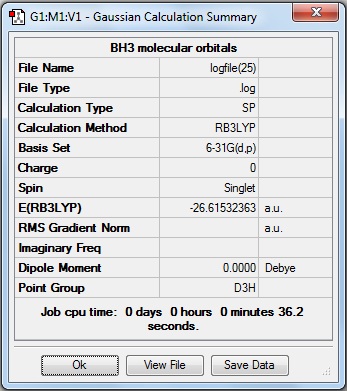
Here is a molecular orbital diagram of BH3 in which the calculated MOs have been matched to the corresponding LCAOs on the diagram.

It can be seen that the calculated molecular orbitals match well to the theoretical LCAOs. The orbitals have a greater delocalisation in those calculated by GaussView which is not accounted for in the LCAOs, however as a qualitative method they are very useful for predicting the shape and energy of molecular orbitals.
The following table summarises the energies of the first 8 molecular orbitals for NH3.
| MO Number | MO Shape | Energy (a.u.)
|
| 1 | 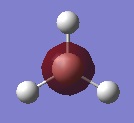 |
0.17929 |
| 2 | 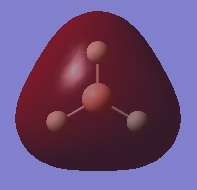 |
0.17929 |
| 3 | 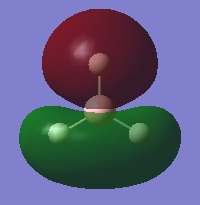 |
0.16839 |
| 4 | 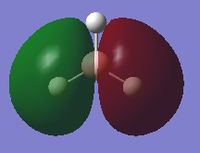 |
-0.06605 |
| 5 | 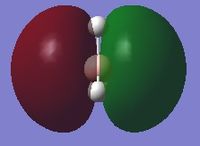 |
-0.35079 |
| 6 | 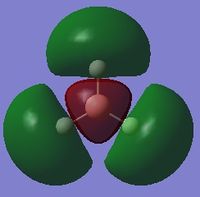 |
-0.35079 |
| 7 | 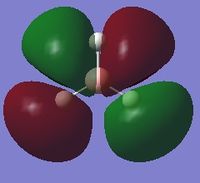 |
-0.51254 |
| 8 | 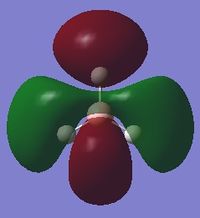 |
-6.77140 |
NH3 Analysis
NH3 Optimisation
A molecule of NH3 was created in GaussView and optimised using the B3LYP method with the 6-31G basis set. The "nosymm" keyword was used, as well as "integral=grid=ultrafine" and the "use tight convergence" option ticked. This is the case for all future calculations to improve the accuracy.
The optimised bond length is 1.02A and the bond angle is 105.7o. Literature values are close at 1.107A[4] and 107.8o[5].
Here is the link to the deposited NH3 optimisation file in the "D-Space" DOI:10042/23749
Here is the summary of the NH3 optimisation.
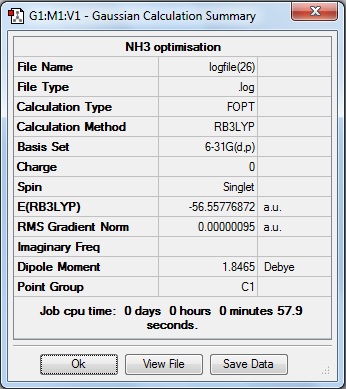
The RMS Gradient Norm value is less than 0.001, and the item table (below) shows the forces and displacements have converged, therefore the the optimisation was successful.
         Item               Value     Threshold  Converged?
 Maximum Force            0.000002     0.000015     YES
 RMS     Force            0.000001     0.000010     YES
 Maximum Displacement     0.000005     0.000060     YES
 RMS     Displacement     0.000003     0.000040     YES
 Predicted change in Energy=-9.676708D-12
 Optimization completed.
    -- Stationary point found.
NH3 Frequency analysis
A frequency analysis was performed on the previously 6-31G optimised NH3 molecule, again using the B3LYP method with the 6-31G basis set.
Here is the link to the deposited NH3 frequency analysis file in the "D-Space" DOI:10042/23751
Here is the summary of the NH3 frequency analysis.
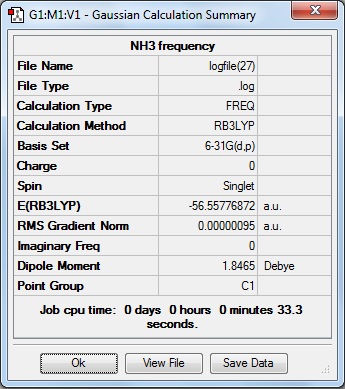
The following "Low Frequencies" are within +/- 15cm-1, and all the frequencies are positive showing the frequency analysis was successful and a minimum was found in the optimisation.
Low frequencies ---   -6.5472   -4.7621   -0.0002    0.0005    0.0006    1.3407
Low frequencies --- 1089.3505 1693.9257 1693.9298
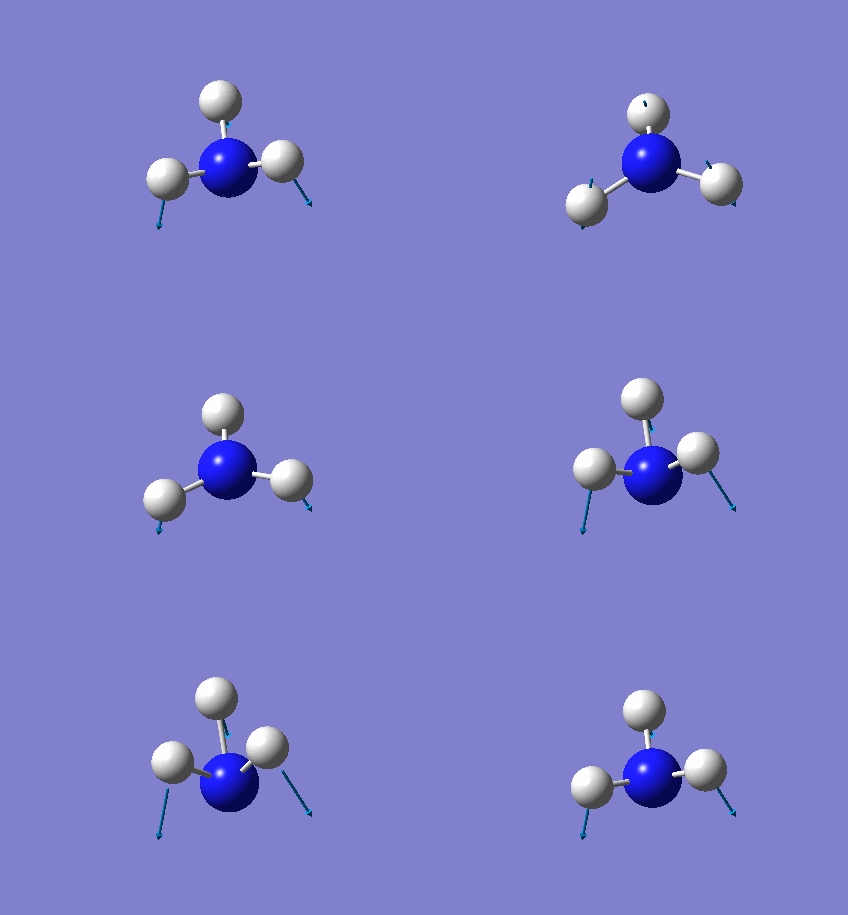
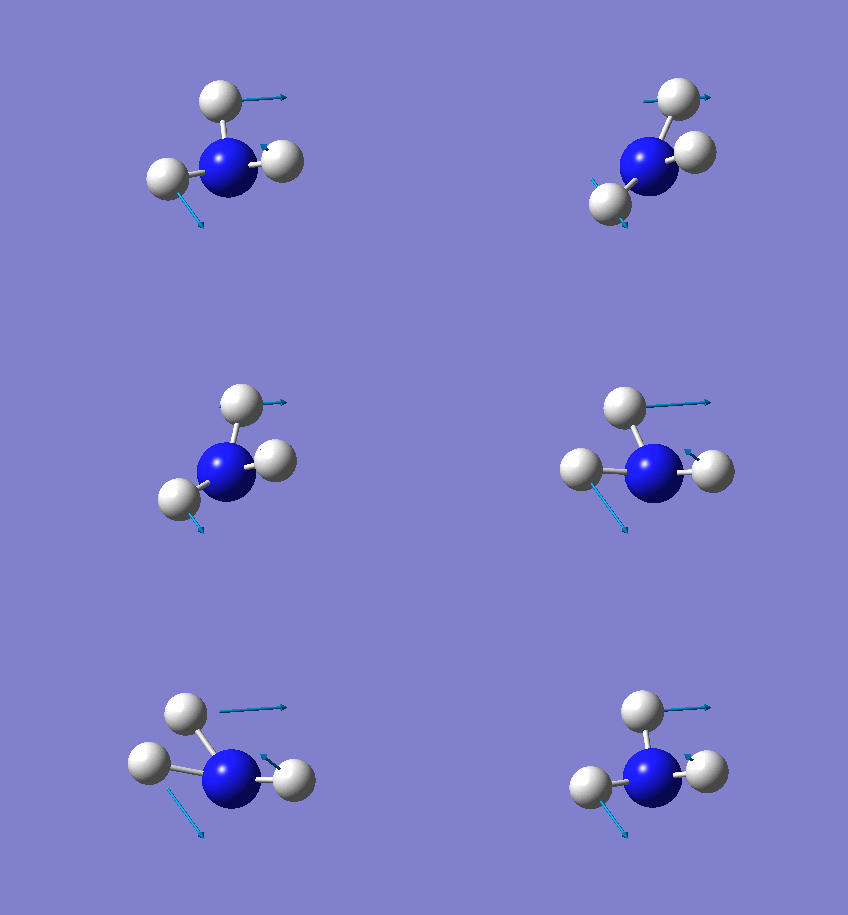
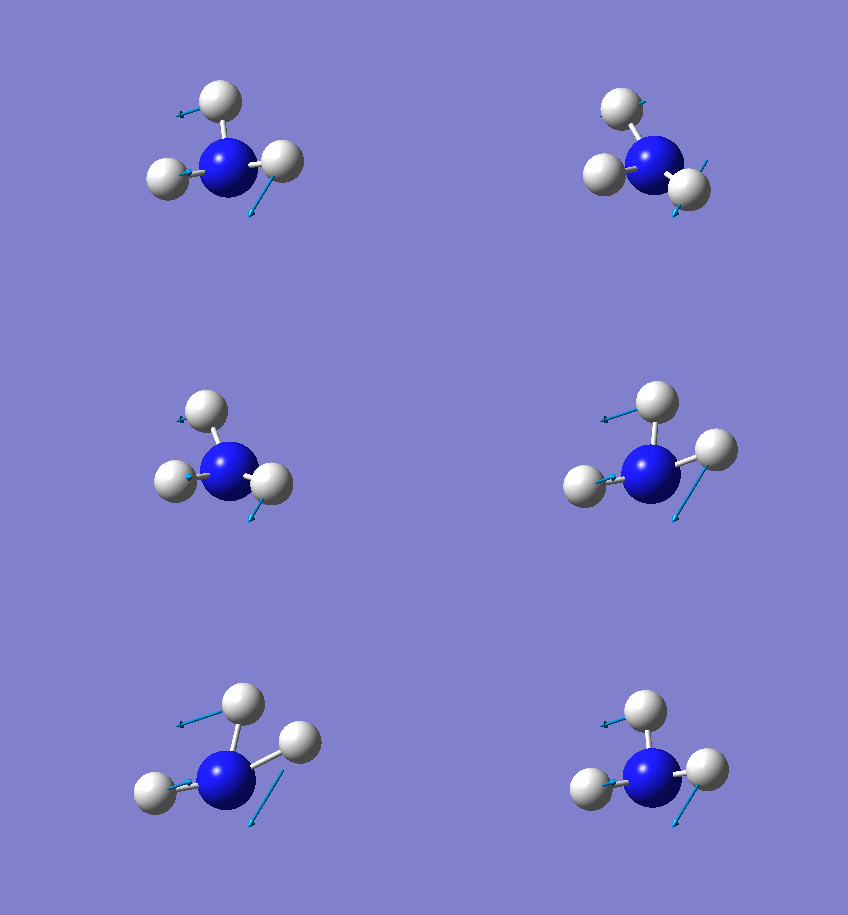
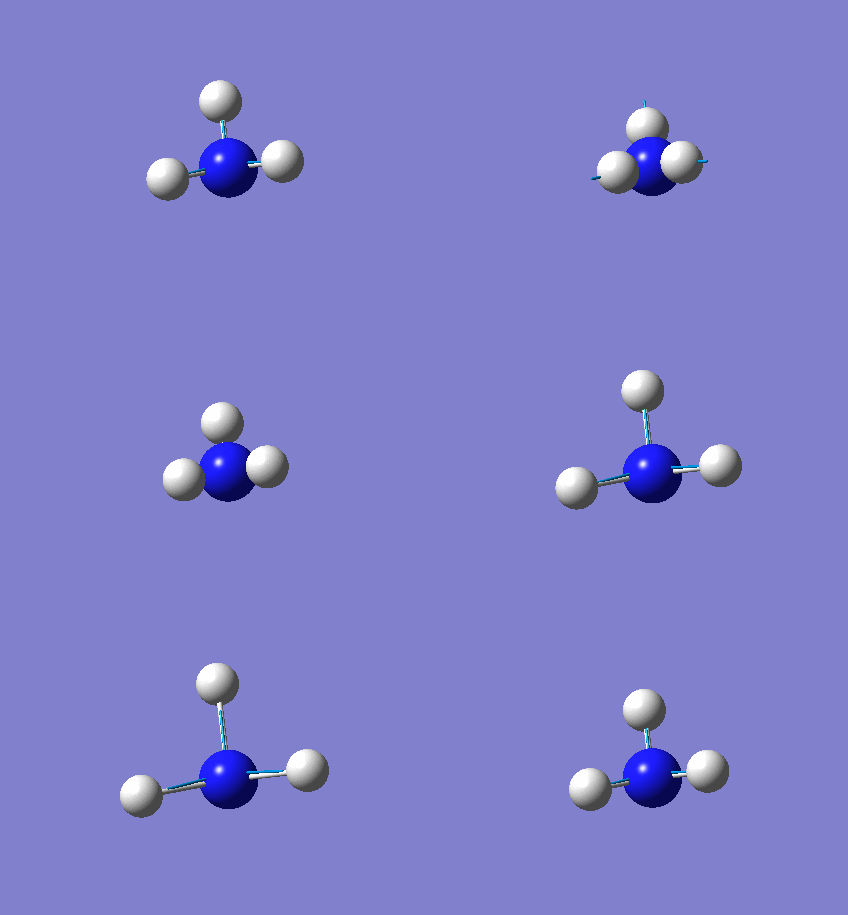
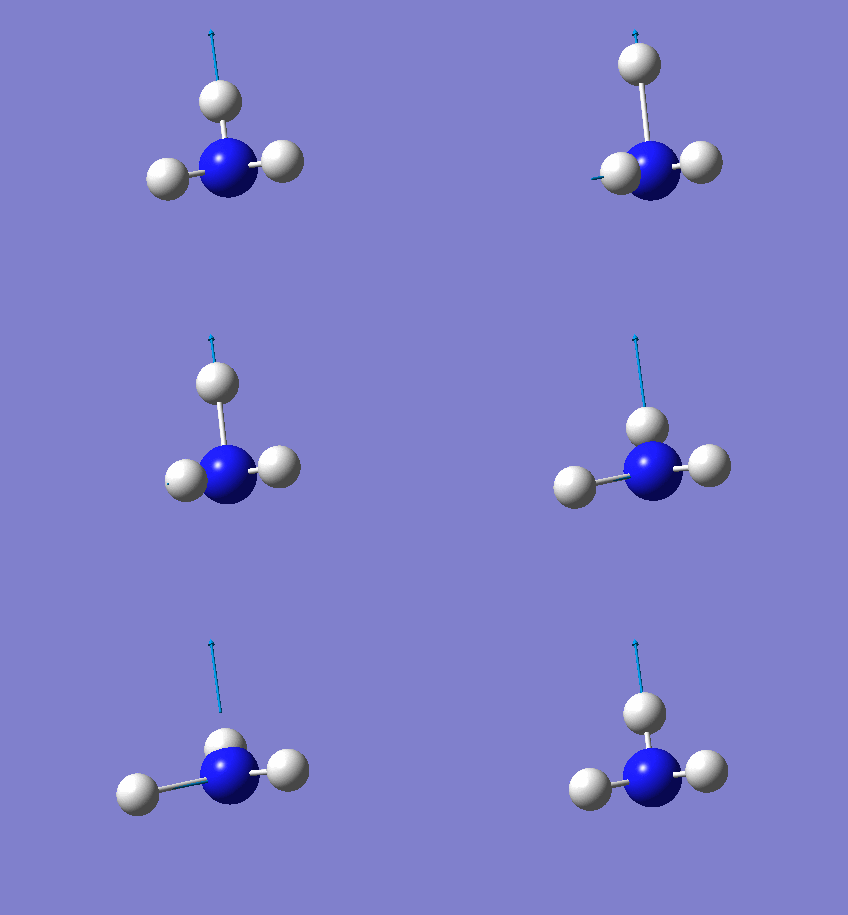
The following table summarises the NH3 IR stretching frequencies, the form of each vibration and the intensity.
| Form of Vibration | Frequency (cm-1)| | Intensity (cm-1) | Point Group |
 |
1089 | 145 | A1 |
 |
1693 | 13 | E' |
 |
1693 | 13 | E' |
 |
3461 | 1 | A1 |
 |
3589 | 0 | E' |
 |
3589 | 0 | E' |
Here is the predicted IR spectrum of NH3
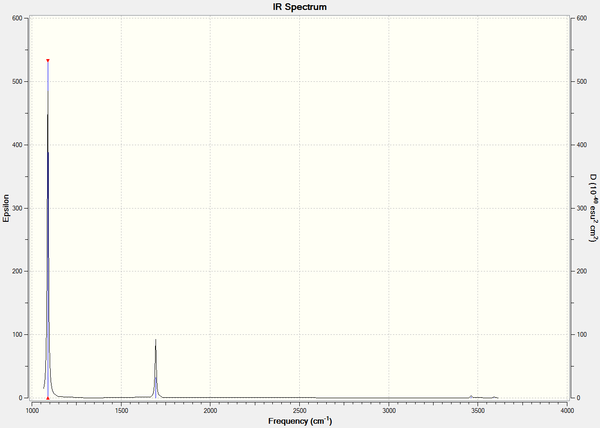
Unlike the BH3 and TlBr3 molecules..............
NH3 Molecular Orbital Analysis
A molecular orbital analysis was performed on the previously 6-31G optimised NH3 molecule, again using the B3LYP method with the 6-31G basis set. The keyword pop=full was used and "Full NBO" was selected in the NBO tab.
Here is the link to the deposited NH3 MO analysis file in the "D-Space" DOI:10042/23762
Here is the summary of the NH3 MO analysis.

The following table summarises the energies of the first 8 molecular orbitals for NH3.
| MO Number | MO Shape | Energy (a.u.)
|
| 1 | 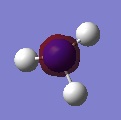 |
0.16923 |
| 2 | 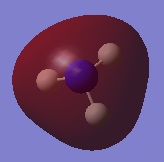 |
0.16923 |
| 3 | 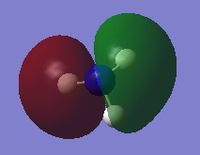 |
0.07985 |
| 4 | 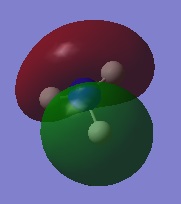 |
-0.25318 |
| 5 | 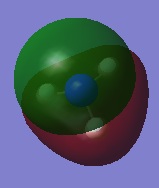 |
-0.45030 |
| 6 |  |
-0.45030 |
| 7 | 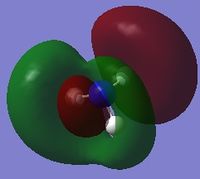 |
-0.84466 |
| 8 | 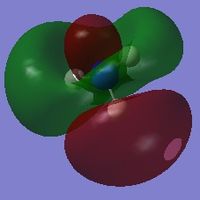 |
-12.30568 |
It was found that if the MO analysis was run without the nosymm keyword Gaussian returned molecular orbitals very similar to the BH3. By restricting the symmetry the molecular orbitals were forced into a shape that did not correspond to a true energetic minimum, so it is used in all calculations.
NH3 NBO analysis
Here is the link to the deposited NH3 NBO analysis file in the "D-Space" DOI:10042/23762
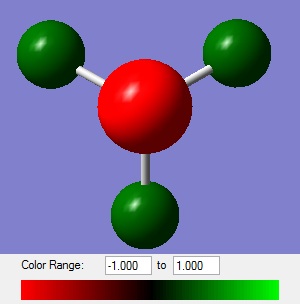
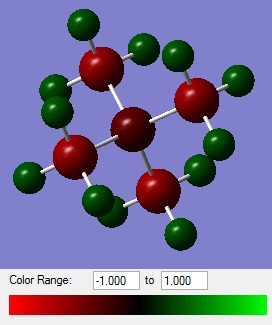
In the diagram of the charge distribution within NH3 a bright red colour corresponds to a negative charge and a bright green colour corresponds to a positive charge, with the scale shown at the bottom of the diagram. This colour scheme and scale are used in all charge distribution diagrams in the future. The numerical values for the charges are N = -1.125 and H = +0.375.
By looking at the .log file of the NBO analysis we can infer even more information about the bonding of the NH3 molecule. The "Summary of Natural Population Analysis" show the charges written above, and it can be seen the total charge sums to 0 for the neutral NH3. The core value of ~2 is due to the 2 core electrons on the nitrogen, the valence value of ~8 is due to the 8 bonding electrons and the total value of 10 corresponds to a total of 10 electrons in the molecule, 1 from each hydrogen and 7 from the nitrogen.
 Summary of Natural Population Analysis:

                                       Natural Population
                Natural  -----------------------------------------------
    Atom  No    Charge         Core      Valence    Rydberg      Total
 -----------------------------------------------------------------------
      N    1   -1.12514      1.99982     6.11103    0.01429     8.12514
      H    2    0.37505      0.00000     0.62250    0.00246     0.62495
      H    3    0.37505      0.00000     0.62250    0.00246     0.62495
      H    4    0.37505      0.00000     0.62250    0.00246     0.62495
 =======================================================================
   * Total *    0.00000      1.99982     7.97852    0.02166    10.00000
The "(Occupancy) Bond orbital/Coefficients/Hybrids" table separates each bonding interaction into a combination of the bonded atom's atomic orbitals, showing how they are hybridised (e.g. nitrogen is composed of ~25% s-orbital, 75% p-orbital and a very small contribution from it's d-orbitals) and also how much they contribute to the bond (e.g. nitrogen contributes 69% and hydrogen 31%). The core electrons (100% s-orbital) and lone pair (similar to the bonding electrons, with a slightly larger s-orbital contribution) can also be seen.
       (Occupancy)   Bond orbital/ Coefficients/ Hybrids
 ---------------------------------------------------------------------------------
     1. (1.99909) BD ( 1) N   1 - H   2
                ( 68.83%)   0.8297* N   1 s( 24.86%)p 3.02( 75.05%)d 0.00(  0.09%)
                                           -0.0001 -0.4986 -0.0059  0.0000 -0.2910
                                            0.0052  0.8155  0.0277  0.0000  0.0000
                                            0.0281  0.0000  0.0000  0.0032  0.0082
                ( 31.17%)   0.5583* H   2 s( 99.91%)p 0.00(  0.09%)
                                           -0.9996  0.0000  0.0072 -0.0289  0.0000
     2. (1.99909) BD ( 1) N   1 - H   3
                ( 68.83%)   0.8297* N   1 s( 24.86%)p 3.02( 75.05%)d 0.00(  0.09%)
                                            0.0001  0.4986  0.0059  0.0000  0.2910
                                           -0.0052  0.4077  0.0138  0.7062  0.0240
                                            0.0140  0.0243  0.0076  0.0033  0.0031
                ( 31.17%)   0.5583* H   3 s( 99.91%)p 0.00(  0.09%)
                                            0.9996  0.0000 -0.0072 -0.0145 -0.0250
     3. (1.99909) BD ( 1) N   1 - H   4
                ( 68.83%)   0.8297* N   1 s( 24.86%)p 3.02( 75.05%)d 0.00(  0.09%)
                                            0.0001  0.4986  0.0059  0.0000  0.2909
                                           -0.0052  0.4077  0.0138 -0.7062 -0.0240
                                            0.0140 -0.0243 -0.0076  0.0033  0.0031
                ( 31.17%)   0.5583* H   4 s( 99.91%)p 0.00(  0.09%)
                                            0.9996  0.0000 -0.0072 -0.0145  0.0250
     4. (1.99982) CR ( 1) N   1           s(100.00%)
                                            1.0000 -0.0002  0.0000  0.0000  0.0000
                                            0.0000  0.0000  0.0000  0.0000  0.0000
                                            0.0000  0.0000  0.0000  0.0000  0.0000
     5. (1.99721) LP ( 1) N   1           s( 25.38%)p 2.94( 74.52%)d 0.00(  0.10%)
                                            0.0001  0.5036 -0.0120  0.0000 -0.8618
                                            0.0505  0.0000  0.0000  0.0000  0.0000
                                            0.0000  0.0000  0.0000 -0.0269  0.0155
Any values for E(2) greater than 20 kcal/mol are significant, otherwise the "Second Order Perturbation Theory Analysis of Fock Matrix in NBO Basis" table is not of interest.
 Second Order Perturbation Theory Analysis of Fock Matrix in NBO Basis

     Threshold for printing:   0.50 kcal/mol
                                                                              E(2)  E(j)-E(i) F(i,j)
         Donor NBO (i)                     Acceptor NBO (j)                 kcal/mol   a.u.    a.u.
 ===================================================================================================

 within unit  1
   5. LP (   1) N   1                / 16. RY*(   1) H   2                    1.01    1.43    0.034
   5. LP (   1) N   1                / 17. RY*(   2) H   2                    0.67    2.17    0.034
   5. LP (   1) N   1                / 20. RY*(   1) H   3                    1.01    1.43    0.034
   5. LP (   1) N   1                / 21. RY*(   2) H   3                    0.67    2.17    0.034
   5. LP (   1) N   1                / 24. RY*(   1) H   4                    1.01    1.43    0.034
   5. LP (   1) N   1                / 25. RY*(   2) H   4                    0.67    2.17    0.034
The final section is the "Natural Bond Orbitals (Summary)" table, which shows the energy and occupation of the bonding, core and lone pair orbitals.
 Natural Bond Orbitals (Summary):

                                                            Principal Delocalizations
           NBO                        Occupancy    Energy   (geminal,vicinal,remote)
 ====================================================================================
 Molecular unit  1  (H3N)
     1. BD (   1) N   1 - H   2          1.99909    -0.60417
     2. BD (   1) N   1 - H   3          1.99909    -0.60417
     3. BD (   1) N   1 - H   4          1.99909    -0.60417
     4. CR (   1) N   1                  1.99982   -14.16768
     5. LP (   1) N   1                  1.99721    -0.31757
Association Energy
NH3BH3 Optimisation
A molecule of NH3BH3 was created in GaussView and optimised using the B3LYP method with the 6-31G basis set.
The optimised bond lengths are N-H = 1.02A, B-N = 1.67A and B-H = 1.21A and the bond angles are H-N-H = 107.9o, H-N-B = 111.0o, N-B-H = 104.6o and H-B-H = 113.9o.
Here is the link to the deposited NH3BH3 optimisation file in the "D-Space" DOI:10042/23761
Here is the summary of the NH3BH3 optimisation.
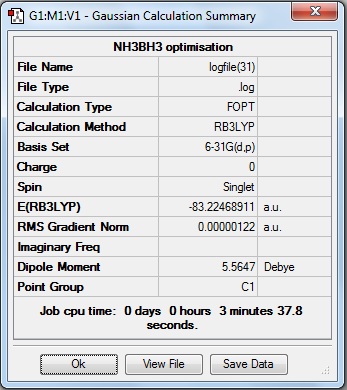
The RMS Gradient Norm value is less than 0.001, and the item table (below) shows the forces and displacements have converged, therefore the the optimisation was successful.
         Item               Value     Threshold  Converged?
 Maximum Force            0.000002     0.000015     YES
 RMS     Force            0.000001     0.000010     YES
 Maximum Displacement     0.000024     0.000060     YES
 RMS     Displacement     0.000010     0.000040     YES
 Predicted change in Energy=-8.746367D-11
 Optimization completed.
    -- Stationary point found.
NH3BH3 Frequency Analysis
A frequency analysis was performed on the previously 6-31G optimised NH3BH3 molecule, again using the B3LYP method with the 6-31G basis set.
Here is the link to the deposited NH3BH3 frequency analysis file in the "D-Space" DOI:10042/23767
Here is the summary of the NH3BH3 frequency analysis.
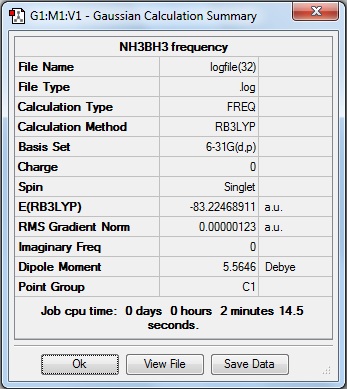
The following "Low Frequencies" are within +/- 15cm-1, and all the frequencies are positive showing the frequency analysis was successful and a minimum was found in the optimisation.
 Low frequencies ---   -3.2355   -2.7371   -0.0012   -0.0002    0.0003    3.7281
 Low frequencies ---  263.3403  632.9605  638.4399
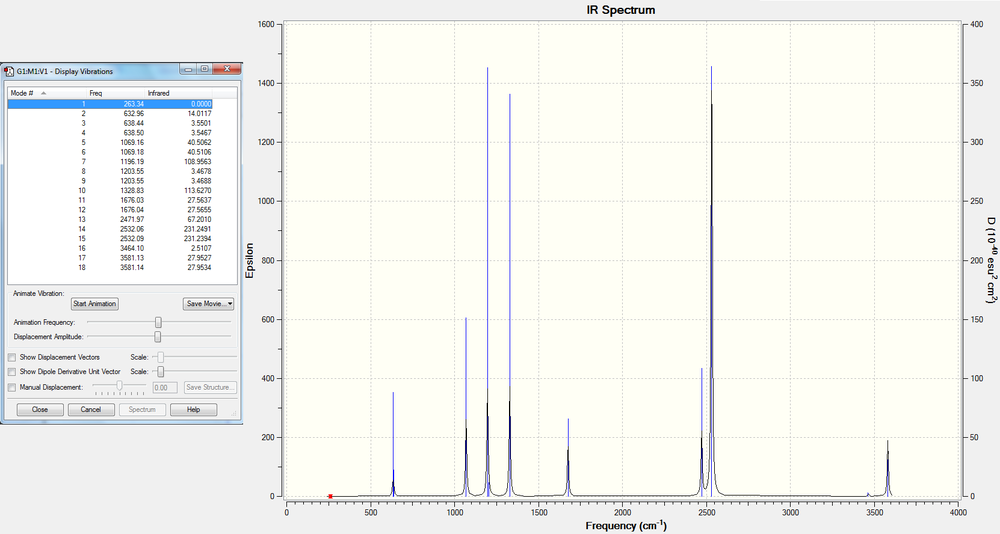
Here is the IR spectrum of NH3BH3 with the stretching modes
NH3BH3 Association Energy
By looking at the energy of the separate molecules and the energy of the adduct we can approximate the association energy when the nitrogen lone pair is donated to the boron empty p-orbital. Note, the energies of each component must all be calculated by the same method and basis set, in this case B3LYP and 6-31G. The following table summarises the energies of each molecule.#
| Molecule | Energy (a.u.) |
| BH3 | -26.61532363 |
| NH3 | -56.55776872 |
| NH3BH3 | -83.22468911 |
The energy change that occurs when going from BH3 + NH3 --> NH3BH3 is as follows
Energy change = E(NH3BH3) - [E(BH3) + E(NH3)]
          = -83.22468911 - [-26.61532363 - 56.55776872]
          = -0.05159676 a.u.
          = -135.46729338 kJmol-1
Therefore 135.47 kJmol-1 is the association energy for combining BH3 with NH3.
Week 2
Optimisation and Frequency Analysis of [N(CH3)4]+, [P(CH3)4]+ and [S(CH3)3]+
Each analysis was done using the B3LYP method with the 6-31G basis set. The "nosymm" keyword was used, as well as "integral=grid=ultrafine", the "use tight convergence" option ticked and a charge of +1 applied to all molecules.
Here is the link to the deposited [N(CH3)4]+ optimisation file in the "D-Space" DOI:10042/23604
The RMS Gradient Norm value is 0.00006355 a.u., which is less than 0.001, and the item table (below) shows the forces and displacements have converged, therefore the optimisation was successful. The minimum energy is -214.18127297 a.u.
         Item               Value     Threshold  Converged?
 Maximum Force            0.000102     0.000450     YES
 RMS     Force            0.000034     0.000300     YES
 Maximum Displacement     0.000781     0.001800     YES
 RMS     Displacement     0.000234     0.001200     YES
 Predicted change in Energy=-2.764735D-07
 Optimization completed.
    -- Stationary point found.
Here is the link to the deposited [N(CH3)4]+ frequency analysis file in the "D-Space" DOI:10042/23606
The following "Low Frequencies" are within +/- 15cm-1, and all the frequencies are positive showing the frequency analysis was successful and a minimum was found in the optimisation.
 Low frequencies ---   -2.9511   -0.0008    0.0005    0.0007    4.5965    5.2475
 Low frequencies ---  183.3662  287.8776  288.3728
Here is the link to the deposited [P(CH3)4]+ optimisation file in the "D-Space" DOI:10042/23617
The RMS Gradient Norm value is 0.00002212 a.u., which is less than 0.001, and the item table (below) shows the forces and displacements have converged, therefore the optimisation was successful. The minimum energy is -500.82701152 a.u.
         Item               Value     Threshold  Converged?
 Maximum Force            0.000132     0.000450     YES
 RMS     Force            0.000033     0.000300     YES
 Maximum Displacement     0.000677     0.001800     YES
 RMS     Displacement     0.000280     0.001200     YES
 Predicted change in Energy=-1.627475D-07
 Optimization completed.
    -- Stationary point found.
Here is the link to the deposited [P(CH3)4]+ frequency analysis file in the "D-Space" DOI:10042/23619
The following "Low Frequencies" are within +/- 15cm-1, and all the frequencies are positive showing the frequency analysis was successful and a minimum was found in the optimisation.
Low frequencies ---   -0.0017    0.0027    0.0032    8.7130   10.4455   11.8597
Low frequencies ---  157.4071  192.7390  192.9739
Here is the link to the deposited [S(CH3)3]+ optimisation file in the "D-Space" DOI:10042/23613
The RMS Gradient Norm value is 0.00000783 a.u., which is less than 0.001, and the item table (below) shows the forces and displacements have converged, therefore the optimisation was successful. The minimum energy is -517.68327430 a.u.
         Item               Value     Threshold  Converged?
 Maximum Force            0.000018     0.000450     YES
 RMS     Force            0.000004     0.000300     YES
 Maximum Displacement     0.000449     0.001800     YES
 RMS     Displacement     0.000122     0.001200     YES
 Predicted change in Energy=-2.672019D-09
 Optimization completed.
    -- Stationary point found.
Here is the link to the deposited [S(CH3)3]+ frequency analysis file in the "D-Space" DOI:10042/23615
The following "Low Frequencies" are within +/- 15cm-1, and all the frequencies are positive showing the frequency analysis was successful and a minimum was found in the optimisation.
 Low frequencies ---   -9.4691   -0.0033   -0.0025   -0.0024    4.1266    8.6887
 Low frequencies ---  162.2936  200.2157  200.5116
Geometry of the Ions
The following table summarises the bond lengths and angles between the carbon and heteratoms of each structure. As the nosymm option is used, the values do vary slightly within each molecule (only at the fifth significant figure however) so average values for bond lengths and angles are shown from now.
| [N(CH3)4]+ | [P(CH3)4]+ | [S(CH3)3]+ | |
|---|---|---|---|
| Bond Length (A) | 1.51 | 1.82 | 1.82 |
| Literature | 1.487[6] | 1.781[7] | 1.794[8] |
| Bond Angle (o) | 109.5 | 109.5 | 102.7 |
| Literature | 107.45[9] | 108.38[10] | 101.67[11] |
All values are close to literature values, and in this case they were found as the ion and not part of a similar structure.
[N(CH3)4]+ and [P(CH3)4]+ both form tetrahedral structures, which is expected due to the symmetrical nature of the molecules. In addition the N-C bonds are shorter than the P-C bonds due to the less efficient overlap with the larger P orbitals. [S(CH3)3]+ is a trigonal pyramidal structure, where the bond angle is smaller than in the other two molecules as the bonding electrons are pushed closer together due to the extra repulsion from the lone pair on the sulfur. The S-C bonds are of a similar length to the P-C bonds as they are both in the the same period.
Molecular Orbital Analysis
The molecular orbital analyses were performed on the previously 6-31G optimised ions, again using the B3LYP method with the 6-31G basis set. The keyword pop=full was used and "Full NBO" was selected in the NBO tab.
Here is the link to the deposited [N(CH3)4]+ MO analysis file in the "D-Space" DOI:10042/23624
The first 5 molecular orbitals are core orbitals, so are ignored in the analysis, and the 6th is the all bonding orbital.
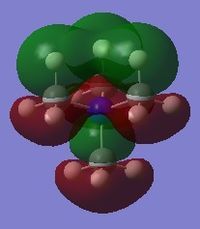
The following table summarises the energies of 5 of the molecular orbitals for N(CH3)4 (these are 6, 10, 21(HOMO), 22(LUMO) and 43), and also the bonding and anti-bonding interactions within each orbital.
NBO Analysis
Here is the link to the deposited [N(CH3)4]+ NBO analysis file in the "D-Space" DOI:10042/23624
Here is the link to the deposited [P(CH3)4]+ NBO analysis file in the "D-Space" DOI:10042/23647
Here is the link to the deposited [S(CH3)3]+ NBO analysis file in the "D-Space" DOI:10042/23646
 |
 |
 |
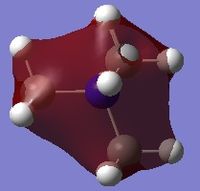
Comparing the Charge Distributions
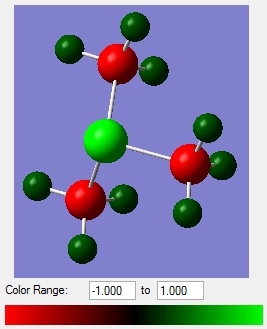
The following table compares the charge distribution of the different cations (note that for [S(CH3)3]+, the carbon is an average of -0.845, -0.846 and -0.846 and the hydrogen is an average of 0.297, 0.297 and 0.279 ).
| Charge | |||
|---|---|---|---|
| Heteroatom | Carbon | Hydrogen | |
| [N(CH3)4]+ | -0.295 | -0.483 | +0.269 |
| [P(CH3)4]+ | +1.667 | -1.060 | +0.298 |
| [S(CH3)3]+ | +0.917 | -0.846 | +0.291 |
These values reflect the electronegativities of the atoms, H = 2.20, C = 2.55, N = 3.04, P = 2.19 and S = 2.58.[12] N > S > P is reflected by nitrogen having the most negative charge and phosphorus having the most positive charge as the central atom. Additionally carbon is the least negative in the ammonium ion and most negative in the phosphonium ion.
We can also use the NBO .log file to get information on the contribution of the carbon and the heteroatom to the C-X bond in the "Bond orbital/ Coefficients/ Hybrids" table.
     4. (1.98454) BD ( 1) C   1 - N  17
                ( 33.65%)   0.5801* C   1 s( 20.77%)p 3.81( 79.06%)d 0.01(  0.16%)
                                           -0.0003 -0.4551  0.0237 -0.0026 -0.8882
                                           -0.0377 -0.0091 -0.0004  0.0156  0.0007
                                           -0.0007  0.0012  0.0000 -0.0351  0.0203
                ( 66.35%)   0.8145* N  17 s( 25.00%)p 3.00( 74.96%)d 0.00(  0.03%)
                                            0.0000 -0.5000  0.0007  0.0000  0.8656
                                           -0.0001  0.0088  0.0000 -0.0151  0.0000
                                           -0.0003  0.0005  0.0000 -0.0154  0.0089
     4. (1.98030) BD ( 1) C   1 - P  17
                ( 59.57%)   0.7718* C   1 s( 25.24%)p 2.96( 74.68%)d 0.00(  0.08%)
                                            0.0002  0.5021  0.0171 -0.0020 -0.2879
                                            0.0053 -0.4074  0.0075 -0.7055  0.0130
                                            0.0079  0.0137  0.0194 -0.0028  0.0145
                ( 40.43%)   0.6359* P  17 s( 25.00%)p 2.97( 74.15%)d 0.03(  0.85%)
                                            0.0000  0.0001  0.5000 -0.0008  0.0000
                                            0.0000  0.2870 -0.0004  0.0000  0.4059
                                           -0.0006  0.0000  0.7031 -0.0010  0.0251
                                            0.0435  0.0615 -0.0089  0.0462
     4. (1.98631) BD ( 1) C   1 - S  13
                ( 48.67%)   0.6976* C   1 s( 19.70%)p 4.07( 80.16%)d 0.01(  0.14%)
                                            0.0003  0.4436  0.0140 -0.0033  0.4845
                                           -0.0023  0.7406 -0.0028  0.1350  0.0111
                                            0.0285  0.0053  0.0081 -0.0125 -0.0176
                ( 51.33%)   0.7165* S  13 s( 16.95%)p 4.86( 82.42%)d 0.04(  0.63%)
                                            0.0000  0.0001  0.4116 -0.0075  0.0012
                                            0.0000 -0.4860  0.0161  0.0000 -0.7452
                                            0.0224  0.0000 -0.1755 -0.0344  0.0577
                                            0.0209  0.0324 -0.0259 -0.0289
This shows us that nitrogen contributes 66% to the C-N bond, and carbon 34%. Within this bond the carbon is 21% s-orbital, 79% p-orbital and the nitrogen is 25% s-orbital, 75% p-orbital. Phosphorus contributes 60% to the C-P bond, and carbon 40%. Within this bond the carbon is 25% s-orbital, 75% p-orbital and the phosphorus is 25% s-orbital, 74% p-orbital. Sulfur contributes 51% to the C-S bond, and carbon 49%. Within this bone the carbon is 20% s-orbital, 80% p-orbital and the sulfur is 17% s-orbital and 82% p-orbital. Where the total does not add up to 100% for the orbital contributions, this is due to d-orbital participation.
This again reflects the electronegativities, and corresponds to the charge distribution, as in the 3 C-X bonds, nitrogen holds the most electron density and phosphorus the least.
Despite [NR4]+ often having the positive formal charge depicted on the nitrogen, the analysis has shown that it is in fact spread around the more electropositive hydrogen atoms on the alkyl group, and that the carbon atoms are in fact more negatively charged. The formal charge is assigned regardless of electronegativity, and is more of a tool for electron counting than a representation of the molecule.
By changing the central atom of the cation, the distribution of the charge within the core of the molecule is changed. Having a more electronegative element at the center means the carbon atoms are less negative, which leads to the carbon hydrogen bond being less polar too, and the surface of the molecule being less positively charged overall, which helps to delocalise the charge and make a weaker coordinating cation.
Optimisation and Frequency Analysis of [N(CH3)3(CH2OH)]+ and [N(CH3)3(CH2CN)]+
Each analysis was done using the B3LYP method with the 6-31G basis set. The "nosymm" keyword was used, as well as "integral=grid=ultrafine", the "use tight convergence" option ticked and a charge of +1 applied to all molecules.
Here is the link to the deposited [N(CH3)3(CH2OH)]+ optimisation file in the "D-Space" DOI:10042/23674
The RMS Gradient Norm value is 0.00000056 a.u., which is less than 0.001, and the item table (below) shows the forces and displacements have converged, therefore the optimisation was successful. The minimum energy is -289.39470827 a.u.
         Item               Value     Threshold  Converged?
 Maximum Force            0.000001     0.000015     YES
 RMS     Force            0.000000     0.000010     YES
 Maximum Displacement     0.000016     0.000060     YES
 RMS     Displacement     0.000004     0.000040     YES
 Predicted change in Energy=-1.403542D-11
 Optimization completed.
    -- Stationary point found.
Here is the link to the deposited [N(CH3)3(CH2OH)]+ frequency analysis file in the "D-Space" DOI:10042/23679
The following "Low Frequencies" are within +/- 15cm-1, and all the frequencies are positive showing the frequency analysis was successful and a minimum was found in the optimisation.
 Low frequencies ---   -4.7980   -1.6168   -0.0007    0.0005    0.0008    6.7148
 Low frequencies ---  130.8516  213.9575  255.8443
On the first frequency analysis of [N(CH3)3(CH2OH)]+ the structure automatically had the dihedral angle of the N-C-O-H moiety at 180o, which is at a transition state. Therefore one of the frequencies came back negative due to a rotation around the O-H bond as the calculation could not optimise it to one side or the other due to the symmetry of the molecule. By altering the dihedral angle slightly this was overcome however.
Here is the link to the deposited [N(CH3)3(CH2CN)]+ optimisation file in the "D-Space" DOI:10042/23701
The RMS Gradient Norm value is 0.00000033 a.u., which is less than 0.001, and the item table (below) shows the forces and displacements have converged, therefore the optimisation was successful. The minimum energy is -306.39376198 a.u.
         Item               Value     Threshold  Converged?
 Maximum Force            0.000001     0.000015     YES
 RMS     Force            0.000000     0.000010     YES
 Maximum Displacement     0.000047     0.000060     YES
 RMS     Displacement     0.000009     0.000040     YES
 Predicted change in Energy=-1.368242D-11
 Optimization completed.
    -- Stationary point found.
Here is the link to the deposited [N(CH3)3(CH2CN)]+ frequency analysis file in the "D-Space" DOI:10042/23702
The following "Low Frequencies" are within +/- 15cm-1, and all the frequencies are positive showing the frequency analysis was successful and a minimum was found in the optimisation.
 Low frequencies ---   -4.9137   -1.9210   -0.0009   -0.0006    0.0006    5.0796
 Low frequencies ---   91.6447  153.9756  211.4527
Influence of Functional Groups on Charge Distribution
Here is the link to the deposited [N(CH3)3(CH2OH)]+ NBO analysis file in the "D-Space" DOI:10042/23706
Here is the link to the deposited [N(CH3)3(CH2CN)]+ NBO analysis file in the "D-Space" DOI:10042/23735
 |
 |
 |
| [N(CH3)4]+ | [N(CH3)3(CH2OH)]+ | [N(CH3)3(CH2CN)]+ |
|---|---|---|
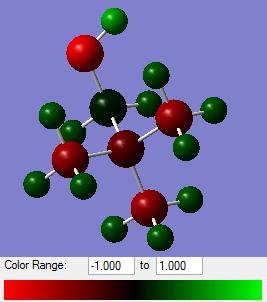
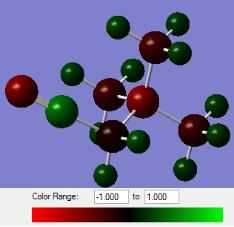
| N = -0.295 | N (central) = -0.322 | N (central) = -0.289 |
| C = 0.088 | C = -0.358 | |
| C = -0.483 | O (OH) = -0.725 | C (CN) = 0.209 |
| H (OH) = 0.521 | N (CN) = -0.186 | |
| H = 0.269 | C (methyl) = -0.492 | C (methyl) = -0.488 |
| H (methyl) = 0.270 | H (methyl) = 0.274 |
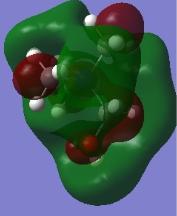
It can be seen from the charge distribution diagrams that the new distributions are very similar to the original [N(CH3)4]+, for both electron donating and electron withdrawing substituents, apart from the negative nitrogen and oxygen sticking out. It can be seen that with the addition of an electron withdrawing group the electron density on the nitrogen has decreased slightly, and with an electron donating group the electron density has increased, however the overall effect on the molecule is minimal, with the methyl hydrogen and carbon, which make up the bulk of the molecule, having very similar values to [N(CH3)4]+. The electron withdrawing CN has made the surface methyl hydrogens more positive in [N(CH3)3(CH2CN)]+ which would actually lead to a more coordinating ion.
Looking at the "Natural Bond Orbital (Summary)" table it can be seen that in each of its bonds, oxygen has the majority of the electron density, contributing 66% to the CO bond, and 76% to the OH bond, which reflects its large electronegativity. It is due to this large electronegativity, it has much the same effect as the electron withdrawing nitrile group. For example the methyl hydrogen on [N(CH3)3(CH2OH)]+ are more positive than [N(CH3)4]+ too.
    15. (1.99697) BD ( 1) C  13 - O  16
                ( 33.90%)   0.5822* C  13 s( 23.71%)p 3.21( 76.04%)d 0.01(  0.24%)
                                            0.0000  0.4843 -0.0506  0.0000 -0.2739
                                           -0.0286  0.8261  0.0438 -0.0037 -0.0131
                                           -0.0238 -0.0015  0.0014 -0.0348 -0.0255
                ( 66.10%)   0.8130* O  16 s( 32.28%)p 2.10( 67.64%)d 0.00(  0.08%)
                                            0.0000  0.5681 -0.0061 -0.0029  0.3136
                                           -0.0029 -0.7603 -0.0083 -0.0007 -0.0001
                                           -0.0227 -0.0036 -0.0002 -0.0053 -0.0154
        17. (1.98889) BD ( 1) O  16 - H  17
                ( 76.26%)   0.8733* O  16 s( 22.10%)p 3.52( 77.83%)d 0.00(  0.07%)
                                           -0.0002  0.4698 -0.0156  0.0014  0.5909
                                           -0.0042  0.5946  0.0335 -0.2727 -0.0039
                                            0.0124 -0.0131 -0.0031  0.0168 -0.0111
                ( 23.74%)   0.4872* H  17 s( 99.77%)p 0.00(  0.23%)
                                            0.9989 -0.0032 -0.0288 -0.0342  0.0169
It is also interesting to note the form of each of the bonds, with the first being comprised of about half and half s and p-orbitals, and the second 2 being almost pure p-orbital, which corresponds well to hybridisation theory.
    17. (1.99595) BD ( 1) C  17 - N  18
                ( 42.68%)   0.6533* C  17 s( 47.95%)p 1.09( 52.03%)d 0.00(  0.02%)
                                           -0.0002  0.6910 -0.0450 -0.0044 -0.2418
                                           -0.0192  0.6765  0.0618  0.0040 -0.0043
                                           -0.0088 -0.0006  0.0002 -0.0105 -0.0076
                ( 57.32%)   0.7571* N  18 s( 45.15%)p 1.21( 54.49%)d 0.01(  0.36%)
                                            0.0000  0.6707 -0.0407  0.0003  0.2304
                                            0.0030 -0.7007 -0.0076  0.0286 -0.0005
                                           -0.0312  0.0008 -0.0034 -0.0417 -0.0298
    18. (1.98640) BD ( 2) C  17 - N  18
                ( 47.13%)   0.6865* C  17 s(  0.00%)p 1.00( 99.95%)d 0.00(  0.05%)
                                            0.0000  0.0000  0.0000  0.0000  0.8161
                                           -0.0130  0.2888 -0.0046  0.4997 -0.0079
                                            0.0150 -0.0027  0.0114 -0.0135  0.0019
                ( 52.87%)   0.7271* N  18 s(  0.00%)p 1.00( 99.59%)d 0.00(  0.41%)
                                            0.0000  0.0000  0.0000  0.0000  0.8147
                                            0.0117  0.2883  0.0041  0.4989  0.0072
                                           -0.0437  0.0120 -0.0295  0.0337  0.0022
    19. (1.96827) BD ( 3) C  17 - N  18
                ( 49.36%)   0.7026* C  17 s(  0.09%)p99.99( 99.87%)d 0.45(  0.04%)
                                            0.0001 -0.0255  0.0157  0.0026 -0.4772
                                            0.0114 -0.1485  0.0015  0.8651 -0.0195
                                           -0.0079 -0.0070  0.0161  0.0063  0.0007
                ( 50.64%)   0.7116* N  18 s(  0.03%)p99.99( 99.57%)d15.40(  0.40%)
                                            0.0000 -0.0160  0.0026 -0.0004 -0.4800
                                           -0.0078 -0.1380 -0.0010  0.8637  0.0133
                                            0.0264  0.0161 -0.0526 -0.0178  0.0032
Influence of Functional Groups on Molecular Orbitals
Here is the link to the deposited [N(CH3)3(CH2OH)]+ MO analysis file in the "D-Space" DOI:10042/23706
Here is the link to the deposited [N(CH3)3(CH2CN)]+ MO analysis file in the "D-Space" DOI:10042/23735
Interactions between molecules generally occur at the HOMO-LUMO energy level. Analysis of the HOMO-LUMO energy gap will tell us how the substituents will effect these interactions.
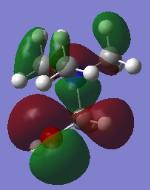
The HOMO-LUMO energy gap for each of the molecules are: [N(CH3)4]+ = 0.44619 a.u., [N(CH3)3(CH2OH)]+ = 0.36304 a.u. and [N(CH3)3(CH2CN)]+ = 0.31865. It can be seen again here that both the substituents have the same effect, lowering the HOMO-LUMO gap. The shapes of the LUMOs of both [N(CH3)3(CH2OH)]+ and [N(CH3)3(CH2CN)]+ show a higher proportion of the electron density over the electronegative oxygen and nitrogen, which is expected. The HOMOs show a similar bias, but to a lesser extent. Overall the HOMO and LUMO of the[N(CH3)4]+ shows a far more even spread of the electron density, which has not been spread any thinner by the addition of either an electron donating or electron withdrawing. The decrease in the HOMO-LUMO gap shows they will be more susceptible to interactions with anions, so would only be useful for making ionic liquids with stronger interactions, and the uneven spread of charge would allow more permanent interactions to form, however this would not be good for an ionic liquid.
Notes and References
- ↑ W.Leung, S.Cosway, R.H.V.Jones, H.McCann, M.Wills, J.Chem.Soc.,Perkin Trans.1 , 2588, 2001, DOI:10.1039/b105495n
- ↑ B.Schmidt-Brucken, U.Abram, Z.Anorg.Allg.Chem. , 627, 1714, 2001, DOI:<1714::AID-ZAAC1714>3.0.CO;2-W 10.1002/1521-3749(200108)627:8<1714::AID-ZAAC1714>3.0.CO;2-W
- ↑ S.E.Jeffs, R.W.H.Small, I.J.Worrall, Acta Crystallogr.,Sect.C:Cryst.Struct.Commun. 39, 1628, 1983
- ↑ Norbert Adolph; Forker, Gordon M. Lange, Lange's Handbook of Chemistry, McGraw - Hill Book Company; Tenth Edition edition (1967)
- ↑ Norbert Adolph; Forker, Gordon M. Lange, Lange's Handbook of Chemistry, McGraw - Hill Book Company; Tenth Edition edition (1967)
- ↑ M.Vojnovic, D.Jozic, G.Giester, B.Peric, P.Planinic, N.Brnicevic, Acta Crystallogr.,Sect.C:Cryst.Struct.Commun. 58, m219, 2002, DOI:10.1107/S0108270102001841
- ↑ G.Madariaga, M.M.Alberdi, F.J.Zuniga, Acta Crystallogr.,Sect.C:Cryst.Struct.Commun. 46, 2363, 1990 DOI:10.1107/S010827019000470X
- ↑ C.Schumacher, R.E.Schmidt, K.Dehnicke, Z.Anorg.Allg.Chem. 520, 25, 1985 DOI:10.1002/zaac.19855200104
- ↑ A.L. Allred, J. Inorg. Nucl. Chem., 17, 215, 1961

