Rep:Mod:jk1911251192
Computational Analysis of Transition State Geometries and Product Energies in order to Rationalise Observed Reaction Outcomes
Part 1:
Objectives
The objectives of this part were to use a DFT molecular modelling method to calculate the energies and spectral properties of several small molecules in order to rationalise their reactivity and stability. Computed NMR spectra were compared to literature values in order to determine how representative computer modelling is, and where it is likely to deviate from experimental results.
The program Avogadro was used to minimise the energies of all of the forthcoming molecules using a DFT method with a MMFF94s force field. The method used was conjugate gradients. Some molecules were then subjected to further quantum mechanical optimisation using Gaussian, with a B3LYP basis set.
Cyclopentadiene dimer Isomers
Cyclopentadiene can dimerise to form one of two isomers, endo or exo (shown below). The minimum energies for both isomers are shown in Table 1.
Cyclopentadiene Dimer - Endo
Pentahelicene |
Cyclopentadiene Dimer - Exo
|
Type of Energy (kcal/mol) |
Exo Isomer |
Endo Isomer |
|
Total |
55.37349
|
58.19068
|
|
Bond Stretching |
3.5431
|
3.46782
|
|
Angle Bending |
30.77225
|
33.18817
|
|
Stretch Bending |
-2.04143
|
-2.08127
|
|
Torsional |
-2.73033
|
-2.94995
|
|
Out of Plane Bending |
0.015
|
0.02181
|
|
Van Der Waal's |
12.80117
|
12.35908
|
|
Electrostatic |
13.01373
|
14.18504
|
Table 1: Distribution of energy in the two cyclopentadiene dimer isomers. Values in bold are the most significant contributions, showing the biggest differences.
The dimerization of cyclopentadiene proceeds via a π4s + π2s cycloaddition reaction. When proceeding under thermal activation, it is constrained by the Woodward Hoffman rules[1] to form both new bonds on the same face of each π system. This gives the endo and exo products as the two allowed outcomes. The exo isomer is thermodynamically more stable than the endo isomer, mostly due to the angle bending term, but an unfavourable, albeit fairly weak, electrostatic interaction destabilises the endo product further. This is most likely due to the two electron rich alkene groups being much closer together in this isomer, causing destabilising π-π repulsions. The fact that the less thermodynamically stable isomer is formed preferentially is a sign that this reaction is under kinetic, not thermodynamic control. The reason the endo isomer is kinetically favoured can be explained by considering the transition state of the reaction. The dimerization of cyclopentadiene has been found to proceed via an asynchronous pathway, in which one of the possible resonance structures is zwitterionic.[2] In the pathway leading up to the endo product the two charges are fairly close together, and therefore more stable than in the exo pathway where they are further apart. This makes the transition state energy lower for the endo pathway, so the endo product is formed faster.[2]
Hydrogenation products
Cyclopentadiene can be initially hydrogenated to give either product 3 or product 4 (shown below)
Hydrogenation Product 3
Hydrogenation Product 4
Hydrogenation product 3
- TOTAL ENERGY = 50.58250 kcal/mol
- TOTAL BOND STRETCHING ENERGY = 3.37870 kcal/mol
- TOTAL ANGLE BENDING ENERGY = 28.58603 kcal/mol
- TOTAL STRETCH BENDING ENERGY = -1.86006 kcal/mol
- TOTAL TORSIONAL ENERGY = 1.61836 kcal/mol
- TOTAL OUT-OF-PLANE BENDING ENERGY = 0.01575 kcal/mol
- TOTAL VAN DER WAALS ENERGY = 13.73118 kcal/mol
- TOTAL ELECTROSTATIC ENERGY = 5.11254 kcal/mol
Hydrogenation product 4
- TOTAL ENERGY = 41.25749 kcal/mol
- TOTAL BOND STRETCHING ENERGY = 2.82311 kcal/mol
- TOTAL ANGLE BENDING ENERGY = 24.68535 kcal/mol
- TOTAL STRETCH BENDING ENERGY = -1.65719 kcal/mol
- TOTAL TORSIONAL ENERGY = -0.37841 kcal/mol
- TOTAL OUT-OF-PLANE BENDING ENERGY = 0.00028 kcal/mol
- TOTAL VAN DER WAALS ENERGY = 10.63733 kcal/mol
- TOTAL ELECTROSTATIC ENERGY = 5.14702 kcal/mol
Similarly to the unhydrogenated adduct, the main destabilising interaction is the angle strain caused by the geometry being constrained to rings. This stops the sp3 carbon centres adopting the optimum tetrahedral bond angles (≈109°), but more importantly, constrains some of the optimum sp2 bond angles (≈120°) to around 112°, thereby significantly destabilising the molecule. The C=C bond that is hydrogenated in product 4 relieves angle strain from more strained ring – the one with the cp ring connected to the other ring in a 1,3 relationship - making product 4 significantly more stable.
After prolonged hydrogenation, both alkene groups are hydrogenated, forming compound 5 (shown below)
Total Hydrogenation Product 5
Total hydrogenation product 5
- TOTAL ENERGY = 34.36871 kcal/mol
- TOTAL BOND STRETCHING ENERGY = 2.79665 kcal/mol
- TOTAL ANGLE BENDING ENERGY = 19.42369 kcal/mol
- TOTAL STRETCH BENDING ENERGY = -1.73666 kcal/mol
- TOTAL TORSIONAL ENERGY = 2.59164 kcal/mol
- TOTAL VAN DER WAALS ENERGY = 11.29339 kcal/mol
- TOTAL OUT-OF-PLANE BENDING ENERGY = 0.00028 kcal/mol
- TOTAL ELECTROSTATIC ENERGY = 0.00000 kcal/mol
The removal of the fairly large, electron rich π-systems causes a loss of the electrostatic energy term. However slight increases in Van Der Waal’s, torsional, and angle bending terms compensate for this, resulting in only a modest decrease in energy. This explains why compound 5 is only formed under strongly hydrogenating conditions, because there is very little thermodynamic driving force to form it, and the constrained geometry could cause a significant kinetic barrier somewhere in the pathway.
Taxol isomers
O pointing down chair 1

- TOTAL ENERGY = 60.55198 kcal/mol
- TOTAL BOND STRETCHING ENERGY = 7.58567 kcal/mol
- TOTAL ANGLE BENDING ENERGY = 18.81969 kcal/mol
- TOTAL STRETCH BENDING ENERGY = -0.14119 kcal/mol
- TOTAL TORSIONAL ENERGY = 0.25370 kcal/mol
- TOTAL OUT-OF-PLANE BENDING ENERGY = 0.84764 kcal/mol
- TOTAL VAN DER WAALS ENERGY = 33.23738 kcal/mol
- TOTAL ELECTROSTATIC ENERGY = -0.05092 kcal/mol
O pointing down chair 2
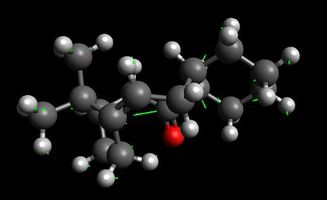
- TOTAL ENERGY = 74.79286 kcal/mol
- TOTAL ELECTROSTATIC ENERGY = 0.40711 kcal/mol
- TOTAL VAN DER WAALS ENERGY = 36.08183 kcal/mol
- TOTAL OUT-OF-PLANE BENDING ENERGY = 1.60743 kcal/mol
- TOTAL TORSIONAL ENERGY = 6.38208 kcal/mol
- TOTAL STRETCH BENDING ENERGY = -0.21176 kcal/mol
- TOTAL ANGLE BENDING ENERGY = 21.85473 kcal/mol
- TOTAL BOND STRETCHING ENERGY = 8.67143 kcal/mol
Manual movement of cyclohexane into chair conformation was required, because the first local energy minimum that was found was the twist boat 1 in each case. The energy was lowered considerably from the twist boat especially in the angle bending term. A problem was encountered when the cdxml file imported from chemdraw positioned the double bond in the wrong place in Avogadro. The double bond had to be adjusted manually to give the correct enantiomer.
O pointing down twist boat 1

- TOTAL ENERGY = 66.29036 kcal/mol
- TOTAL ELECTROSTATIC ENERGY = -0.04510 kcal/mol
- TOTAL VAN DER WAALS ENERGY = 35.03725 kcal/mol
- TOTAL OUT-OF-PLANE BENDING ENERGY = 0.85290 kcal/mol
- TOTAL TORSIONAL ENERGY = 3.20366 kcal/mol
- TOTAL STRETCH BENDING ENERGY = -0.06231 kcal/mol
- TOTAL ANGLE BENDING ENERGY = 19.59417 kcal/mol
- TOTAL BOND STRETCHING ENERGY = 7.73867 kcal/mol
O pointing down twist boat 2

- TOTAL ENERGY = 68.88540 kcal/mol
- TOTAL ELECTROSTATIC ENERGY = -0.04587 kcal/mol
- TOTAL VAN DER WAALS ENERGY = 34.67249 kcal/mol
- TOTAL OUT-OF-PLANE BENDING ENERGY = 0.95066 kcal/mol
- TOTAL TORSIONAL ENERGY = 4.43978 kcal/mol
- TOTAL STRETCH BENDING ENERGY = -0.06309 kcal/mol
- TOTAL ANGLE BENDING ENERGY = 21.08264 kcal/mol
- TOTAL BOND STRETCHING ENERGY = 7.84879 kcal/mol
O pointing up chair 1
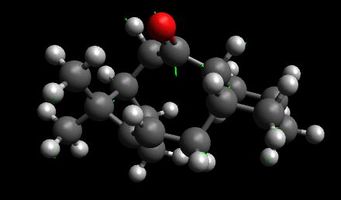
- TOTAL ENERGY = 70.54208 kcal/mol
- TOTAL ELECTROSTATIC ENERGY = 0.30243 kcal/mol
- TOTAL VAN DER WAALS ENERGY = 33.17388 kcal/mol
- TOTAL OUT-OF-PLANE BENDING ENERGY = 0.96466 kcal/mol
- TOTAL TORSIONAL ENERGY = 0.12568 kcal/mol
- TOTAL STRETCH BENDING ENERGY = -0.06034 kcal/mol
- TOTAL ANGLE BENDING ENERGY = 28.33180 kcal/mol
- TOTAL BOND STRETCHING ENERGY = 7.70398 kcal/mol
O pointing up chair 2
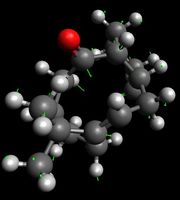
- TOTAL ENERGY = 83.16963 kcal/mol
- TOTAL ELECTROSTATIC ENERGY = 0.19227 kcal/mol
- TOTAL VAN DER WAALS ENERGY = 34.45988 kcal/mol
- TOTAL OUT-OF-PLANE BENDING ENERGY = 1.64518 kcal/mol
- TOTAL TORSIONAL ENERGY = 3.63830 kcal/mol
- TOTAL STRETCH BENDING ENERGY = 0.08444 kcal/mol
- TOTAL ANGLE BENDING ENERGY = 35.05267 kcal/mol
- TOTAL BOND STRETCHING ENERGY = 8.09688 kcal/mol
O pointing up twist boat 1
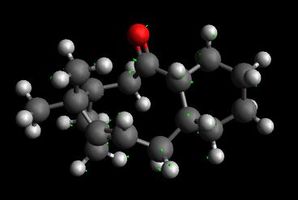
- TOTAL ENERGY = 92.24292 kcal/mol
- TOTAL ELECTROSTATIC ENERGY = 0.35822 kcal/mol
- TOTAL VAN DER WAALS ENERGY = 39.58093 kcal/mol
- TOTAL OUT-OF-PLANE BENDING ENERGY = 2.17789 kcal/mol
- TOTAL TORSIONAL ENERGY = 7.40623 kcal/mol
- TOTAL STRETCH BENDING ENERGY = -0.02043 kcal/mol
- TOTAL ANGLE BENDING ENERGY = 33.75856 kcal/mol
- TOTAL BOND STRETCHING ENERGY = = 9.49893 kcal/mol
O pointing up twist boat 2
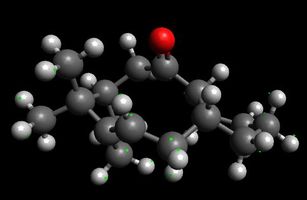
- TOTAL ENERGY = 77.90164 kcal/mol
- TOTAL ELECTROSTATIC ENERGY = 0.28462 kcal/mol
- TOTAL VAN DER WAALS ENERGY = 35.76102 kcal/mol
- TOTAL OUT-OF-PLANE BENDING ENERGY = 0.96193 kcal/mol
- TOTAL TORSIONAL ENERGY = 2.90177 kcal/mol
- TOTAL STRETCH BENDING ENERGY = -0.04709 kcal/mol
- TOTAL ANGLE BENDING ENERGY = 30.04452 kcal/mol
- TOTAL BOND STRETCHING ENERGY = 7.99487 kcal/mol
By comparing the energies of the two lowest chair forms (O pointing down chair 1, and O pointing up chair 1), it can be seen that the isomer with O pointing up is significantly higher in energy, owing almost exclusively to a significant increase in the angle bending term of 9.51211 kcal/mol of the overall 9.99901 kcal/mol increase. By considering the geometry of the two carbonyl isomers in the two chair forms, it is clear that in the isomer with O pointing up, the carbonyl group is significantly less hindered. It is therefore most likely that this is the kinetic product, and is formed in the reaction first. Upon standing, the molecule gradually isomerises to the thermodynamic product (O pointing down). In order to go from one atropisomer to the other, a fairly large energy barrier has to be overcome in the form of a boat transition state. This high rotational barrier causes the atropisomerism.
It has been observed that many polycyclic molecules that have a bridgehead alkene display so-called "hyperstability".[3] This molecule has a bridgehead alkene, so a calculation was carried out to check whether it is likely to be "hyperstable". The optimum geometry of the hydrogenated product was computed, and the energy difference between the hydrogenated and unhydrogenated molecules was found.
O down, hydrogenated bond
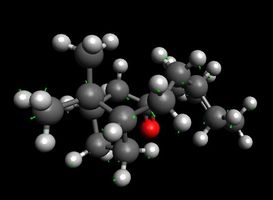
- TOTAL ENERGY = 78.42504 kcal/mol
- TOTAL ELECTROSTATIC ENERGY = 0.00000 kcal/mol
- TOTAL VAN DER WAALS ENERGY = 32.65447 kcal/mol
- TOTAL OUT-OF-PLANE BENDING ENERGY = 0.22022 kcal/mol
- TOTAL TORSIONAL ENERGY = 5.61974 kcal/mol
- TOTAL STRETCH BENDING ENERGY = 0.41266 kcal/mol
- TOTAL ANGLE BENDING ENERGY = 32.61816 kcal/mol
- TOTAL BOND STRETCHING ENERGY = 6.89979 kcal/mol
There is a large energy difference between the hydrogenated and unhydrogenated products (17.87 kcal/mol in favour of the unhydrogenated product).This explains the observed “hyperstability” of the alkene. Using the most stable cyclohexane ring configuration, when the bond is hydrogenated, the optimised energy of the molecule as a whole is greatly increased. Hydrogens are used in the model, but most reactions that change the hybridisation of the sp2 alkene carbons into sp3, are likely to be unfavourable, because they significantly increase the angle strain of the new molecule. Many examples of such “hyperstable” alkenes have been reported, generally in polycyclic compounds[3] [4]
Spectroscopy of an Intermediate Related to the Synthesis of Taxol
Compounds 17 and 18 are derivatives of the corresponding atropisomer from the Taxol intermediate discussed above. Compound 17 comes from the isomer with O "up" and Compound 18 comes from the isomer with O "down". The objective of this part was to model the proton and carbon 13 NMR spectra of one of these molecules and compare it to literature to see how useful the computed simulation is. The most stable isomer was chosen, since that is the one that a real NMR spectrum can be taken of with the highest accuracy.
Compound 17
17
- TOTAL ENERGY = 118.40300 kcal/mol
- TOTAL ELECTROSTATIC ENERGY = -7.54836 kcal/mol
- TOTAL VAN DER WAALS ENERGY = 51.77407 kcal/mol
- TOTAL OUT-OF-PLANE BENDING ENERGY = 1.64623 kcal/mol
- TOTAL TORSIONAL ENERGY = 15.49459 kcal/mol
- TOTAL STRETCH BENDING ENERGY = 0.62426 kcal/mol
- TOTAL ANGLE BENDING ENERGY = 40.20517 kcal/mol
- TOTAL BOND STRETCHING ENERGY = 16.20705 kcal/mol
Compound 18
18
- TOTAL ENERGY = 100.51825 kcal/mol
- TOTAL ELECTROSTATIC ENERGY = -6.01269 kcal/mol
- TOTAL VAN DER WAALS ENERGY = 49.36777 kcal/mol
- TOTAL OUT-OF-PLANE BENDING ENERGY = 0.87631 kcal/mol
- TOTAL TORSIONAL ENERGY = 9.67657 kcal/mol
- TOTAL STRETCH BENDING ENERGY = 0.67218 kcal/mol
- TOTAL ANGLE BENDING ENERGY = 30.91682 kcal/mol
- TOTAL BOND STRETCHING ENERGY = 15.02128 kcal/mol
The most stable conformer for each atropisomer has the cyclohexane ring in the chair conformation with the five membered dithiane ring pointing away from the rest of the molecule. This five membered ring adopts the most stable envelope formation. It was found that changing the type of envelope formation the five membered ring adopted changed the overall molecule energy only very slightly (±0.15 kcal/mol), changing the cyclohexane conformers changed the total molecule energy more significantly (± 5 kcal/mol) consequently no further analysis of the free energies of the envelope conformers was carried out, and focus was moved to the different cyclohexane conformations.
Following on from the trend observed in compounds 9 and 10, the isomer with O pointing down is thermodynamically more stable. This is once again due mainly to a significant increase in angle bending energy. The torsional energy increase is even more pronounced on going from 17 to 18, than on going from 9 to 10. This is most likely due to one proton on a ring bridging atom being replaced by a methyl group.
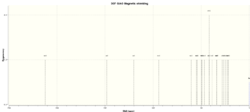
NMR Spectra of Compound 18
 |
 |
 |
|
Computed Values DOI:10042/26035 |
Experimental Values[5] | ||
|
Chemical Shift/ppm |
Integration |
Chemical Shift/ppm |
Integration |
|
|
|
|
|
|
|
|
|
|
|
|
|
|
|
|
|
|
|
|
|
|
|
|
|
|
|
|
|
|
|
|
|
|
|
|
|
|
|
|
|
|
|
|
|
|
|
|
|
|
|
|
|
|
|
|
|
|
|
|
|
|
|
|
|
|
|
|
|
|
|
|
|
|
|
|
|
|
|
|
|
|
|
|
|
|
|
|
|
|
Table 2: Correlating Computed and Experimental Proton NMR Spectra for Compound 18 (values in bold are the averaged chemical shifts of degenerate protons in methyl groups. Values in brackets are the number of protons of a computed peak that have been assigned to a certain experimental peak)
From the above table it can be seen that there is a fairly good qualitative agreement between the computed and experimental values. In both spectra the allylic proton (21) has the highest chemical shift. Of the two anisotropic protons on a CH2 group opposite the C=C bond (28 and 29) the one that is closer to the alkene (28, δ = 2.77 ppm) is more deshieded than 29, δ = 1.58 ppm because it is closer to the deshielding region of the cone that is caused by the π orbital. The same is true for the protons opposite the carbonyl group (39 and 40). 39, δ = 2.77 ppm is more deshielded than 40, δ = 2.65 ppm because it is closer to the C=O π orbital. The two methyl groups attached to the cyclopentane ring (33, 34, 35, and 36, 37, 38) are the least deshielded in both experiment and computed model. Quantitatively, however, the chemical shift values do not agree as well. The computed values are spread over a wider range, causing considerable deviations from experimental values, especially at the “ends” of the spectrum.
|
Computed Values DOI:10042/26035 |
Experimental Values[5] |
Deviation | |
|
Chemical Shift/ppm |
Integration |
Chemical Shift/ppm |
Magnitude/ppm |
|
|
|
|
|
|
|
|
|
|
|
|
|
|
|
|
|
|
|
|
|
|
|
|
|
|
|
|
|
|
|
|
|
|
|
|
|
|
|
|
|
|
|
|
|
|
|
|
|
|
|
|
|
|
|
|
|
|
|
|
|
|
|
|
|
|
|
|
|
|
|
|
|
|
|
|
|
|
|
|
|
|
|
|
|
|
|
|
|
|
|
|
|
|
|
|
|
|
|
|
Table 3: Correlating Computed and Experimental 13C NMR Spectra for Compound 18 (values in bold are the averaged chemical shifts of degenerate protons in methyl groups. Values in brackets are the number of carbon atoms of a computed peak that have been assigned to a certain experimental peak)
Despite the fact that a fairly simple DFT method was used to calculate the chemical shifts, the agreement between the computed and experimental values is surprisingly good. Unlike in the proton NMR spectrum, the values are closest together at the “ends” of the spectrum, and diverge near the middle. There is however, one very large deviation (marked in red), of nearly 20 ppm. This represents the carbon (14) in the five membered ring, that is attached to two sulphur atoms. Heavy atoms such as sulphur often cause higher than expected computed chemical shift values due to significant spin-orbit coupling,[6] which isn’t considered in DFT calculations. The other two carbons that are bonded to one sulphur atom each also display significantly more deshielded chemical shift values compared to experiment (marked in yellow). A more rigorous method that takes into account the spin-orbit contribution to nuclear shielding, such as ZORA [6]Predicting 13C NMR Spectra by DFT Calculations, needs to be used to give chemical shifts that are in better agreement with the experimental values.
Despite some significant deviations from experimental values, on the whole the computed spectra are accurate enough to still be useful in qualitatively checking that the experimental spectrum has been assigned correctly, and that the desired molecule has been synthesised.
Energy Comparison
The free energies of compound 17 and 18 were computed in their lowest conformations.
Free energy of Compound 17 DOI:10042/26047 = -1651.44 hartree
Free energy of Compound 18 DOI:10042/26035 = -1651.46 hartree
This shows that there is a very large energy difference of 59.79 kJ/mol between the two atropisomers. Compound 18 is more stable, just as Avogadro predicted. The fact that such a large difference in free energy can be stopped by a rotational barrier suggests that the rotational barrier must be very high.
Part 2
Crystal Structures of Catalysts
Shi Catalyst
Shi Catalyst Crystal Structure
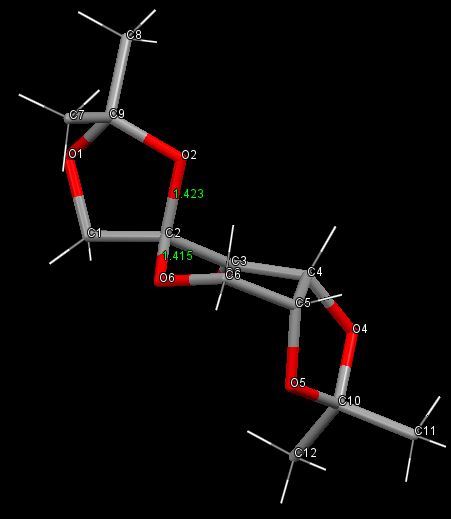 |
As is often the case for cyclohexanes, the six membered ring forms a chair conformation in order to minimise torsional strain. O6 has no substituents, but it has two lone pairs (LPs) which occupy axial and equatorial positions. These LPs are only bound to one atom, so the electrons in them are ‘held’ less tightly than those found in bonding orbitals. This makes them very good donors of electron density. In order for there to be a strong interaction, some electron density from the LPs must be donated into an empty acceptor orbital of the correct symmetry, as close in energy as possible to the donor LP. The best acceptor orbital that the LP can overlap with is the antiperiplanar C2-O2 σ* orbital. Because O2 also has lone pairs, the same interaction could go both ways, having no net result, but evidently the C2-O6 bond is shortened and C2-O2 is lengthened. This is because the five membered ring adopts the envelope conformation, which doesn’t allow perfectly antiperiplanar overlap between the O2 LP and the C2-O6 σ* orbital. Consequently, the donation from the LP on O6 is prevalent. This gives the C2-O6 bond in the six membered ring partial double bond character (making it the shortest formally single C-O bond in the whole molecule), while weakening the C2-O2 bond, leading to the observed distances.
Another notable feature of this structure is that in both five membered rings, the C-O bond that is closer to the ketone group is longer than the one that is further from the ketone. This is true for both the C9, and C10 rings. In the C10 ring, both C-O bonds are in very similar electronic environments, so this lengthening is unlikely to be an electronic effect. It is more likely that these distortions of the bond lengths happen in order to angle the bulky methyl groups on the ends of both rings away from the rest of the molecule, and the C=O π-cloud, to minimise steric repulsions. Another explanation for these distortions could be that they happen in order to orientate the molecule in a way as to optimise short contacts in the crystal. These same distortions would then not be present in solution.
Jacobsen Catalyst
Jacobsen Catalyst Crystal Structure
 |
It can be seen from the crystal structure of the Jacobsen Catalyst that the two tertiary butyl groups (centred on C21 and C35) come quite close together. The distance between the hydrogen atoms is much greater than twice the Van Der Waals radius of hydrogen (2.18 Å), so it is unlikely that there is any attractive interaction between them.
A more important consequence of the close approach of these two centres is when the role of the complex as an asymmetric catalyst is considered. The small distance between the hydrogen atoms of the two tertiary butyl groups is less than 2.634 Å; the combined C-C (1.544 Å), and C-H (1.09 Å) bond lengths. This means that any molecule large enough to have an alkene group won’t fit through the gap. The two tertiary butyl groups therefore act as a barrier to the approach of the alkene, forcing it to come from the opposite side of the complex.
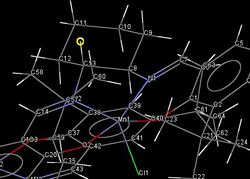 |
At the opposite side of the complex, there is a cyclohexane ring in the chair form, binding equatorially to the imine groups. This leaves two axial hydrogen atoms: one pointing “up” (marked in yellow), and one pointing “down”. This is another asymmetric feature of the complex, which further restricts the alkene’s approach to the active site of the catalyst (directly “above” the chlorine atom).[7]The complex is roughly square based pyramidal, but due to the conformation of the cyclohexane ring, the “right” side of the salen ligand becomes bent above the plane. This leaves just one direction of approach of the double bond of the alkene: directly between C13 and C103, leading to the enantioselectivity of the catalyst. The larger substituent will prefer to avoid the aromatic ring and tertiary butyl groups, which would cause steric repulsions(and π-π if the substituent is aromatic), so it will be on the side of the cyclohexane.
Predicting NMR Spectra of Styrene oxide and Trans-Stilbene Oxide
Once again, Avogadro was used to minimise the energy of each molecule before the geometry was subjected to NMR analysis in Gaussian
Styrene oxide energy minimisation
- TOTAL ENERGY = 21.61557 kcal/mol
- TOTAL ELECTROSTATIC ENERGY = 3.08698 kcal/mol
- TOTAL VAN DER WAALS ENERGY = 13.66228 kcal/mol
- TOTAL OUT-OF-PLANE BENDING ENERGY = 0.00171 kcal/mol
- TOTAL TORSIONAL ENERGY = 2.34609 kcal/mol
- TOTAL STRETCH BENDING ENERGY = -0.74580 kcal/mol
- TOTAL ANGLE BENDING ENERGY = 1.42442 kcal/mol
- TOTAL BOND STRETCHING ENERGY = 1.83990 kcal/mol
Trans Stilbene oxide energy minimisation
- TOTAL ENERGY = 39.45999 kcal/mol
- TOTAL ELECTROSTATIC ENERGY = 5.33972 kcal/mol
- TOTAL VAN DER WAALS ENERGY = 26.90216 kcal/mol
- TOTAL OUT-OF-PLANE BENDING ENERGY = 0.00280 kcal/mol
- TOTAL TORSIONAL ENERGY = 2.33132 kcal/mol
- TOTAL STRETCH BENDING ENERGY = -1.54333 kcal/mol
- TOTAL ANGLE BENDING ENERGY = 2.69838 kcal/mol
- TOTAL BOND STRETCHING ENERGY = 3.72893 kcal/mol
NMR Spectra
Styrene Oxide
|
Computed Values DOI:10042/26036 and DOI:10042/26037 |
Experimental Values[8] | ||||
|
Chemical Shift/ppm |
Coupling Constant/ Hz |
Integration |
Chemical Shift/ppm |
Coupling Constant/Hz |
Integration |
|
7.489 |
- |
4
|
7.382 - 7.181 (m) |
- |
5
|
|
7.298 |
- |
1
|
|
|
|
|
3.66 |
4.4(3JH15H16) , 1.9(3JH15H17) |
1
|
3.817 (dd) |
4.1(3JH15H16), 2.6(3JH15H17) |
1
|
|
3.114 |
5.6 (3JH16H17), 4.4(3JH15H16) |
1
|
3.091 (dd) |
5.5(3JH16H17), 4.1(3JH15H16) |
1
|
|
2.534 |
5.6(3JH16H17), 1.9(3JH15H17) |
1
|
2.758 (dd) |
5.5(3JH16H17), 2.6(3JH15H17) |
1
|
Table 4: Correlating Computed and Experimental Proton NMR Spectra for styrene oxide
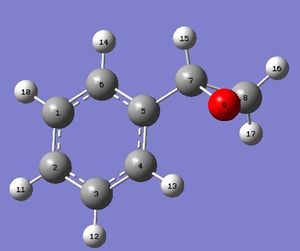 |
On the whole, the spectra agree very well. The five aromatic protons all form a tight group at around 7.3 ppm, which is only slightly above the experimental value. As expected, the proton on the side chain closest to the aromatic ring (15) is more deshielded than the two on the far side (16 and 17), because it is exposed to more ring currents. Coupling constants also match up fairly well, except for 3JH15H17, which is out by 0.7 Hz; this is more than 25% of the literature value. This could be due to the influence of the electronegative oxygen atom between the two protons that are coupling to each other.
|
Computed Values DOI:10042/26036 |
Experimental Values[8] |
Deviation |
|
Chemical Shift/ppm |
Chemical Shift/ppm |
Magnitude/ppm |
|
135.14
|
137.68
|
2.54
|
|
123.77
|
128.47
|
4.70
|
|
122.96
|
128.13
|
5.17
|
|
120.61
|
125.49
|
4.88
|
|
54.05
|
52.26
|
1.79
|
|
53.45
|
51.04
|
2.41
|
Table 5: Correlating Computed and Experimental Carbon NMR Spectra for styrene oxide (values in bold are the averaged chemical shifts of equivalent carbon atoms)
As with the proton NMR spectrum, the computed values of the Carbon 13 NMR spectrum match up fairly well with the literature values. The spectra follow the same trend: carbon 5 is the most deshielded because it is exposed to ring currents, and is in close proximity to the electronegative oxygen. Similarly to the carbon 13 NMR spectrum of compound 18, the biggest deviations are near the middle of the spectrum, and the ends are more accurate.
Trans-Stilbene Oxide
R,R Trans Stilbene Structure
|
Computed Values DOI:10042/26038 |
Experimental Values[9] | ||
|
Chemical Shift/ppm |
Integration |
Chemical Shift/ppm |
Integration |
|
7.571
|
4
|
7.26–7.45 (m) |
10
|
|
7.490
|
2
|
|
|
|
7.469
|
2
|
|
|
|
7.451
|
2
|
|
|
|
3.537
|
2
|
3.86 (s) |
2
|
Table 6: Correlating Computed and Experimental proton NMR spectra for trans stilbene oxide (values in bold are the averaged chemical shifts of equivalent protons)
As with the other computed spectra, the general trend is followed well. The aromatic protons come up at around 7-7.5 ppm, which is expected for aromatic protons. They are close enough together to be a multiplet on an actual NMR spectrum. The protons on the epoxide group are considerably more deshielded in the literature spectrum, but the shifts of the two groups are sufficiently far apart to identify the molecule even from the computed spectrum.
|
Computed Values DOI:10042/26038 |
Experimental Values[9]
|
Deviation | ||
|
Chemical Shift/ppm |
Integration |
Chemical Shift/ppm |
Integration |
Magnitude/ppm |
|
134.09
|
2
|
136.99
|
2
|
2.90
|
|
123.87
|
4
|
128.44
|
4
|
4.57
|
|
123.21
|
4
|
128.19
|
4
|
4.98
|
|
120.50
|
2
|
125.4
|
2
|
4.90
|
|
66.43
|
2
|
62.81
|
2
|
3.62
|
Table 7: Correlating Computed and Experimental carbon NMR spectra for trans stilbene oxide (values in bold are the averaged chemical shifts of equivalent carbon atoms)
In the computed carbon spectrum, the aromatic carbons show up in the expected region around 125 ppm, and the epoxide carbons are also quite deshielded at around 66 ppm. Both chemical shifts are fairly close to the literature values, as indicated by the small deviations. Because the molecule is so symmetric, all of the chemical shifts are averaged values taken from the static spectrum.
Optical Rotations
The NMR spectra have confirmed that the correct connectivity of atoms is present in the epoxides, but NMR cannot predict which enantiomer has been formed, without adding a chiral resolving agent. A much more straightforward way of determining which enantiomer is which, is to measure their optical rotations at a specific wavelength. The Sodium D line (589.29 nm) is used in the laboratory to measure this value in the mixture of enantiomers. This mixture is then sent through a chiral GC column that separates the two enantiomers. Enantiomeric excess can be calculated from the ratio of peak areas in the GC trace, and the prevalent isomer can be found from inspecting the optical rotation of the mixture. Each enantiomer will rotate light by the same degree, but the rotations will be in opposite directions, so if the overall rotation of the mixture is in the direction of one enantiomer, then that enantiomer is the prevalent one. The computed optical rotations can be used for this analysis, but they will be compared with literature values to ensure their accuracy.
|
Compound |
Styrene Oxide DOI:10042/26039 |
Trans Stilbene Oxide DOI:10042/26040 | ||
|
Enantiomer |
R |
S |
R,R |
S,S |
|
Computed ORP /deg |
30.18
|
-30.18
|
297.92
|
-297.92
|
|
Literature ORP /deg |
33.00
|
-33.00
|
295.05
|
-295.05
|
Table 8: Comparison of computed and literature optical rotatory powers of Styrene oxide[10] and trans stilbene oxide[11]
It is clear from the above table that the computed optical rotations for the two epoxides are of very similar magnitudes, and in the same directions as the literature values. The literature values were intended to provide a way of evaluating the accuracy of the computed results, but these vary quite widely from one source to another, especially for trans stilbene.[12] [11]It is therefore impossible to completely evaluate the accuracy of the computed values, except to say that they are in the same range as the literature values. They are therefore just as useful for the purposes of this experiment, where only the direction of optical rotation is of interest.
Comparing Transition State Energies for Shi and Jacobsen Epoxidation
The energies of the provided transition state geometries were found, and used to find the predicted enantiomeric excesses of each reaction.
Shi Epoxidation of Styrene
|
Styrene Oxide Shi Epoxidation Transition States |
| ||
|
Transition state |
Sum of electronic and thermal Free Energies (hartree) |
Sum of electronic and thermal Free Energies (kJ/mol) |
|
|
-1303.730703
|
-3422944.961
|
| |
|
-1303.730238
|
-3422943.740
|
Least Stable for R | |
|
-1303.736813
|
-3422961.003
|
| |
|
-1303.738044
|
-3422964.235
|
Most Stable for R | |
|
-1303.733828
|
-3422953.165
|
| |
|
-1303.724178
|
-3422927.829
|
Least Stable Overall | |
|
-1303.727673
|
-3422937.005
|
| |
|
-1303.738503
|
-3422965.440
|
Most Stable Overall | |
Table 9: Comparing Free energies of possible Transition States during Shi Epoxidation of Styrene
Shi Transition States
|
Trans Stilbene Oxide Shi Epoxidation Transition States |
| ||
|
Transition state |
Sum of electronic and thermal Free Energies (hartree) |
Sum of electronic and thermal Free Energies (kJ/mol) |
|
|
-1534.687808
|
-4029322.840
|
| |
|
-1534.687252
|
-4029321.380
|
Least Stable RR | |
|
-1534.700037
|
-4029354.947
|
Most Stable Overall | |
|
-1534.699901
|
-4029354.590
|
| |
|
-1534.68344
|
-4029311.372
|
Least Stable Overall | |
|
-1534.685089
|
-4029315.701
|
| |
|
-1534.693818
|
-4029338.619
|
Most Stable SS | |
|
-1534.691858
|
-4029333.473
|
| |
Table 10: Comparing Free energies of Possible Transition States during Shi Epoxidation of trans stilbene
Of the 8 possible transition state structures, structure S2 is the least stable overall. This is partly because the bulky benzene ring is very close to the one of the methyl groups on the five membered ring of the catalyst. But the most important feature of the structure that destabilises this transition state compared to the others is that the six membered ring is in an unstable twist boat form. Structure S4, like structure S2, results in the formation of the S enantiomer, but the geometry is far more stable (37.610 kJmol-1 lower in energy). This is because the six membered ring forms a stable chair structure, and the benzene ring is orientated so that it doesn’t come into close contact with any groups on the catalyst.
The two transition states that would form the R enantiomer are both higher in energy than S4, but lower in energy than S2. They both have the six membered ring as a chair, which makes them more stable than S2, but neither of them has the styrene molecule positioned as optimally as in S4. In R2, the alkene suffers repulsions from the axial LP of the O on the six membered ring, and in R4, the benzene ring comes too close to the hydrogen atom that is α to the dioxirane that used to be the ketone.
As with the transition states for styrene epoxidation, the least stable transition state (SS1) has the six membered ring in the unstable twist boat conformation. It also has the trans stilbene twisted, which makes it lose almost all of its π-conjugation. The most stable transition state (RR3) has a nearly planar trans stilbene, and a six membered ring in the chair form. Furthermore, in this structure neither of the two bulky phenyl groups come close to any groups on the catalyst; this minimises steric repulsions.
The preferred product of each reaction, and hence the enantiomeric excess, depends on the relative rates of formation of each isomer. These can be calculated from the free energy difference between the lowest energy transition state for each isomer.
For styrene oxide, the difference between the most stable S transition state (S4), and the most stable R transition state (R4) is 1.205 kJmol-1 in favour of the S isomer. For trans stilbene oxide the energy difference is 43.575 kJmol-1 in favour of the R,R isomer. It is worth noting that in both the lowest energy transition states, it is the “equatorial” oxygen of the dioxirane that gets transferred to the alkene. This is most likely because it is most accessible.
The following formula can be used to calculate the equilibrium constant from the energy difference, and hence the ee.
Kstyrene = 0.61501 = ee = 23.84% (S)
Kstilbene =2.3204×10-8 = ee = 100.0% (R,R)
Enantiomeric excess is defined as the absolute difference between the mole fraction of each enantiomer. The equilibrium constant gives the ratio of transition state concentrations for each enantiomer, it is assumed that once this transition state is reached that the reactants go on to form products straight away, so that the above ratios are equal to the concentrations of the final products. From these ratios the mole fractions of each enantiomer can be found, and from them the ee. No literature value for the ee obtained from shi epoxidation was found, but it is noted that cis alkenes and terminal alkenes displayed low ees.[13] The literature value for trans stilbene is 98.0% ee (R,R)[14]. Both computed values agree very well with the literature, and the computed energy differences between the two lowest transition states can even help rationalise the observed selectivity. For styrene, the activation energy required to reach the transition state leading up to the S isomer is only slightly lower than the one required to reach the one leading up to the R isomer. Consequently, the pathway leading up to the S isomer is only slightly favoured, leading to a low ee. In the case of trans stilbene, the energy difference between the two transition states is huge, so the pathway leading up to the (R,R) isomer is favoured so much that the other pathway is hardly followed at all. This gives a very high enantiomeric excess. The reason the real value is lower than the predicted value of 100% is that simply reaching the transition state is not enough to guarantee a successful reaction, the reactants can go back to their starting states instead. This means that they can then react again, and have a chance of following the less favoured pathway.
Jacobsen Transition States
|
'Cis Beta Methyl Styrene Jacobsen Epoxidation Transition States |
| ||
|
Transition state |
Sum of electronic and thermal Free Energies (hartree) |
Sum of electronic and thermal Free Energies (kJ/mol) |
|
|
-3383.259559
|
-8882747.972
|
Most Stable | |
|
-3383.253442
|
-8882731.912
|
| |
|
-3383.25106
|
-8882725.658
|
Most Stable RS | |
|
-3383.25027
|
-8882723.584
|
Least Stable | |
|
Trans Beta Methyl Styrene Jacobsen Epoxidation Transition States | |||
|
-3383.253816
|
-8882732.894
|
Least Stable | |
|
RR2 |
-3383.254344
|
-8882734.280
|
Most Stable RR |
|
SS1 |
-3383.262481
|
-8882755.644
|
Most Stable |
|
SS2 |
-3383.257847
|
-8882743.477
|
|
Table 11: Comparing Free energies of Possible Transition States during Jacobsen Epoxidation of cis and trans beta methyl styrene
Of the four possible transition states for cis beta methyl styrene, RS2 is the least stable. This is because the bulky phenyl group is pointing towards the axial hydrogen on the cyclohexane ring, and a tertiary butyl group, causing repulsion. The most stable structure (SR1) has the phenyl group pointing away from the axial hydrogen, and not close to any other group on the catalyst. This means that structure SR1 is much more stable than the most stable transition state that leads up to an RS product. The result is a large energy difference of. Using the formula outlined above: kcis = 1.232×10⁻⁴, ee = 99.98% (S,R). This is again significantly higher than the reported ee of 83% (S,R) again most likely due to the assumption that once the transition state has been reached the reaction goes to completion.
All of the transition states for trans beta methyl styrene are higher in energy than even the highest transition state for cis beta methylstyrene. This is because the trans molecule doesn’t fit as well into the active site. However, there is still a significantly large energy gap to cause enantioselectivity (21.364 kJmol-1 in favour of the SR product). This gives an expected ee = 99.97%. it has been reported that the Jacobsen catalyst gives poor ees with trans alkenes,[15]so it is surprising that such a high ee was computed. More research could be undertaken to check whether trans beta methyl styrene is an exception to this rule. In both cases selectivity is imparted due to the asymmetric nature of the catalyst, which causes non-degenerate transition states.
Non Covalent Interaction Analysis in the transition state of Shi Epoxidation of trans stilbene
The non-covalent interactions were calculated for the most stable Shi transition state for trans stilbene (RR3). An electronic topology (QTAIM) analysis of this structure was also calculated. This displays the same interactions as the NCI image, but also shows the atoms the interaction is between, and its bond critical point. The bond critical point is the stationary point of the curvatures of the wavefunctions that represent the interaction in all three dimensions. In a simple linear bond, the position of the bond critical point indicates how much electron density is near each atom in the bond.
Orbital |
NCI image of most stable Shi Transition state for trans-stilbene
The NCI analysis shows hydrogen bonds and short contacts in the transition state. The bluer the colour the more attractive the interaction, and the redder the more repulsive it is. The multi coloured ring in the middle is the new bond that is being formed.
 |
 |
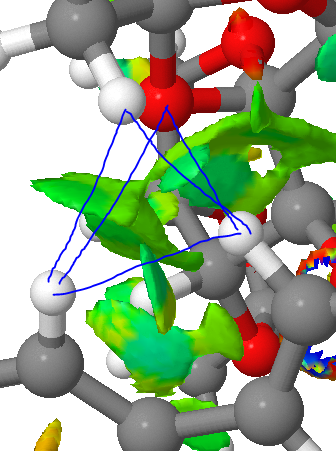
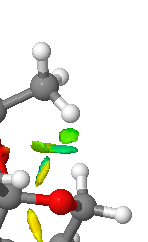
The most striking feature of the NCI image is the highly attractive region in the top right hand region of the image (shown in detail above). The QTAIM analysis shows that this is a mixture of two H bonds (both to one oxygen) and two H-H short contacts, forming an almost tetrahedral shape.
 |
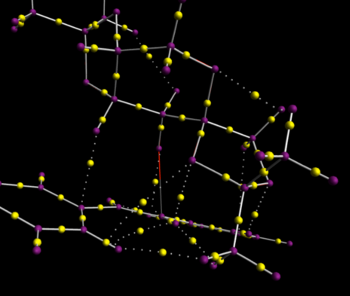 |
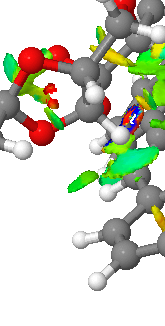
Another interesting feature of the NCI image is a highly attractive H-C short contact. This is surprising because it is just as strong, if not stronger than a normal H bond between H and O. A H-bond is strong because of the large electronegativity difference between H and O, but C is far less electronegative than O, so the H-C non-covalent interaction tends to be much weaker. The reason this one is an exception is most likely due to the fact that the C is on a conjugated system that bridges two benzene rings. This means that electron density that is spread out over six Cs in the benzene rings is funnelled through just one C. This makes it very electron rich, and able to form such a strong interaction with a H. This interaction is represented in the QTAIM image as well (bottom left). This shows how the majority of the electron density lies with the C.
 |
 |
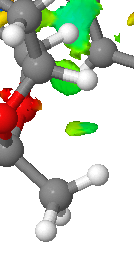
This part of the NCI shows a strong H_bond like interaction between a H on a methyl group and an O of one of the acetal rings on the catalyst. This interaction looks slightly weaker than the H-C contact above. It is displayed in the QTAIM image as an interaction between H17 and O6.
 |
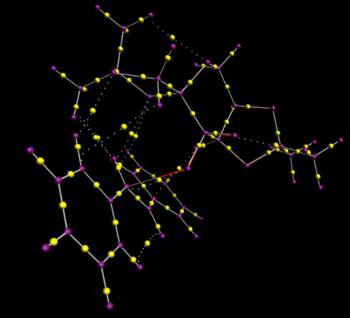 |
This is an example of a H-H short contact between two hydrogens on the catalyst. It is slightly weaker than the H-O interaction. This interaction is shown on the bottom left of the QTAIM image (bottom). It can be seen from this that the bond critical point is in the middle of the two atoms and hence the electron density is evenly spread.
Conclusion
Overall, it is these non covalent interactions that dominate in favouring just one of the possible transition states, and therefore just one of the possible enantiomers. Computer modelling has proved to be a useful tool that is now accurate enough to probe the interactions within a transition state. further research and development is required before these calculations can be carried out on large molecules over reasonable timescales. When this is possible, computer simulations could further help design specialised, highly effective catalysts like those found in nature.[16]
Other Candidate for Research
A possible candidate for further investigation is (+)-((2R,3R)-trans-3-phenyloxiran-2-yl)methanol. This is formed from a simple alkene with an allylic OH group, so it could serve to verify whether a particular catalyst is tolerant of an alcoholic functional group, and whether or not this effects the ee. The starting material: 3-phenyl-2-propen-1-ol (cinnamyl alcohol) is available fairly cheaply from the Aldrich catalogue. The epoxide has an optical rotation of 57.5° at 20°C[17]
References
Template loop detected: Template:Reflist
- ↑ Hoffmann, R., & Woodward, R. B. (1965). Selection rules for concerted cycloaddition reactions. Journal of the American Chemical Society, 87(9), 2046-2048.
- ↑ 2.0 2.1 Sauer, J., & Sustmann, R. (1980). Mechanistic Aspects of Diels‐Alder Reactions: A Critical Survey. Angewandte Chemie International Edition in English, 19(10), 779-807.
- ↑ 3.0 3.1 Maier, W. F., & Schleyer, P. V. R. (1981). Evaluation and prediction of the stability of bridgehead olefins. Journal of the American Chemical Society, 103(8), 1891-1900.
- ↑ Camps, P., Pujol, X., Vázquez, S., Pericàs, M. A., Puigjaner, C., & Solà, L. (2001). Cross-coupling of a functionalized highly pyramidalized alkene: DSC and NMR study of the [2+ 2] retrocycloaddition of cyclobutane cross products, hyperstability and pyramidalization of the formed dienes. Tetrahedron, 57(40), 8511-8520.
- ↑ 5.0 5.1 Paquette, L. A., Pegg, N. A., Toops, D., Maynard, G. D., & Rogers, R. D. (1990). [3.3] Sigmatropy within 1-vinyl-2-alkenyl-7, 7-dimethyl-exo-norbornan-2-ols. The first atropselective oxyanionic Cope rearrangement. Journal of the American Chemical Society, 112(1), 277-283.
- ↑ 6.0 6.1 Bagno, A., Rastrelli, F., & Saielli, G. (2003). Predicting 13C NMR spectra by DFT calculations. The Journal of Physical Chemistry A, 107(46), 9964-9973.
- ↑ Zhang, W., Loebach, J. L., Wilson, S. R., & Jacobsen, E. N. (1990). Enantioselective epoxidation of unfunctionalized olefins catalyzed by salen manganese complexes. Journal of the American Chemical Society, 112(7), 2801-2803.
- ↑ 8.0 8.1 Palucki, M., Pospisil, P. J., Zhang, W., & Jacobsen, E. N. (1994). Highly enantioselective, low-temperature epoxidation of styrene. Journal of the American Chemical Society, 116(20), 9333-9334.
- ↑ 9.0 9.1 Organic Syntheses, Coll. Vol. 9, p.288 (1998); Vol. 74, p.91 (1997).
- ↑ Lin, H., Qiao, J., Liu, Y., & Wu, Z. L. (2010). Styrene monooxygenase from< i> Pseudomonas sp. LQ26 catalyzes the asymmetric epoxidation of both conjugated and unconjugated alkenes. Journal of Molecular Catalysis B: Enzymatic, 67(3), 236-241.
- ↑ 11.0 11.1 SejeráPedersen, D. (2006). Diphenylphosphinoyl chloride as a chlorinating agent–the selective double activation of 1, 2-diols. Organic & biomolecular chemistry, 4(16), 3117-3119.
- ↑ Denmark, S. E., & Matsuhashi, H. (2002). Chiral fluoro ketones for catalytic asymmetric epoxidation of alkenes with oxone. The Journal of Organic Chemistry, 67(10), 3479-3486.
- ↑ Wang, Z. X., Tu, Y., Frohn, M., Zhang, J. R., & Shi, Y. (1997). An efficient catalytic asymmetric epoxidation method. Journal of the American Chemical Society, 119(46), 11224-11235.
- ↑ Wong, O. A., & Shi, Y. (2008). Organocatalytic oxidation. Asymmetric epoxidation of olefins catalyzed by chiral ketones and iminium salts. Chemical reviews, 108(9), 3958-3987.
- ↑ McGarrigle, E. M., & Gilheany, D. G. (2005). Chromium-and manganese-salen promoted epoxidation of alkenes. Chemical reviews, 105(5), 1563-1602.
- ↑ Albery, W. J., & Knowles, J. R. (1976). Evolution of enzyme function and the development of catalytic efficiency. Biochemistry, 15(25), 5631-5640.
- ↑ Sarabia, Francisco; Vivar-Garcia, Carlos; Garcia-Castro, Miguel; Garcia-Ruiz, Cristina; Martin-Galvez, Francisca; Sanchez-Ruiz, Antonio; Chammaa, Samy Chemistry - A European Journal, 2012 , vol. 18, # 47 p. 15190 - 15201
