Rep:Mod:jialeiq411
Part 1
Optimisation of XY3 molecule
1. Results for Optimized BH3 using 3-21G Basis Set
Starting BH3 molecule was created using GaussView 5.0 from trigonal planar BH3 fragment and B-H bond lengths were set to 1.53Å, 1.54Å and 1.55Å. Optimisation was done for the molecule based on Density Function Theory, using B3LYP method and 3-21G basis set without restricting the symmetry group of the molecule.
The optimisation was completed in 7 steps. Both the Total Energy and RMS Gradient decreases through the optimisation process and reached minimum values at the final step as shown in Figure 1. This shows that the final molecule had the lowest energy and is the most stable. The gradient, dE/dr, represent the force acting on the molecule. The final value of the gradient was close to zero, which indicated that there is close to zero force acting on the optimised molecule. However, the non-zero gradient at the last optimisation step indicated that the optimized molecule was not yet at equilibrium. Therefore, the optimisation has produced BH3 molecule which is very closed to the equilibrium with minimum energy and close-to-zero net force acting on it.
| Result Summary | Supporting Data | |
|---|---|---|
| File Type | .log | Item Value Threshold Converged?
Maximum Force 0.000220 0.000450 YES
RMS Force 0.000106 0.000300 YES
Maximum Displacement 0.000709 0.001800 YES
RMS Displacement 0.000447 0.001200 YES
Predicted change in Energy=-1.672478D-07
Optimization completed.
-- Stationary point found.
|
| Calculation Type | FOPT | |
| Calculation Method | RB3LYP | |
| Basis Set | 3-21G | |
| Charge | 0 | |
| Spin | Singlet | |
| E(RB3LYP) | -26.46226429 a.u. | |
| RMS Gradient Norm | 0.00008851 a.u. | Figure 1 |
| Dipole Moment | 0.00 Debye |
|
| Point Group | Cs | |
| B-H Bond Length | 1.19 Å | |
| H-B-H Bond Angle | 120.0o | |
| Job CPU time | 2 minutes 22.0 seconds | |
| LOG File | File:QJL BH3 OPT.LOG | |
2. Results for Optimised BH3 using 6-31G (d,p) Basis Set
Optimisation of the BH3 molecule obtained from stage 1 using 3-21G basis set was repeated using an improved basis set, 6-31G (d,p). Optimisation was completed in 2 steps and the results are summarized below.
In comparison to the previous calculation done using 3-21G basis set, there was a slight decrease of 0.0021Å in bond length. The decrease in bond length is outside the error limit of 0.001Å of the method used hence is insignificant. Both bond lengths are at 1.19Å which is consistent with literature value [1]. The total energy of the molecule optimised using 6-31G(d,p) basis set was significantly lower, 0.15305914 a.u. (401.9kJ/mol), than that using 3-21G basis set. This indicated that the use of an improved basis set produced a much more stable BH3 molecule. Like the previous result, the RMS gradient obtained remained small but non-zero. Hence, the molecule obtained is close to but not the most stable form at equilibrium. However, it has to be noted that the total energy of molecule calculated using different basis sets cannot be compared due to the different assumptions and underlying methods used in the calculation. Only calculated value using the same theory, method and basis set can be compared.
| Result Summary | Supporting data | |
|---|---|---|
| File Type | .log | Item Value Threshold Converged?
Maximum Force 0.000012 0.000450 YES
RMS Force 0.000008 0.000300 YES
Maximum Displacement 0.000061 0.001800 YES
RMS Displacement 0.000038 0.001200 YES
Predicted change in Energy=-1.069855D-09
Optimization completed.
-- Stationary point found.
|
| Calculation Type | FOPT | |
| Calculation Method | RB3LYP | |
| Basis Set | 6-31G(d,p) | |
| Charge | 0 | |
| Spin | Singlet | |
| E(RB3LYP) | -26.61532360 a.u. | |
| RMS Gradient Norm | 0.00000707 a.u. | |
| Dipole Moment | 0.00 Debye | |
| Point Group | Cs | |
| B-H Bond Length | 1.19 Å | |
| H-B-H Bond Angle | 120.0o | |
| Job CPU time | 2 minutes 22.0 seconds | |
| LOG File | File:QJL BH3 OPT 631G DP.LOG | |
3. Pseudo-potential: Results for Optimised GaBr3 using LanL2DZ Basis Set
Starting GaBr3 molecule was created using GaussView 5.0 from trigonal planar GaH3 fragment and replacing the H atoms with Br. Optimisation was done for the molecule based on Density Function Theory, using B3LYP method and LanL2DZ basis set without restricting the symmetry group of the molecule. The optimized molecule has Ga-Br bond length of 2.35 Å, Br-Ga-Br bond angle of 120o and D3h point group. The calculated value compares well with the experimental Ga-Br bond length of 2.31 - 2.32Å in a reported NHC-stabilised [GaBr3 (IMes)] complex [2]. A bond length of 2.35Å for GaBr and 2.27Å for GaBr4 reported in [3] indicate that the calculated value is sound. In addition, bond length of Ga-F and Ga-Cl in analogous gallium trihalide compounds were reported to be 1.78Å and 2.18Å respectively [4]. Hence, from the trend of increasing Ga-X bond length down the group, the calculated value should be within reasonable range.
| Result Summary | Supporting Data | |
|---|---|---|
| File Type | .log | Item Value Threshold Converged?
Maximum Force 0.000000 0.000450 YES
RMS Force 0.000000 0.000300 YES
Maximum Displacement 0.000003 0.001800 YES
RMS Displacement 0.000002 0.001200 YES
Predicted change in Energy=-1.282682D-12
Optimization completed.
-- Stationary point found.
|
| Calculation Type | FOPT | |
| Calculation Method | RB3LYP | |
| Basis Set | LANL2DZ | |
| Charge | 0 | |
| Spin | Singlet | |
| E(RB3LYP) | -41.70082783 a.u. | |
| RMS Gradient Norm | 0.00000016 a.u. | |
| Dipole Moment | 0.00 Debye | |
| Point Group | D3h | |
| Ga-Br Bond Length | 2.35 Å | |
| Br-Ga-Br Bond Angle | 120.0o | |
| Job CPU time | 27.6 seconds | |
| LOG File | File:QJL GaBr3 opt LanL2DZ.log | |
| Dspace | DOI:10042/26879 | |
4. Customised Setting: Results for Optimized BBr3
Starting BBr3 molecule was created using GaussView 5.0 from trigonal planar BH3 fragment and replacing the H atoms with Br. Optimization was done for the molecule based on Density Function Theory, using B3LYP method without restricting the symmetry group of the molecule. Due to the presence of both heavy and light atoms in the molecule, the basis set for B and Br were specified separately to ensure the correct use of pseudo-potential and basis set for each atom. B was approximated using 6-31G(d,p) basis set and Br were approximated using pseudo-potential LanL2DZ. The optimized molecule has B-Br bond length of 1.93 Å, Br-Ga-Br bond angle of 120o and Cs point group. The calculated value for B-Br bond length is slightly longer than, but in good agreement with, the experimental value of 1.8995Å from crystallography study [5]and 1.893Å from CRC handbook [3].
| Result Summary | Supporting Data | |
|---|---|---|
| File Type | .log |
Item               Value     Threshold  Converged?
 Maximum Force            0.000018     0.000450     YES
 RMS     Force            0.000010     0.000300     YES
 Maximum Displacement     0.000106     0.001800     YES
 RMS     Displacement     0.000061     0.001200     YES
 Predicted change in Energy=-2.171373D-09
 Optimization completed.
    -- Stationary point found.
|
| Calculation Type | FOPT | |
| Calculation Method | RB3LYP | |
| Basis Set | GEN | |
| Charge | 0 | |
| Spin | Singlet | |
| E(RB3LYP) | -64.43644900 a.u. | |
| RMS Gradient Norm | 0.00000974 a.u. | |
| Dipole Moment | 0.00 Debye | |
| Point Group | Cs | |
| B-Br Bond Length | 1.93 Å | |
| Br-B-Br Bond Angle | 120.0o | |
| Job CPU time | 38.7 seconds | |
| LOG File | File:QJL bbr3 opt gen.log | |
| Dspace | DOI:10042/26886 | |
5. Section Result Discussion
| Bond | Bond Length/Å |
|---|---|
| B-H | 1.19 |
| B-Br | 1.93 |
| Ga-Br | 2.35 |
Comparison of bond distance data
Comparing BH3 and BBr3 molecules, the calculated equilibrium B-H bond length is much shorter than the B-Br bond length in the optimized molecules. H and Br can be both treated as one electron donor X type ligands. Hence the Br3 and H3 fragment orbitals are both made up of three sigma orbitals for bonding to B. Yet, Br has 3 more inner shells of electrons than H. Hence the outer electrons of Br experience less effective nuclear charge and Br consequently have a larger atomic size than H. This contributes towards the longer B-Br bond length. Second, the 4p orbital Br used in bonding to B is much more diffused than the 1s orbital of H. Thus, there is less effective orbital overlap between B and Br which leads to weaker B-Br bond and longer bond length. In addition, the difference in electronegativity between B/Br is much greater than that between B/H. The greater energy gap between valence orbital of B/Br results in less stabilisation of bonding B-Br MOs. This effect also leads to weaker bonding and longer B-Br bond.
Comparing BBr3 and GaBr3, the calculated equilibrium B-Br bond length is much shorter than the Ga-Br bond length in the optimized molecules. Both B and Ga are Group III elements with 3 valence electrons and bonds to Br3 fragment using the same bonding modes. However, as Ga is lower down the group than B, it has a larger atomic size which contributes to longer Ga-Br distance. The more diffused 4s and 4p orbital of Ga used in bonding are more diffused than the 2s and 2p orbitals of Br. This lead to poorer overlap with Br3 fragment orbitals which results to weaker Ga-Br bond and longer Ga-Br bond distance. Additionally, as electronegativity decreases down the group, the difference in electronegativity between Ga/Br is larger than between B/Br. Hence the difference in energy between bonding orbitals of Ga and Br is larger which leads to smaller stabilisation of the resultant MOs. Hence Ga-Br bond is weaker and longer than B-Br bond.
What is a bond?
Graphical bonds shown in Gaussview are only symbolic and do not carry much chemical or physical significance with regards to the nature and magnitude of bonding interactions between atoms. When the structure of a bond is greatly displaced from equilibrium distance such that the distance between two atoms exceeds a threshold value, then Gaussview does not display the bond even if there might still be bonding interactions between the two atoms. Hence, there might still be bonding present between two atoms even when the bond is not graphically displayed in Gaussview.
A bond can be defined as an attractive electrostatic interaction between two atoms. This attractive interaction can be due to the attraction of oppositely charged ions in the case of ionic bonds or can be due to the presence of shared electron density between two nuclei in the case of covalent bonds. This attractive interaction forms when two atoms/ions are close enough together for them to interact electrostatically and the formation of such interaction lowers the energy of the system. Hence, the formation of such energetically favourable interaction keeps the two atoms/ions together and is represented as a bond. Consequently, energy is required to pull the atoms/ions apart by overcoming this attractive interaction, i.e. breaking a bond. A potential energy surface can be used to represent bonding between two atoms. The attractive interaction that forms as the atoms/ions are brought closer together from infinite distance lowers the total potential energy and signifies the formation of a bond. Without other external influences, the two particles will then approach each other closer to maximize the interaction while minimizing repulsion at a given equilibrium distance such that the potential energy is a minimum. At this point, the distance between the two particles is the equilibrium bond distance and there is maximum bonding.
Yet, bonding between the two molecules exist anywhere within the potential energy well of the potential energy surface. Take for example, when thermal energy is high, the two particles can vibrate vigorously such that the distance between them could be lengthened drastically. However, as long as they are still within the potential well, then there is still bonding between them despite the lengthened bond length. There is still preference for the two particles to stay within a certain distance of each other and relaxing to equilibrium structure rather than moving apart to infinite distance. The bond is only weakened significantly. Hence, unlike graphically represented in Gaussview, bond can exist even when the distance between two particles exceeds some pre-determined threshold value in Gaussview. A bond can be broken when there is enough energy to move the particles apart that their potential energy equal to that of the two separate particles at infinite distance. A bond is different from an interaction as, most often the attractive interaction in the form of a bond has dissociation energy much higher than the thermal energy of the surrounding.
Frequency and MO Analysis
1. Frequency Analysis of BH3
| Result Summary | ||
|---|---|---|
| Categories | No symmetry | Restricted to D3h |
| File Type | .log | |
| Calculation Type | FREQ | |
| Calculation Method | RB3LYP | |
| Basis Set | 6-31G(d,p) | |
| Charge | 0 | |
| Spin | Singlet | |
| E(RB3LYP) | -26.61532360 a.u. | -26.61532363 a.u. |
| RMS Gradient Norm | 0.00000700 a.u. | 0.00000291 a.u. |
| Dipole Moment | 0.00 Debye | |
| Point Group | Cs | D3h |
| B-H Bond Length | 1.192 Å | |
| H-B-H Bond Angle | 120.0o | |
| Job CPU time | 6.0 seconds | 9.0 seconds |
| LOG File | File:QJL BH3 FREQ 631G DP.LOG | File:QJL BH3 D3H FREQ.LOG |
Starting from a previously optimized BH3 molecule, frequency analysis was carried out using Density Function Theory, B3LYP method and 6-31G(d,p) basis set i)without restricting the symmetry group and ii) by imposing D3h symmetry on the molecule. For both analyses, the final energy of the molecule is within error range compare to the total energy of molecule obtained from optimization calculation. In addition, there is no negative normal vibration modes which means that the final structure represent a minimum point on the potential energy surface of BH3 molecule. Therefore, the calculated molecule is very close to the true equilibrium structure at this level of analysis. However, comparing the two sets of frequency analysis, without restricting the symmetry group of the molecule produces low frequencies which is outside of the ±15cm-1 range. Whereas by restricting the point group to D3h prior to calculation produced much better result, as shown on the Supporting Data table, and are reported here. Hence, for frequency analysis of subsequent molecules, symmetry restrictions were imposed in each case.
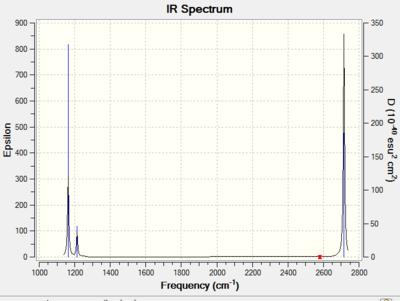
From calculation, the molecule has a total of 6 normal vibration modes. However, only 3 peaks were observed on the calculated IR spectrum. The reduction in actual number of vibrational absorption peak is first due to the presence of two pairs of degenerate vibration modes. The two asymmetric bending modes at 1213cm-1 are degenerate and so as the two asymmetric stretching modes at 2715cm-1. Degenerate vibration modes have the same energy and hence absorb at the same wavelength. In addition, the totally symmetric A1’ vibration mode at 2582cm-1 has zero intensity which means it is not observed on the spectrum. This is because the A1’ mode is IR inactive as it does not result in a change in dipole moment of the molecule. Hence overall, there are only 3 peaks observed on the IR spectrum. The calculated IR peaks and absorption intensity is in agreement with reported values obtained from calculation using the same computational method and basis set.[1]
2. Frequency Analysis of GaBr3
| Result Summary | |
|---|---|
| File Type | .log |
| Calculation Type | FREQ |
| Calculation Method | RB3LYP |
| Basis Set | LANL2DZ |
| Charge | 0 |
| Spin | Singlet |
| E(RB3LYP) | -41.70082783 a.u. |
| RMS Gradient Norm | 0.00000011 a.u. |
| Dipole Moment | 0.00 Debye |
| Point Group | D3h |
| Ga-Br Bond Length | 2.35 Å |
| Br-Ga-Br Bond Angle | 120.0o |
| Job CPU time | 16.5 seconds |
| LOG File | File:QJL GaBr3 freq LanL2DZ.log |
| Dspace | DOI:10042/26900 |
Starting from a previously optimized GaBr3 molecule, frequency analysis was carried out using Density Function Theory, B3LYP method and LanL2DZ pseudo-potential by imposing D3h symmetry on the molecule. The final energy of the molecule is within error range compare to the total energy of molecule obtained from optimization calculation. In addition, there is no negative normal vibration modes which means that the final structure represent a minimum point on the potential energy surface of GaBr3 molecule. In addition, the low frequencies are within the limit of ±15cm-1 range. We can infer that there is little motion in the molecule other than the normal modes of vibration which means there is negligible force acting on the molecule. Therefore, the calculated has produced a molecule with structure that is very close to the true equilibrium structure at this level of analysis. The frequencies of normal vibration modes are tabulated below and the lowest energy normal mode is the degenerate E' asymmetric bending modes at 76 cm-1.
Frequency Comparison
| No. | BH3 | GaBr3 | ||||
|---|---|---|---|---|---|---|
| Frequency/ cm-1 | Intensity | Symmetry | Frequency/ cm-1 | Intensity | Symmetry | |
| 1. | 1163 | 92 | A2" | 76 | 3 | E' |
| 2. | 1213 | 14 | E' | 76 | 3 | E' |
| 3. | 1213 | 14 | E' | 100 | 9 | A2" |
| 4. | 2582 | 0 | A1" | 197 | 0 | A1" |
| 5. | 2715 | 126 | E' | 316 | 57 | E' |
| 6. | 2715 | 126 | E' | 316 | 57 | E' |
As both molecules are trigonal planar with D3h symmetry, they have the same normal vibration modes. In both cases, there are two pairs of degenerate E’ vibration modes and a IR inactive A1” mode. Hence, they both have 3 IR peaks and very similar looking spectra. For both spectra, he A2” and E’ (bend) modes are close in energy as they are both involve bending of bonds and are only different in symmetry. Similarly, the A1” and E’ (stretch) are close in energy as they both involve stretching of the bonds and are only different in symmetry. The stretching modes involve lengthening and compression of the bond while bending involves changes in the relative position of the atoms but has little influence on bond length. As it requires more energy to lengthen a bond by overcoming the attractive forces at equilibrium distance, the stretching modes are almost always higher in energy than the bending modes.
As shown on the comparison table, the vibration frequencies for BH3 are about an order of magnitude larger than corresponding modes of GaBr3. The vibration frequency can be obtained quantum mechanically and is given by the following equation:
Then, frequency of vibration is proportional to the force constant, k, of the vibrating bond and inversely proportional to the reduced mass, μ, of the molecules. Since GaBr3 has a much greater reduced mass than BH3, it is expected to have smaller frequencies of vibration compared to corresponding modes of BH3. In addition, the much smaller frequencies also indicate a weaker Ga-Br bond as compared to B-H bond. This is related to the lower efficiency of orbital overlap of Ga-Br bond as discussed previously in bond length discussion.
Further to the difference in frequencies, there is also a re-ordering of energies of vibration modes. For BH3, the A2” mode is the lowest energy mode followed by asymmetric bending E’ mode. In contrast, the A2” mode is higher in energy than the asymmetric bending E’ mode for GaBr3. From visualisation of the vibration modes, similar motions are observed for the E’ bending modes of both molecules. The A2” mode for BH3 mainly involves the movement of 3 H atoms in/out of the plane of the molecule while the same mode involves swinging of the central Ga atom in/out of the plane for GaBr3. As the A2” mode of BH3 involved little movement of the central B atom, it is less energetic than the E’ modes. Yet, for GaBr3, the A2” mode involves vigorous movement of the heavy central Ga atom in comparison to the E’ modes in which both Ga and Br move moderately. Therefore, the E’ mode of GaBr3 is less energetic than its A2” mode.
Questions about frequency analysis
It is essential to use the same method and basis set for both the optimisation and frequency analysis calculations to get consistent results and ensure that the frequency analysis is relevant for checking the output of optimisation calculation. When different methods or basis set are used, the fundamental assumptions, calculation methods changes. Hence, the computing power changes and we cannot compare two values that are computed based on different assumptions and using different algorithms. As the purpose of frequency analysis is to double check the result of the optimisation calculation, it is useless if a different method or basis set is used.
Frequency analysis is necessary to check whether the structure obtained from optimisation calculation is close enough to the true equilibrium structure at the given level of calculation. This can be done by looking at the low frequencies other than the normal vibration modes. Low frequencies represent small movements in the molecule other than the normal vibration modes. When the molecule is at absolute true minimum point then there should not be any motion associated with the molecule besides the normal vibration modes as there is zero force acting on the molecule. However, given the calculation method, the optimisation is considered completed when the forces is negligible as determined by a pre-set threshold value. Then, the calculated point is very close to but is not actually the true minimum point. This, there will be some movement in the molecule due to very small force still acting on the molecule. This is especially prevalent when the molecule has a flatter gradient/curvature near the minimum point. Then the deviation of calculation from the true minimum point can be significant. In that case, there can be significant movement in the molecule which represents significant deviation from the true minimum point and that the calculation has not achieved a good enough result using the pre-set threshold values. A frequency analysis will be able to provide this information to double check our result. Then we can use int=ultrafine or opt=vtight to adjust these criteria and make the calculation more accurate. Therefore, by checking whether the low frequency is within limit of ±15cm-1 range, we can double check our result and confirm if we have actually obtained a structure close enough to the true equilibrium.
3. MOs of BH3
| Result Summary | |
|---|---|
| File Type | .log |
| Calculation Type | SP |
| Calculation Method | RB3LYP |
| Basis Set | 6-31G(D,P) |
| Charge | 0 |
| Spin | Singlet |
| Total Energy | -26.61532363 a.u. |
| RMS Gradient Norm | 0.00000000 a.u. |
| Dipole Moment | 0.00 Debye |
| Point Group | D3h |
| B-H Bond Length | 1.19 Å |
| H-B-H Bond Angle | 120.0o |
| Job CPU time | 31.8 seconds |
| FCH File | File:QJL BH3 energy 631g nbo.fchk |
| Dspace | DOI:10042/26905 |
NBO analysis of previously optimised BH3 were carried out using Energy calculation with 6-31G (d,p) basis set. The total energy and geometries of the resultant molecule is consistent with the data from optimisation calculation using the same method and basis set. Hence, by cross-referencing, we can conclude that the NBO analysis has been successfully carried out. The MO diagram of BH3 was constructed using LCAO theory and the corresponding MOs obtained from NBO calculation is also shown in the figure below.
The arrangement of the relative energy levels of the real MOs and the LCAO MOs are the same. When using LCAO to construct MO diagram, the energy of the resultant MOs can only be predicted based on the energy levels of the component AOs. Although unable to provide exact positions of the MOs, the relative arrangements of the MOs are consistent with the calculated value. Hence, we can say that for BH3, and possibly analogous molecules, LCAO is fairly useful in predicting the relative energy levels of the MOs. Further to the similarity in relative arrangement of MO energy levels, the general shape/ location of electron density between the LCAO MOs and the calculated MOs are very similar. As reflected on the MO diagram below, LCAO method correctly predicts the distribution of electron density in the molecule. However, when compared to the calculated MOs, it is apparent that the LCAO MOs have highly localised electron density and shown no hybridisation or orbital mixing. In contrast, the calculated MOs shows highly delocalised electron density, throughout the entire molecule, with smooth contours and draw no distinct boundaries between B AOs and H AOs. Additionally, the non-bonding 1a2” orbital which is shown to be highly localised only on C is actually highly diffused and spreads out through the molecule. Although the LCAO MOs shows size of electron density on a given atom by the energies of contributing AOs, the distinction is not as clear in the calculated MOs due to delocalisation of electron density. Thus, the calculated MOs represent more realistic pictures of the delocalised electron density on the molecule than the qualitative LCAO method. Despite the limitation of qualitative LCAO method, it has shown to be very useful in providing a good prediction of the relative arrangement of MO energy levels and of the general distribution of the electron density in the molecule. However, its usefulness is dependent on the complexity of the given molecule. In more complex molecules with increased number of atoms, LCAO can only provide a good understanding of the electron distribution but not the relative energy levels due to high complexity. The usefulness of LCAO method would thus be greatly improved with the support of known experimental data.

4. NBO Analysis of NH3
NH3 was constructed from tetravalent nitrogen fragment using Gaussview. Optimisation and frequency analysis were carried out using Density Function Theory, B3LYP method and 6-31G(d,p) basis set, the same as that used for BH3. For frequency analysis, the int=ultrafine and opt=vtight keyword had to be used in order to obtain low frequencies within ±20cm-1 limit. Int=ultrafine keyword acts to increase the accuracy (‘division’ of the values of gradient) and opt=vtight reduces the default threshold values for gradient. The use of both keywords increases the accuracy of the calculation to find a point even closer to the true minimum point. Convergence of gradient was achieved in optimisation calculation and the final energies of the molecules from optimisation and frequency calculation are within the expected error range and are in good agreement. Since there was no negative normal vibration frequencies and all low frequencies were within the limit of ±20cm-1, we can conclude from the results that all three molecules have been optimized using the given method. In addition, the bond length and bond angle of the optimised molecule agrees with crystallography data [6]. The summarised results and IR spectrum are tabulated below.
| Categories | Optimisation | Frequency | NBO |
|---|---|---|---|
| File Type | .log | ||
| Calculation Type | FOPT | FREQ | SP |
| Key Word | nosymm | int=ultrafine opt=vtight | - |
| Calculation Method | RB3LYP | ||
| Basis Set | 6-31G(D,P) | ||
| Charge | 0 | ||
| Spin | Singlet | ||
| Total Energy | -56.55776856 a.u. | -56.55776872 a.u. | -56.55776856 a.u. |
| RMS Gradient Norm | 0.00000885 a.u. | 0.00000013 a.u. | 0.00000885 a.u. |
| Dipole Moment | 1.85 Debye | ||
| Point Group | C1 | ||
| N-H Bond Length | 1.02 Å | ||
| H-N-H Bond Angle | 105.7o | ||
| Job CPU time | 17.0 seconds | 7.0 seconds | 6.0 seconds |
| LOG File | File:QJL NH3 OPT 631G DP.LOG | File:QJL NH3 FREQ 631G V2.LOG | File:QJL NH3 ENERGY 631G NBO.LOG |
| Supporting Data | |||
| Optimisation | |||
  Item               Value     Threshold  Converged?
 Maximum Force            0.000024     0.000450     YES
 RMS     Force            0.000012     0.000300     YES
 Maximum Displacement     0.000079     0.001800     YES
 RMS     Displacement     0.000053     0.001200     YES
 Predicted change in Energy=-1.629715D-09
 Optimization completed.
    -- Stationary point found.
| |||
| Frequency Analysis | |||
Low frequencies --- -8.2797 -6.5094 -4.3634 -0.0003 0.0004 0.0012 Low frequencies --- 1089.3409 1693.9231 1693.9271 | |||
The symmetry of the molecule was shown as C1 due to slight deviation from the expected C3v point group in bond angles and bond lengths. However, when the error in calculation is taken into consideration, the bond angle is within expectation of a trigonal pyramidal structure. The 105.7o is slightly deviated from the ideal 109.5o of the basic geometry due to the repulsion of N lone pair on the bonding pairs of electrons. By assigning C3v point group to the calculated molecule, the symmetries of the respective normal vibration modes were assigned and tabulated below. There are only two IR bands with absorption strong enough to be observed on the calculated spectrum. These were due to one symmetric bending and a pair of degenerate bending modes. Due to the presence of the N lone pair, the stretching modes have very little effect on the dipole moment of the molecule. Hence, the stretching modes are almost IR inactive as shown by calculation at this level.
NBO Analysis
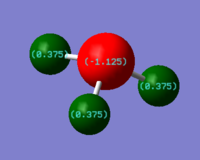
NBO analysis of previously optimised NH3 was carried out and the NBO charges of N and H were determined as – 1.125 and 0.375 respectively. As NBO represents bond delocalised orbitals with maximum electron occupancy, the NBO charges on the atoms are related to the relative contribution of the component AOs towards the bonding orbital between two atoms. The greater the orbital contribution towards a bond, the greater the electron density on the atom and it will consequently have a more negative NBO charge. From the NBO Population analysis, each N-H bond is calculated to have 69% contribution from N and 31% from H which can be used to rationalise the more negative NBO charge on N. Of the bonding orbitals, nitrogen orbital has 25% s character and 75% p character while the H orbital is 100% s character. The lone pair on nitrogen, which contributes towards N’s negative NBO charge, is also located in an orbital with 25% s and 75% p character. Therefore, the valence orbitals of N are sp3 hybridised.
This result is consistent with the trigonal planar geometry predicted using VSEPR theory in which the 4 electron pairs are arranged in a tetrahedral basic structure about N with 4 valence sp3 orbitals. The occupancy of each bonding orbital and the lone pair orbital is very close to 2. This is due to the partitioning of total electron density using NBO method is based on maximising the electron occupancy in each bonding or lone pair orbital. The calculated orbital contribution towards each bond is also consistent with the understanding of MO using LCAO theory. In LCAO, the lower energy AO contributes more towards the bonding MO which consequently means the more electronegative atom will have a greater bonding electron density on it. In this example, N is more electronegative than H hence its orbital contributes more towards the bonding MO and more of the bonding electron density is on N atom. This qualitative analysis is consistent with the NBO calculations in which N orbital contributes more towards N-H bond and has a more negative and has more negative NBO charge.
Association Energy Calculation
| E(BH3)/ a.u. | -26.61532360 |
|---|---|
| E(NH3)/ a.u. | -56.55776856 |
| E(NH3BH3)/ a.u. | -83.22469032 |
| ∆E/ a.u. | -0.05159816 |
| ∆E/ kJmol-1 | -135 ± 10 |
NH3 BH3 was constructed from carbon ethylene fragment using Gaussview. Optimisation and frequency analysis were carried out using Density Function Theory, B3LYP method and 6-31G(d,p) basis set, the same as that used for NH3 and BH3 . Convergence of gradient was achieved in optimisation calculation and the final energies of the molecules from optimisation and frequency calculation are within the expected error range and are in good agreement. Since there was no negative normal vibration frequencies, all low frequencies were within the limit of ±20cm-1 and all geometrical data is in excellent agreement with literature[6], we can conclude from the results that all three molecules have been optimized using the given method. The summarised results and supporting data are tabulated below.
As the optimisations for NH3, BH3 and NH3 BH3 were all done using the same method and basis set, we can use the energies of the optimised structures to estimate the association energy of NH3 BH3 which will be the different between the total energy of NH3 and BH3 and the energy of NH3 BH3 adduct. The association energy is calculated to be -135±10 kJmol-1 at this level of calculation.
| Categories | Optimisation | Frequency | ||
|---|---|---|---|---|
| File Type | .log | |||
| Calculation Type | FOPT | FREQ | ||
| Key Word | nosymm | int=ultrafine | ||
| Calculation Method | RB3LYP | |||
| Basis Set | 6-31G(D,P) | |||
| Charge | 0 | |||
| Spin | Singlet | |||
| Total Energy | -83.22469032 a.u. | -83.22468911 a.u. | ||
| RMS Gradient Norm | 0.00005935 a.u. | 0.00000137 a.u. | ||
| Dipole Moment | 5.56 Debye | |||
| Point Group | C1 | |||
| N-H Bond Length | 1.02 Å | |||
| B-H Bond Length | 1.21 Å | |||
| N-B Bond Length | 1.67 Å | |||
| H-N-H Bond Angle | 107.9o | |||
| H-B-H Bond Angle | 113.9o | |||
| Dihedral Angle | 60.0o | |||
| Job CPU time | 46.0 seconds | 29.0 seconds | ||
| LOG File | File:QJL NH3BH3 OPT 631G DP.LOG | File:QJL NH3BH3 FREQ 631G V2.LOG | ||
| Supporting Data | ||||
 Item               Value     Threshold  Converged?
 Maximum Force            0.000121     0.000450     YES
 RMS     Force            0.000057     0.000300     YES
 Maximum Displacement     0.000508     0.001800     YES
 RMS     Displacement     0.000294     0.001200     YES
 Predicted change in Energy=-1.611643D-07
 Optimization completed.
    -- Stationary point found.
| ||||
| Low frequencies from frequency analysis using "int=ultrafine" keyword | ||||
Low frequencies --- -3.6732 -3.0928 -0.0002 0.0010 0.0012 3.4521 Low frequencies --- 263.3379 632.9595 638.4305 | ||||
Part 2: Ionic Liquid Project
Comparison of Selected 'onium' Cations
1. Optimization and Discussion
N(CH3)4+ and P(CH3)4+ were constructed from carbon tetrahedral fragment and S(CH3)3+ was constructed from a tetravalent nitrogen fragment using Gaussview. Optimisation and frequency analysis were carried out using Density Function Theory, B3LYP method and 6-31G(d,p) basis set for all three cations. Convergence of gradient was achieved in optimisation calculation for all cases. The final energies of the molecules from optimisation and frequency calculation are within the expected error range and are in good agreement. Since there was no negative normal vibration frequencies and all low frequencies were within the limit of ±20cm-1, we can conclude from the results that all three molecules have been optimized using the given method.
| Optimization Result Summary | |||
|---|---|---|---|
| N(CH3)4+ | P(CH3)4+ | S(CH3)3+ | |
| File Type | .log | ||
| Calculation Type | FOPT | ||
| Calculation Method | RB3LYP | ||
| Basis Set | 6-31G(D,P) | ||
| Charge | 1 | ||
| Spin | Singlet | ||
| Keyword | nosymm | ||
| Total Energy | -214.18127257 a.u. | -500.82700318 a.u. | -517.68327862 a.u. |
| RMS Gradient Norm | 0.00004415 a.u. | 0.00002055 a.u. | 0.00000849 a.u. |
| Dipole Moment | 7.33 Debye | 9.85 Debye | 3.175 Debye |
| Point Group | C1 | ||
| Job CPU time | 4 min 2.1 seconds | 7 min 19.8 seconds | 3 min 13.0 seconds |
| LOG File | File:QJL N(CH3)4 OPT 631G DP.log | File:QJL P(CH3)4 OPT 631G DP.log | File:QJL S(CH3)3 OPT 631G DP.log |
| Dspace | DOI:10042/27131 | DOI:10042/27130 | DOI:10042/27129 |
| Frequency Analysis Result Summary | |||
|---|---|---|---|
| N(CH3)4+ | P(CH3)4+ | S(CH3)3+ | |
| File Type | .log | ||
| Calculation Type | FREQ | ||
| Calculation Method | RB3LYP | ||
| Basis Set | 6-31G(D,P) | ||
| Charge | 1 | ||
| Spin | Singlet | ||
| Keyword | int=ultrafine | ||
| Total Energy | -214.18127295 a.u. | -500.82701103 a.u. | -517.68327343 a.u. |
| RMS Gradient Norm | 0.00005051 a.u. | 0.00004314 a.u. | 0.00002019 a.u. |
| Dipole Moment | 7.33 Debye | 9.85 Debye | 3.175 Debye |
| Point Group | C1 | ||
| Job CPU time | 21 min 15.6 seconds | 19 min 58.6 seconds | 8 min 49.6 seconds |
| LOG File | File:QJL N(CH3)4 freq 631G DP.log | File:QJL P(CH3)4 freq 631G DP.log | File:QJL S(CH3)3 freq 631G DP.log |
| Dspace | DOI:10042/27128 | DOI:10042/27127 | DOI:10042/27126 |
| Geometrical Data | |||
|---|---|---|---|
| N(CH3)4+ | P(CH3)4+ | S(CH3)3+ | |
| X-C bond length/ Å | 1.509 | 1.816 | 1.822 |
| C-X-C bond angle/ o | 109.5 | 109.5 | 102.7 |
| Geometry | tetradehral | tetrahedral | trigonal pyramidal |
Both N(CH3)4+ and P(CH3)4+ have tetrahedral geometries about the central heteroatom with calculated C-X-C angle of 109.5o while S(CH3)3+ has trigonal pyramidal geometry about S with calculated C-S-C angle of 102.7o. As N and P are both Group 15 elements, in molecules with general formula [XR4]+, where X is N or P, there are 4 bond pairs about the central atom. Hence, by VSEPR model, they both have tetrahedral geometry. The calculated value of 109.5o C-X-C bond angle is the preferred bond angle for a tetrahedral molecule and is consistent with the VSEPR prediction. Unlike the formal two examples, sulphur is Group 16 element and there are 3 bond pairs and 1 lone pair about the central S atom of S(CH3)3+. By VSEPR theory, the molecule has tetrahedral basic geometry with 1 lone pair occupying one of the vertices which gives an overall trigonal pyramidal structure. The smaller C-S-C bond angle of 102.7o, as compared to the C-X-C angle in previous two examples, is due to the greater electrostatic repulsion of lone pair electrons. This results in the bonding electron pairs being pushed closer towards each other to produce a smaller C-S-C bond angle.
Although N(CH3)4+ and P(CH3)4+ have similar bond angles, the C-N bond distance in N(CH3)4+ is much smaller than the C-P bond distance in P(CH3)4+. As P is lower down the group than N, it has one more inner shell of electrons. Hence the valence electrons of P experience less effective nuclear charge and P consequently have a larger atomic size than H. This contributes towards larger Wan der Vaals radius of P which consequently results in a longer C-P bond. Second, the 3p orbitals P used in bonding to C is much more diffused than the 2p orbitals of N. Given the orbital size mismatching, there is less effective orbital overlap between P and C which leads to weaker C-P bond and longer bond length. In addition, the difference in electronegativity between P and C is much greater than that between N and C. The greater energy gap between valence orbitals of P and C leads to less stabilisation of bonding C-P MOs. This effect also leads to weaker bonding and longer C-P bond. For similar reasons, the C-S bond length of S(CH3)3+ is longer than the C-S bond length.
When rounded up to 3 d.p., the bond length of C-S is similar to but slightly shorter than that of C-P. This is likely due to the greater nuclear charge of S which results in slight contraction and lowering in energy of its 3p orbitals compared to P. This leads to slightly better orbital overlap with C and consequently a shorter C-S bond. Although the difference in bond length is consistent with theoretical prediction, given the accuracy of the method used, it is difficult to judge if the difference in bond length is actually reliable or significant. Then, in this case, further experimental data is required to confirm the calculated result and we cannot conclude a difference in bond length from the calculation.
| Supporting Data | |
|---|---|
| N(CH3)4+ | Item Value Threshold Converged?
Maximum Force 0.000068 0.000450 YES
RMS Force 0.000027 0.000300 YES
Maximum Displacement 0.000272 0.001800 YES
RMS Displacement 0.000098 0.001200 YES
Predicted change in Energy=-8.747990D-08
Optimization completed.
-- Stationary point found.
Low frequencies --- 0.0007 0.0010 0.0011 1.7663 8.5987 8.9104 Low frequencies --- 186.5149 289.9458 290.8594 |
| P(CH3)4+ | Item Value Threshold Converged?
Maximum Force 0.000020 0.000450 YES
RMS Force 0.000008 0.000300 YES
Maximum Displacement 0.000529 0.001800 YES
RMS Displacement 0.000131 0.001200 YES
Predicted change in Energy=-2.690966D-08
Optimization completed.
-- Stationary point found.
Low frequencies --- -2.7436 -0.0020 0.0017 0.0031 6.4193 8.4906 Low frequencies --- 156.0883 191.7009 191.8395 |
| S(CH3)3+ | Item Value Threshold Converged?
Maximum Force 0.000015 0.000450 YES
RMS Force 0.000007 0.000300 YES
Maximum Displacement 0.000631 0.001800 YES
RMS Displacement 0.000200 0.001200 YES
Predicted change in Energy=-9.475318D-09
Optimization completed.
-- Stationary point found.
Low frequencies --- -10.1134 -3.6831 0.0041 0.0043 0.0048 4.1122 Low frequencies --- 161.9920 199.6088 199.7381 |
2. MO and NBO Analysis
NBO analysis for N(CH3)4+, P(CH3)4+ and S(CH3)3+ were carried out using pre-optimised structures. The energies of the molecules from NBO analysis is within ±0.00381a.u. (equivalent to ±10 kJmol-1) of the value from optimisation calculation, the NBO analysis can said to be completed properly. Supporting data from the calculations is shown below.
| NBO Result Summary | |||
|---|---|---|---|
| N(CH3)4+ | P(CH3)4+ | S(CH3)3+ | |
| File Type | .log | ||
| Calculation Type | SP | ||
| Calculation Method | RB3LYP | ||
| Basis Set | 6-31G(D,P) | ||
| Charge | 1 | ||
| Spin | Singlet | ||
| Keyword | pop=full | ||
| Total Energy | -214.18126759 a.u. | -500.82699766 a.u. | -517.68325903 a.u. |
| Point Group | C1 | ||
| Job CPU time | 1 min 18.3 seconds | 1 min 20.0 seconds | 36.3 seconds |
| LOG File | File:QJL N(CH3)4 NBO 631G DP.log | File:QJL P(CH3)4 NBO 631G DP.log | File:QJL S(CH3)3 NBO 631G DP.log |
| Dspace | DOI:10042/27137 | DOI:10042/27138 | DOI:10042/27139 |
MO analysis of N(CH3)4+

.
5 occupied non-core MOs of N(CH3)4+ were selected and annotated based on their bonding characters. The MOs were arranged in order of increasing energy and decreasing bonding character. The yellow arrows indicate direct bonding interactions, green arrows indicate through-space bonding interactions, red arrows indicate through-space anti-bonding interactions and nodal planes were also indicated in white. The bonding in the molecule and MO interactions were rationalised by using –CH3 fragment orbital (FO) and central N atomic orbitals (AO). The –CH3 were approximated using NH3 MOs as shown on Figure 4. Diagrams of MOs and their descriptions are all included in Figure 5.

Comparison of charge distributions and NBO population analysis
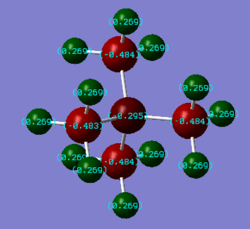
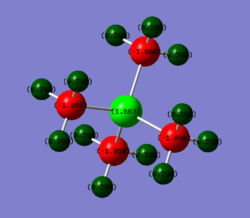
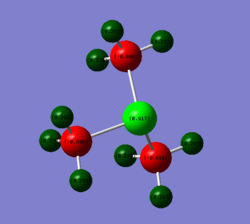
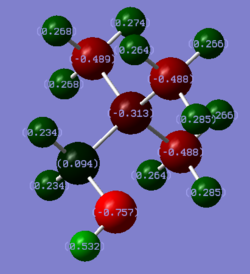
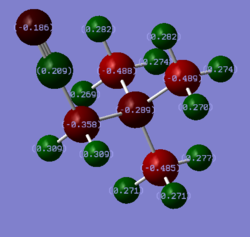
Among the three cations, N(CH3)4+ is the only one which has a negative NBO charge on the central heteroatom N. Both P(CH3)4+ and S(CH3)3+ have positively charged central atom P and S. The difference in NBO charge between N and P or S is much larger than the difference between P and S. The difference in NBO charge of the central heteroatom can be rationalised based on their electronegativity. The more electronegative the atom, the more effective nuclear charge the valence electron will experience and the valence electrons will be lower in energy. Therefore, it is more favourable to have greater electron density on a more electronegative atom. When compared to the electronegativity of C, which is directly bonded to the heteroatom, only N is more electronegative than C. Hence, the C-N bond is polarised with more electron density on N which gives N negative NBO charge. Both P and S are less electronegative than C thus both P-C and S-C bonds have greater electron density on C. Therefore, both P and S have positive NBO charge. The NBO charge of P is slightly more positive than S as S is more electronegative than P. In addition, S has a lone pair of electron which also results in its NBO charge being less positive than P. The overall trend can also be rationalised from a LCAO point of view. Bonding MOs will have greater contribution from the lower energy component AO. Since the energy of the valence AO depends on the electronegativity of the atom, the more electronegative atom will contribute more towards the bonding C-X NBO and a greater electron density on it. This reasoning arrives at the same conclusion as the previous.
Across the trio of cations, C is always the one with the most negative NBO. This is because C is also bonded to three H atoms which are more electropositive than C. Hence, there are much electron density localised on C atom. Even in the case of N(CH3)4+, we would expect N to be the most negatively charged. Yet, due to each C has much electron density from 3 C-H bonds, it carries more negative NBO charge than N. The magnitude of NBO charge of C increases from N(CH3)4+ < P(CH3)4+ < S(CH3)3+ due to the decrease in electronegativity of the respective central atom as discussed previously. The C-H bond is polarised with most electron density on C due to reasons discussed before. Hence, the H atoms in all three cations always carry positive NBO charge due to it being bonded to more electronegative C. There is slight increase of H NBO charge from N cation to P/S cation due to the C being more negatively charge.
The contribution of C towards the C-X bond increases in the order P-C < S-C < N-C as shown on the table above. Looking at the NBO charge of C, it becomes more negative as the contribution of C orbital towards the C-X bond becomes greater. This result is consistent with the reasons explored in explaining the trend in charge distribution across the trio of cations. The greater the orbital contribution towards a bond, the greater the electron density on that atom and hence the more negative the NBO charge on the atom.
Discussion on formal charge
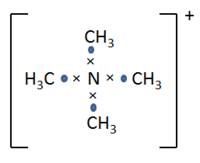
Traditionally, the positive charge of N(CH3)4+ is deemed to be localised on N atom. When we construct the molecule using Lewis structure, the N(CH3)4+ molecule is drawn such that there are 4 C-N bonds with 1 electron each from N and C as shown on Figure 6. As N has 5 valence electrons and is unable to expand octet, one electron needs to be lose from the N atom to form a complete octet when we construct the Lewis structure of this molecule. As the formal charge is defined as the difference in the number of electron in the Lewis structure and in neutral atom, the positive charge is localised on N in the traditional picture.
In MO theory, however, molecular orbitals represent electron densities which are delocalised over the entire molecule. Then the total 32 electrons of the cation fill a series of MOs which are delocalised over the entire molecule. This gives an entirely different picture of bonding when compared to the bond localised structure in the traditional Lewis structure way of describing chemical bonding. As the MOs are built from the contributing AOs in such a way that the lower energy AOs contributes more towards bonding MOs, more electronegative atoms of the molecule will have greater orbital contribution towards the bonding MOs. When bonding MOs are filled according to Aufbau principle, the more electronegative atoms of the cation will have greater electron density and a more negative charge. Therefore, as we observed in this case, the positive charge on N(CH3)4+ is actually distributed and located over all the H atoms. This differs from the traditional prediction in which the positive charge is delocalised on the N atom. The quantum mechanical basis behind the MO calculations paints a more accurate picture of the system as this description ensures that the final electronic structure is an energy minimum. A minimum energy electronic structure achieves maximum stabilisation of the system, therefore, is a much more accurate way of describing the system. In contract, the traditional description does not take into consideration the energy of the system and only offers limited ability in understanding bonding in molecule. Despite the inaccuracy of the traditional description of chemical bonds, it is still useful in helping us visualise bonds, understand molecular geometry and resonance structures.
Influence of Functional Group
1. Optimization
N(CH3)2(CH2OH)+ and N(CH3)2(CH2CN)+ were modified from optimised N(CH3)4+ using Gaussview. Optimisation and frequency analysis were carried out using Density Function Theory, B3LYP method and 6-31G(d,p) basis set for both cations. Convergence of gradient was achieved in optimisation calculation for all cases. The final energies of the molecules from optimisation and frequency calculation are within the expected error range and are in good agreement. Since there was no negative normal vibration frequencies and all low frequencies were within the limit of ±20cm-1, we can conclude from the results that optimisation has been achieved at the given level of calculation.
| Optimization Result Summary | ||
|---|---|---|
| N(CH3)2(CH2OH)+ | N(CH3)2(CH2CN)+ | |
| File Type | .log | |
| Calculation Type | FOPT | |
| Calculation Method | RB3LYP | |
| Basis Set | 6-31G(D,P) | |
| Charge | 1 | |
| Spin | Singlet | |
| Keyword | nosymm | |
| Total Energy | -289.39322212 a.u. | -306.39376818 a.u. |
| RMS Gradient Norm | 0.00001703 a.u. | 0.00000336 a.u. |
| Dipole Moment | 6.885 Debye | 9.46 Debye |
| Point Group | C1 | |
| Job CPU time | 8 min 58.9 seconds | 9 min 33.2 seconds |
| LOG File | File:QJL N(CH3)3(CH2OH) OPT 631G DP.log | File:QJL N(CH3)3(CH2CN) OPT 631G DP.log |
| Dspace | DOI:10042/27152 | DOI:10042/27153 |
| Frequency Analysis Result Summary | ||
|---|---|---|
| N(CH3)2(CH2OH)+ | N(CH3)2(CH2CN)+ | |
| File Type | .log | |
| Calculation Type | FREQ | |
| Calculation Method | RB3LYP | |
| Basis Set | 6-31G(D,P) | |
| Charge | 1 | |
| Spin | Singlet | |
| Keyword | int=ultrafine opt=vtight | int=ultrafine |
| Total Energy | -289.39321802 a.u. | -306.39376173 a.u. |
| RMS Gradient Norm | 0.00002916 a.u. | 0.00002269 a.u. |
| Dipole Moment | 6.885 Debye | 9.46 Debye |
| Point Group | C1 | |
| Job CPU time | 23 min 21.8 seconds | 26 min 4.9 seconds |
| LOG File | File:QJL N(CH3)3(CH2OH) freq 631G DP.log | File:QJL N(CH3)3(CH2CN) freq 631G DP.log |
| Dspace | DOI:10042/27281 | DOI:10042/27154 |
| Supporting Data | |
|---|---|
| N(CH3)2(CH2OH)+ | Item Value Threshold Converged?
Maximum Force 0.000076 0.000450 YES
RMS Force 0.000009 0.000300 YES
Maximum Displacement 0.000281 0.001800 YES
RMS Displacement 0.000096 0.001200 YES
Predicted change in Energy=-1.137660D-08
Optimization completed.
-- Stationary point found.
Low frequencies --- -8.0202 -3.3087 -0.0010 -0.0010 -0.0007 1.0663 Low frequencies --- 131.2509 214.3524 255.7399 |
| N(CH3)2(CH2CN)+ | Item Value Threshold Converged?
Maximum Force 0.000006 0.000450 YES
RMS Force 0.000001 0.000300 YES
Maximum Displacement 0.000311 0.001800 YES
RMS Displacement 0.000077 0.001200 YES
Predicted change in Energy=-1.030754D-09
Optimization completed.
-- Stationary point found.
Low frequencies --- -5.7675 -1.5435 -0.0011 -0.0010 -0.0009 5.4260 Low frequencies --- 91.7360 153.9903 211.7272 |
2. MO and NBO Analysis
NBO analysis for N(CH3)2(CH2OH)+ and N(CH3)2(CH2CN)+ were carried out using optimised structures. The energies of the molecules from NBO analysis is within ±0.00381a.u. (equivalent to ±10 kJmol-1) of the value from optimisation calculation, the NBO analysis can said to be completed properly. Supporting data from the calculations is shown below.
| Optimization Result Summary | ||
|---|---|---|
| N(CH3)2(CH2OH)+ | N(CH3)2(CH2CN)+ | |
| File Type | .log | |
| Calculation Type | SP | |
| Calculation Method | RB3LYP | |
| Basis Set | 6-31G(D,P) | |
| Charge | 1 | |
| Spin | Singlet | |
| Total Energy | -289.39322212 a.u. | -306.39376818 a.u. |
| Dipole Moment | 6.885 Debye | 9.46 Debye |
| Point Group | C1 | |
| Job CPU time | 1 min 0.6 seconds | 1 min 12.9 seconds |
| LOG File | File:QJL N(CH3)3(CH2OH) NBO 631G DP.log | File:QJL N(CH3)3(CH2CN) NBO 631G DP.log |
| Dspace | DOI:10042/27405 | DOI:10042/27406 |
Effect on charge distribution
Overall, in both cases, the positive charge of the cations are largely localised on the H atoms and the carbon bonded to heteroatom other than the central N. For N(CH3)2(CH2OH)+, the most negatively charged is the oxygen atom and the hydroxyl H being the most positively charged. Compared to N(CH3)4+, one of the carbon is now positively charged in N(CH3)2(CH2OH)+. While for N(CH3)2(CH2CN)+, the most negatively charged are still the C bonded to the central N atom as for N(CH3)4+.
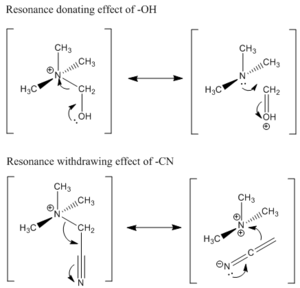
The NBO charge of central N atom, when compared to N(CH3)4+, became more negative by ~6% for N(CH3)2(CH2OH)+ and less negative by ~2% for N(CH3)2(CH2CN)+. As discussed earlier that the NBO charge is closely linked to the electron density on a given atom, then the change in N NBO charge shows that the electron density on N increases in the presence of electron donating group (EDG) –OH and decreases in the presence of electron withdrawing group (EWG) –CN. This is an interesting aspect as the functional groups are able to influence the central N atom despite being located two bonds away. This is due to the –OH and –CN groups operating through resonance electron donation and electron withdrawing effect respectively. Using arrow pushing, the resonance structures of the two cations are shown in Figure 7. We can see that in the extreme cases of resonance structure, N(CH3)2(CH2OH)+ can be drawn as an oxonium ion and a tertiary amine while N(CH3)2(CH2CN)+can be draw as an N-analogue of ketene and a doubly charged N cation. From this resonance picture, we can visualize the electron donating effect of –OH and electron withdrawing effect of –CN on central N atom. A more realistic picture of the molecule is somewhere in between the two extreme resonance forms with the EDG/EWG effect reflected in the relative electron density or NBO charge of the central N atom. Due to this resonance effect on electron density, there is very little effect on the electron density of the other 3 Cs as inferred from the resonance structure. Indeed the charge density of C not bonded to functional group did not show any definite trend among these three cations. If inductive electron donation/withdrawing effect is in operate, then the C atoms would also be slightly affected. Since there is no apparent trend, the calculated values support the proposal that –OH and –CN both operates through resonance.
It was observed that both the –OH and –CN groups increases the NBO charge of the C atom directly bonded to them. In the case of N(CH3)2(CH2OH)+, the increase in NBO charge is so drastic that the C becomes positively charged. Although it was mentioned previously that –OH is an electron donating group, the functional group is electron withdrawing with respect to the carbon directly bonded to oxygen due to inductive effect. As oxygen atom is more electronegative than C, the C-O bond has mainly contribution from oxygen. This can be confirmed by NBO population study data in which the contribution of C and O towards the C-O bond is 34.2% and 65.8% respectively. Therefore, the C(-OH) carbon is positively charged compared to when there’s no functional group. For N(CH3)2(CH2CN)+, the increase in the C(-CN) atom is much smaller. From the resonance structure drawing, there is almost no change in the electron density or charge of this carbon atom. Therefore, like previous case, the decrease in magnitude of negative NBO charge can be attributed to the inductive effect of the electronegative N atom. As inductive effect is distance dependent, the effect of N atom on the C(-CN) atom is small. In comparison, the nitril C is positively charged due to N being directly bonded to it which greatly reduces the electron density on this C significantly. This is also reflected in orbital contribution in which nitril C contributes on average 46% towards the C-N triple bond. Comparing the C(-OH) and nitril carbon, one might expect the C(-OH) to be more positively charged as O is more electronegative than N. However, there are two electropositive H bonded to C(-OH). Hence, the overall effect is that the nitril carbon being more positively charged than C(-OH).
Comparison of HOMO-LUMO and Discussion on reactivity
| Cation | N(CH3)4+ | N(CH3)2(CH2OH)+ | N(CH3)2(CH2CN)+ |
|---|---|---|---|
| HOMO | 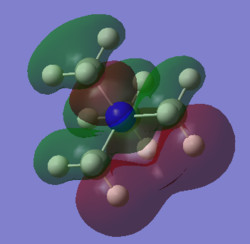 |
 |
 |
| LUMO | 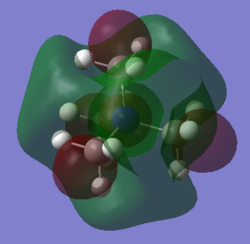 |
 |
 |
| HOMO energy/ a.u. | -0.57931 | -0.46629 | -0.50048 |
| LUMO energy/ a.u. | -0.13303 | -0.11993 | -0.18184 |
| HOMO-LUMO gap/ kJmol-1 | 1172 | 909 | 837 |
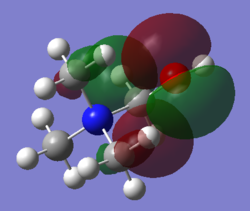
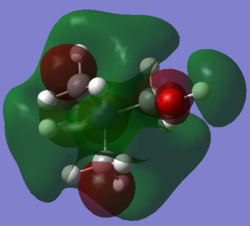
The shape of HOMO has changed drastically going from N(CH3)4+ to N(CH3)2(CH2OH)+ and N(CH3)2(CH2CN)+. For N(CH3)4+, electron density of the HOMO is well distributed over the entire molecule. However, for both N(CH3)2(CH2OH)+ and N(CH3)2(CH2CN)+, the HOMO electron density is highly localised in the region slightly more than 1 bond length away from the functional group. We can see that the HOMO of N(CH3)2(CH2OH)+ is composed of mainly the lone pair on oxygen and –CH2 FO adjacent to it. In comparison, the HOMO of N(CH3)2(CH2CN)+ is composed mainly of the πC≡N bond and –CH2 FO adjacent to it. As reactivity related to electron donation from a molecule originate mainly from the HOMO electron density, then we can deduce from the calculated HOMOs that O lone pair and C≡N π bond will be the nucleophilic center on N(CH3)2(CH2OH)+ and N(CH3)2(CH2CN)+ respectively. As the HOMO of N(CH3)4+ is delocalised over the entire molecule hence, in contrast to the two substituted cations, it is likely to have no specific nucleophilic reactivity
Other than the shape of the HOMO, the HOMO energy is also directly related to the reactivity of the molecule as nucleophile. Given that most organic reactions involves the overlap of HOMO of nucleophile and LUMO of electrophile and that orbital interaction is greatest when there is small energy difference between interacting orbitals, then the higher the energy of the HOMO of nucleophile, the more reactive it is. Comparing the three cations, the energy of HOMO increases from N(CH3)4+ << N(CH3)2(CH2CN)+ < N(CH3)2(CH2OH)+. Therefore, we would expect nucleophilic reactivity to also increase from N(CH3)4+ << N(CH3)2(CH2CN)+ < N(CH3)2(CH2OH)+. The difference in HOMO energy can be rationalised in terms of the nature of the HOMO. The HOMO of < N(CH3)2(CH2OH)+ is essentially non-bonding O lone pair which is expected to have higher energy than HOMO with bonding HOMO such as that of N(CH3)4+ and N(CH3)2(CH2CN)+. Comparing the HOMO of N(CH3)4+ and N(CH3)2(CH2CN)+, there is much greater bonding character in the HOMO of N(CH3)4+. Therefore, the energy of N(CH3)2(CH2CN)+ is greater than that of N(CH3)4+.
The shape of LUMOs shares more similarities among N(CH3)4+, N(CH3)2(CH2OH)+ and N(CH3)2(CH2CN)+. Disregarding the electron density on the functional groups, the shape and nature of the LUMO is essentially the same for the core region for all three cations. The main difference upon substitution is the additional anti-bonding electron cloud that is projected outward from the central electron density. This anti-bonding lobe originates from the anti-bonding σ*O-H bond for N(CH3)2(CH2OH)+ and the π*C≡N bond for N(CH3)2(CH2CN)+. The presence of these large outward-leaning anti-bonding orbital would allow the molecule to be attached by a nucleophile with little steric hindrance thus conferring these two cations electrophilic reactivity.
Similar to previous argument, the LUMO energy is also directly related to the reactivity of the molecule as nucleophile. In this case, the lower the energy of the LUMO of a electrophile, the more readily it accepts electron and more reactive it is. Comparing the three cations, the energy of LUMO decreases from N(CH3)2(CH2OH)+ > N(CH3)4+ > N(CH3)2(CH2CN)+ . Therefore, we would expect electrophilic reactivity to increase from N(CH3)2(CH2OH)+ < N(CH3)4+ < N(CH3)2(CH2CN)+. The difference in HOMO energy can be rationalised in terms of the nature of the bond delocalised orbitals making up the LUMO. The energy of the ability of an orbital depends on the type of bond and the electronegativity of the bonding atoms. The main orbital that can accept electron is σ*C-N, σ*O-H and π*C≡N for N(CH3)4+, N(CH3)2(CH2OH)+ and N(CH3)2(CH2CN)+ respectively. The energy of anti-bonding orbital decreases in the presence of electronegative atoms and is lower for π* orbitals. Hence, π*C≡N is the best acceptor orbital followed by σ*C-N then σ*O-H. This prediction is consistent with the trend in the energy of the LUMOs across this series of cations.
Lastly, the size of the HOMO-LUMO gap also affects the reactivity of the cations. The smaller the HOMO-LUMO gap, the greater the reactivity as it is easier to promote electron to LUMO to accommodate certain reactions. From the calculations, it was shown that both EWG and EDG decreases HOMO-LUMO gap and consequently increases reactivity of the molecule. Overall, the HOMO-LUMO gap decreases from N(CH3)4+ > N(CH3)2(CH2OH)+ > N(CH3)2(CH2CN)+. Therefore, we would expect overall reactivity to increase from N(CH3)4+ < N(CH3)2(CH2OH)+ < N(CH3)2(CH2CN)+. The reactivity of the two substituted essentially stem from the functional group themselves due to the shape of the HOMO and LUMO which are involved in reactivity.
Reference
- ↑ 1.0 1.1 Computational Chemistry Comparison and Benchmark Database. [[1]]
- ↑ Graham E., Marcus L. and Alasdair I., Dalton Trans, 2012, 41, 946
- ↑ 3.0 3.1 CRC Handbook Cite error: Invalid
<ref>tag; name "CRC" defined multiple times with different content - ↑ Kuchitsu (ed.), Landolt-Bornstein: Group II: Atomic and Molecular Physics Volume 21: Structural Data of Free Polyatomic Molecules. Springer-Verlag, Berlin, 1992
- ↑ G. Santiso-Quinones and I. Krossing, Z. Anorg. Allg. Chem., 2008, 634, 704
- ↑ 6.0 6.1 Tapas Kar and Steve Scheiner, J. Chem. Phys., 2003, 119, 1473.


