Rep:Mod:jhbp3
Appearance
Comp. Lab. Spring 2009 - Module 3 - The Transition State - James H Bannock (CID:00468630)
Cope Rearrangement
Optimising the Reactants and Products
a) Hexa-1,5-diene (anti)
- As instructed hexa-1,5-diene was drawn with an anti-periplanar arrangement about the central two carbons. The structure was then cleaned, this had the effect of ordering the molecule to reduce steric clashing.
- The structure was then optimised using a Hartree-Fock calculation with the 3-21G basis set (valid from atoms H-Xe). The initial resulting structure was then symmetrized using the tool in GuassView.
- The summary of results is shown below in Figure 1.
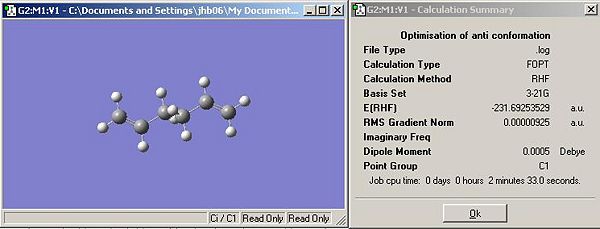
- This structure has been determined to have Ci symmetry (from the structure window). Comparison of the ground state energy to literature data provided in the appendix proves that the structure is indeed the Ci structure. This structure eqautes to anti-2 in Appendix 1 of the lab script.
b) Hexa-1,5-diene (gauche)
- As before a structure of hexa-1,5-diene was drawn but this time the structure was drawn with a gauche arrangement about the central two carbons. The structure was optimised using the same methods as the anti conformation. The results are shown in Figure 2, below.
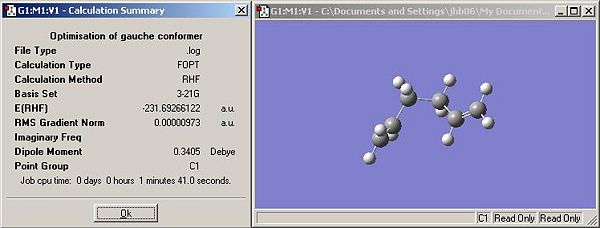
- The optimised structure has a C1 point group, however there are known to be 3 C1 structures (Appendix 1). Comparison of the energy and the conformation indicates that the optimised structure is gauche-3 in Appendix 1.
c) Improvements
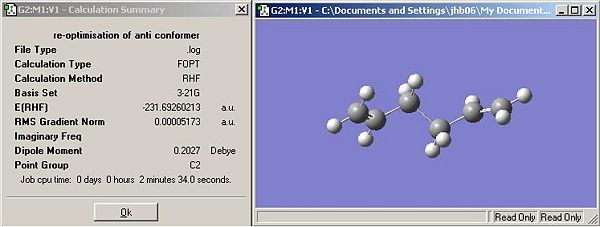
- Anti-conformer: The conformation of the optimised structure would imply the lowest energy conformation as the olefins are on opposite sides of the central C-C bond. This assumption is based on steric arguments only. There could be some stabilisation between olefins (electronically) if they were in adjacent to each other. This resulted in the lowest energy conformer being found, Figure 3 (below). This matches that of anti-1 in Appendix 1. The structure has C2 symmetry (higher than that of the initial optimisation).
- Gauche-conformer: the is no logical improvement to this structure as there is minimal steric interaction. Any change in the structure will lead to an increase in energy caused by an increase in steric and pi-bond (electronic) clashing.
d) B3LYP/6-31G(d)
- The anti-2 structure was then further optimised with the DFT method, B3LYP. The basis set was also improved to the 6-31G(d) level. The improvement in basis set takes into account the 3d orbitals on the carbons. Not that it affects anything but the 6-31G is accurate over an increased range H-Kr. The Gaussian output is shown below in Figure 4.

- Comparing these result to those from the HF/3-21G calculation it is clear that the DFT method gives a lower energy structure but the symmetry is definitively Ci as defined in the summary. This is confirmed by the dipole moment which is zero in the DFT result whereas it is 0.0005Debye indicating the structure is not exactly Ci.
e) Frequency Analysis
- Using the B3LYP/6-31G(d) checkpoint file the calculation was re-run as a frequency calculation under the same basis set. The results do not include any negative frequency vibration indicating that the structure is fully optimised. There were 42 vibrations in total, 21 of which are symmetrical and are therefore not IR active. The calculated spectrum is shown in Figure 5.

- Comparing this structure to literature[1] it is clear that this state is not the most favoured. There are similarities for the C-H modes but the C-C stretches there is an obvious difference. This is expected as the gauche conformer was predicted to be the lower energy conformer using HF/3-21G calculations earlier.
f) Thermochemistry
- From the Gaussian output file the following data was extracted:
| Energy Type | Energy / Hartree |
|---|---|
| Sum of electronic and zero-point Energies | -234.469197 |
| Sum of electronic and thermal Energies | -234.461848 |
| Sum of electronic and thermal Enthalpies | -234.460904 |
| Sum of electronic and thermal Free Energies | -234.500781 |
| Energy Type | Energy / Hartree |
|---|---|
| Sum of electronic and zero-point Energies | -234.468760 |
| Sum of electronic and thermal Energies | -234.461421 |
| Sum of electronic and thermal Enthalpies | -234.460477 |
| Sum of electronic and thermal Free Energies | -234.500331 |
Optimising the Boat and Chair Transition Structures
a) Optimisation of the allyl unit
- The allyl unit was built in GaussView using 1.5 bond order between carbon atoms.
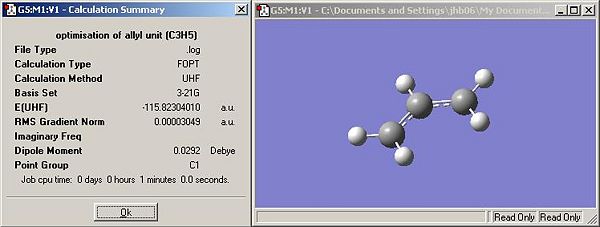
- The optimised structure is approximately C2v symmetry (using symmetrise function in GaussView)
b) Initial Transition State Guess (chair)
- The optimised allyl unit (above) was copied twice into a new GaussView MolGroup and the units aligned to resemble the chair conformation of cyclohexane. The distance between adjacent terminal carbon atoms on each unit was set to 2.2Å by manipulation of one unit relative to the other.
- The a Gaussian calculation was then set up. In this instance it was required to optimise the structure to a transition state (Berny) and calculate the vibration frequencies (occurance of a single negative frequency in the vibrational spectrum defines the structure to be a transition state). The calculation was run using the Hartree-Fock method and the 3-21G basis set. Additionally "Opt=NoEigen" was added to ensure stop Gaussian from crashing.
- The optimised structure, Figure 7, looked much the same as the input structure except the distance between adjacent terminal carbons on each unit had been reduced from 2.20Å to 2.02Å.
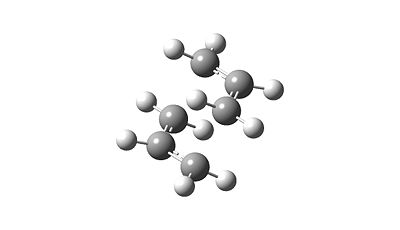
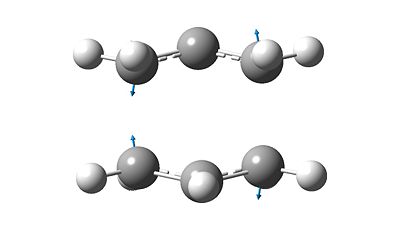
- Analysis of the vibrations shows one distinct negative frequency at -817.9cm-1 clearly indicating that the structure was a transition state.
- The vibrational mode is shown below in Figure 8, the direction vectors indicate that the adjacent terminal carbon pairs oscillate as if they were bonds with there equilibrium position at the transition state structure. It can also be observed the two effective stretching modes are out-of-phase with each other.
c) 'Frozen Coordinates' method (chair)
- To improve the accuracy of the transition state structure obtained the optimisation can be split in half. In the previous optimisation all parameters could be optimised. However, a far more accurate method is to hold the terminal carbons of the allylic units still whilst optimising the rest of the structure relative to the stationery atoms, known as the 'Frozen Coordinates' method.
- It has been stated that the optimum distance between adjacent terminal carbons is 2.2Å and it was previously observed that optimisation reduced that to ~2Å. Using the Redundant Coordinate editor it was possible to intially hold this distance constant at 2.2Å and optimise the remainder of the structure.
- The Redundant Coordinate editor allow one to select two atoms and freeze the coordinate (i.e. they wont move relative to each other during the optimisation). It is important to specify that the although the intercarbon gap be defined as a bond, after all this is what is about to happen.
- The optimisation was then run using the same method as before, a HF/3-21G calculation.
d) Re-optimisation (chair)
- Using the results (.chk) from c) it was then possible to release the 'frozen' atoms from this constraint and re-define the distance as a 'derivative' in the editor. The derivative is selected as a bond is not wanted in the transition state, more the possibility of a bond, or a 'derivative' of a bond.
- As with the previous transition state optimisation the calculation was run using the Hartree-Fock method and 3-21G basis set. The stucture was optimised to a transition state (Berny) and vibrational data computed simultaneously. In order for this calculation to run it is important that the opt=noeigen be added again. This stops Gaussian crashing when it finds a negative vibrational frequency.
- The optimised structure is shown below in Figure 9. The structure is very similar to the that obtained from the initial guess. The imaginary frequency was observed at -817.8cm-1.
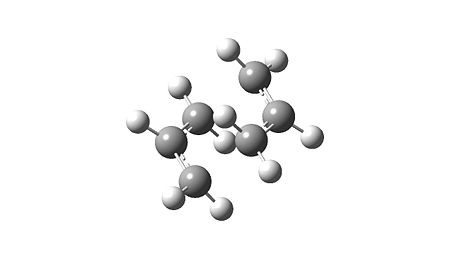
- Comparison Gaussian output of the two structures reveals few differences, however the differences observed are quite fundemental. The results from the initial guess show a dipole moment of 0.0004Debye whereas the latter method does not have a dipole moment. Qualitatively one would not expect a dipole momennt to be observed due to the nature of the fragments under investigation so the second method is more accurate in that sense. The only other difference is the energy, the initial guess is insignificantly lower in energy, 0.18J/mol.
- It is deemed that the result with no dipole moment is the more accurate.
e) QST2 method (boat)
- Before optimising the boat structure using the QST2 method, the chair structure was trialed.
- The calculation set up is crucial for this method. Initially two screens must be created in one molgroup, one representing the initial state and the second representing the change after transition. The method employed aims to bring the two structures together to find the transition state. The optimised Ci chair structure was imported into both screens and then the atom labels were carefully manipulated to represent the cope rearrangement. This meant that the terminal carbons in the inital state could be tracked to the central carbons in the final state. The labelled structures are shown below in Table 3.
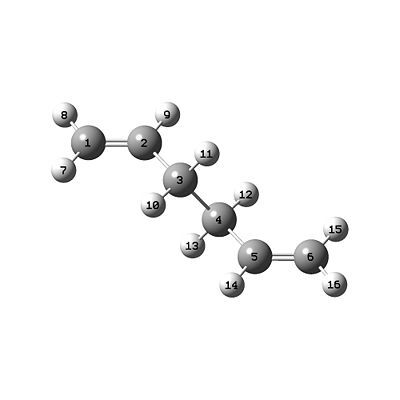 |
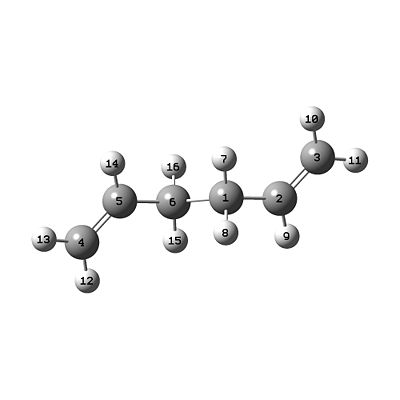 |
| Initial State | Final State |
- The Gaussian calculation was set up to run an optimisation to the transition state (QST2) and consecutive vibrational analysis. The Hartree-Fock method was again employed with the 3-21G basis set.
- As expected the Gaussian calculation failed. Analysis of the output file
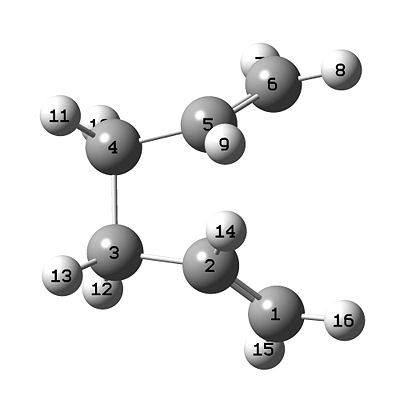
- In order to obtain a transition state the optimised chair structure must be modified to the boat structure. The dihedral of the olefin to the central carbon pair was modified to bring the two olefins to the same side of the central carbon pair. The angle which the pentultimate carbon in the chain made with the central carbon pair was modified on each end to 100°. The structure then resembled the stereotypical disfavoured boat structure (minus a bond between the terminal carbons). The only modification to the boat structure was that the olefins point away from each other rather than being parallel.
- As before with the chair calculation, two structures were set into one molgroup to represent a before and after [cope] structure. The atoms were labelled to represent the cope rearrangement, changes were made in such a way that the only apparent change was the carbon bond breaking and making process. The two structures are shown below in Table 4.
 |
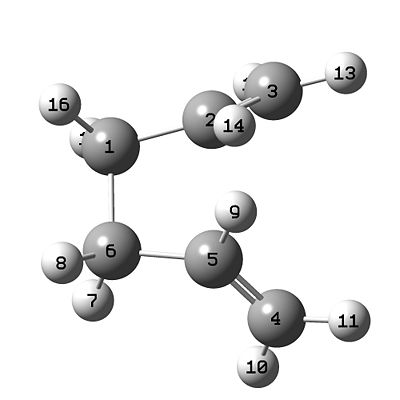 |
| Initial State | Final State |
- The structure was then optimised to a transition state (QST2) and vibrational analysis was conducted. The resulting structure is shown below in Figure 10.
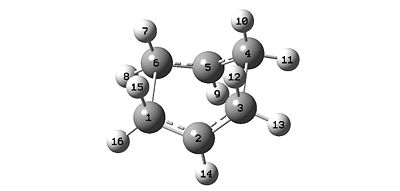
- Analysis of the vibrational data reveals only one negative frequency, an imaginary frequency, at -839.8cm-1.
f) IRC method
- The Intrinsic Reaction Coordinate (IRC) method allows the reaction coordinate to be computed. If the IRC method is used on the optimised transition state structure it is then possible to determine which of the hexa-1,5-diene conformers the transition state originates from (Note: it is not possible to determine this by looking at the chair transition state structure, it must be identified by some means!).
- Initally the IRC calculation was set up using the optimised (HF/3-21G) structure resulting from the frozen coordinates method of optimisation. The Gaussian calculation was setup to run an IRC on 50 positions and to only compute force constants once (at start). The calculation was run at the same level as the previous optimisation, HF/3-21G.
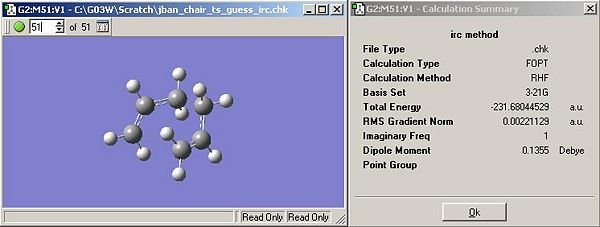
- Figure 11 shows the lowest energy structure from the IRC results. However, analysis of the IRC curve (away from TS) suggests that a minimum has not been reached, Figure 12 (below).
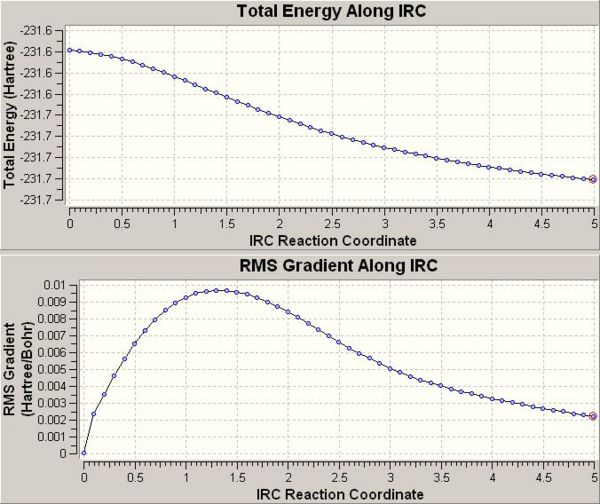
- Improvements include optimising the above structure, doing an IRC calculation over a larger number of points or computing force constants at each point.
- All of these methods were tried. The first two worked, however the latter method failed to achieve any results (Gaussian crashed about an hour into the calculation).
- Optimising the lowest energy structure from the intial IRC is shown below in Figure 13 along with the energy of the structure.

- Increased IRC points leads a more acceptable minimum on the IRC gradient, in this calculation the number was increased two fold, to 100.
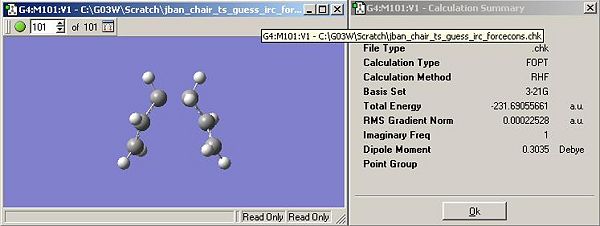
- Analysis of the IRC curve, Figure 15, shows that the final structure (101) is just at a minimum. The final point just about hits 0 on the RMS curve indicating no further change in energy.
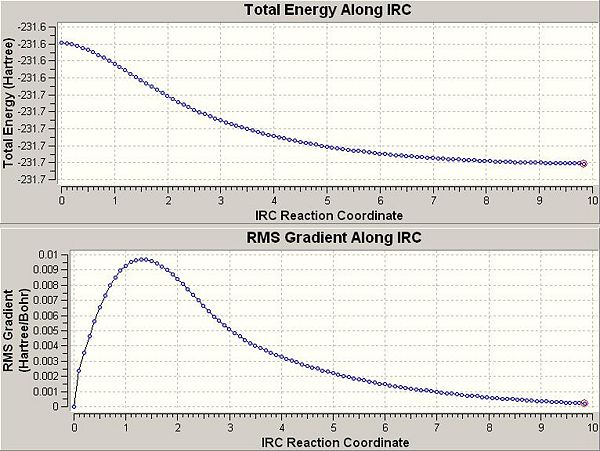
- Both these results indicate the same structure which is the same as anti-2, so it can be concluded from this analysis that the anti-2 conformer is the conformer which results in the chair transition state being formed.
g) Activation Energies
- Both transition structures form from the anti-2 conformer. The boat transition structure arises from twisting of this structure (QST2 calculations). The anti-2 conformer has been deemed the origin of the chair conformation by IRC analysis.
- In order to calculate the activation energies the optimised transition structures must be compared to the anti-2 conformer. To be able to compare the structures the sum of electronic and thermal (or zero point at 0K) energies must be used.
- This data can be found in the Thermochemistry section of the Gaussian output file from the frequency calculations. For the 0K structures the energy quantity has been computed using the FreqChk utility in Gaussian. This provided a correction factor which could be added to the electronic energy to give the requred sum.
- The table below provides details of all these energies for all three structures prior to comparison.
| HF/3-21G | B3LYP/6-31G(d) | |||||
|---|---|---|---|---|---|---|
| Electronic Energy (Hartree) | Sum of electronic and zero-point energies (Hartree) | Sum of electronic and thermal energies (Hartree) | Electronic Energy (Hartree) | Sum of electronic and zero-point energies (Hartree) | Sum of electronic and thermal energies (Hartree) | |
| Structure | 0K | 298.15K | 0K | 298.15K | ||
| Chair TS | -231.619322 | -231.466700 | -231.461341 | -234.556895 | -234.415034 | -234.409066 |
| Boat TS | -231.602802 | -231.450928 | -231.445299 | -234.543093 | -234.402342 | -234.396005 |
| anti-2 | -231.692535 | -231.539070 | -231.532566 | -234.611707 | -234.468760 | -234.461848 |
- From this data the activation energies can be calculated at 0K and 298.15K. Table 6 shows the results of these calculations, experimental data is also provided.
| HF/3-21G | B3LYP/6-31G(d) | Experimental | |||
|---|---|---|---|---|---|
| Structure | 0K | 298.15K | 0K | 298.15K | 0K |
| ΔE (Chair) | 45.41 | 44.69 | 33.71 | 33.12 | 33.5 ± 0.5 |
| ΔE (Boat) | 55.31 | 54.76 | 41.68 | 41.32 | 44.7 ± 2.0 |
- Comparison of computed data to experimental reveals poor correlation for the lower level calculation (HF/3-21G) with all results being approximately 10kcal/mol to high. However, with the DFT method there is good correlation of results especially for the chair conformation which is apparently correct to two significant figures. The boat conformation is a little off and only just outside the error range. It is possible that the QST2 calculation is not that effecient at finding the correct transition state and hence the energy is out of range. The only way to verify this would be to find another method to compute the transition structure.
- In conclusion the relatively low level calculations performed are good at guessing transition systems which cannot be determined by spectroscopy. The results are in good agreement with experimental data suggesting that the structures found do indeed represent the transition state present in the reaction coordinate.
h) Activation Energy Part 2: Temperature Dependence
- Take for example the transition through the boat structure modelling using the B3LYP/6-31G(d). Varying the temperature of the transition state and reactant models and comparing energy should indicate the temperature dependence. The effect on activation energies was modelled from 0K to 1000K.
| Temperature / K | |||||||||
|---|---|---|---|---|---|---|---|---|---|
| 0 | 100 | 200 | 298.15 | 400 | 500 | 600 | 800 | 1000 | |
| Boat TS (Hartree) | -234.402342 | -234.401227 | -234.399193 | -234.396005 | -234.391325 | -234.385471 | -234.378571 | -234.362327 | -234.343609 |
| anti-2 (Hartree) | -234.469197 | -234.467721 | -234.465256 | -234.461848 | -234.457060 | -234.451138 | -234.444159 | -234.427665 | -234.408570 |
| Activation Energy (Hartree) | 0.06685501 | 0.06649401 | 0.06606301 | 0.06584301 | 0.06573501 | 0.06566701 | 0.06558801 | 0.06533801 | 0.06496101 |
| Activation Energy (Kcal/mol) | 41.95212047 | 41.72558972 | 41.45513334 | 41.31708136 | 41.24931039 | 41.20663978 | 41.15706657 | 41.00018932 | 40.76361842 |
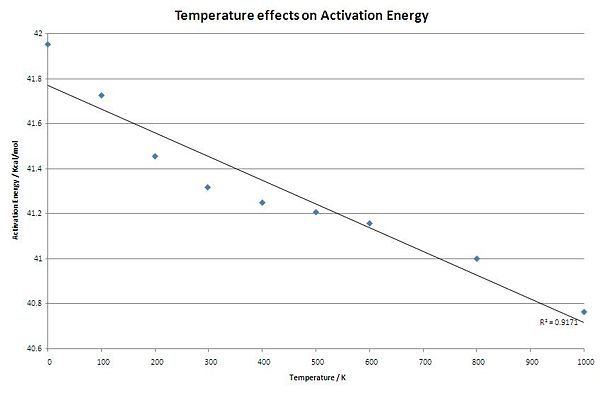
- This analysis confirms the theory that the activation energy falls as the temperature increases.
Diels-Aler [4+2] cycloaddition
a) HOMO/LUMO of butadiene
- To gain an understanding of the Diels-Alder cycloaddtion reaction, the molecular orbitals must first be computed to understand how the reaction proceeds in terms of orbital overlap (Woodward-Hoffman rules).
- In Gaussview a molecule of butadiene was created, and cleaned, an AM1 calculation was then run to compute the molecular orbitals.
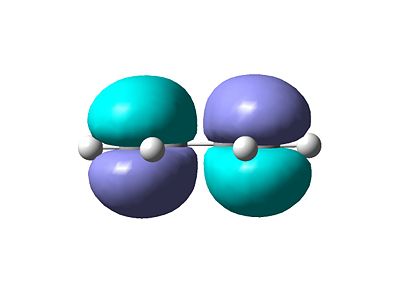
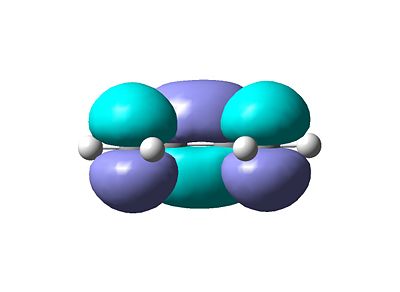
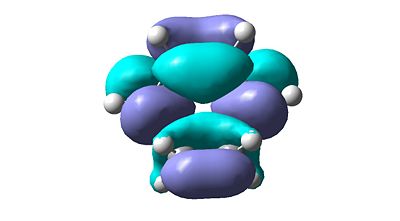
- The resulting MO's are shown below. Figure 1 shows the HOMO (Highest Occupied Molecular Orbital) and Figure 2 shows the LUMO (Lowest Unoccupied Molecular Orbital).
- These MO are expected using qualitative methods such as the LCAO approach (Linear Combination of Atomic Orbitals). Figure 3 shows the build up of molecular orbitals.
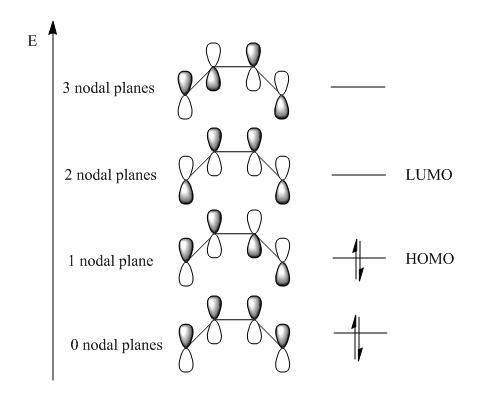
- It is obvious by considering the pi-orbital interactions possible in the qualitative method that the computed results match those from the MO diagram.
- In terms of symmetry the HOMO is anti-symmetric which respect to the plane bisecting the central C-C bond whereas the LUMO is symmetric.
b)[4+2] cycloaddition of butadiene and ethylene
- In order to find the transition state it was required to identify a suitable carbon-carbon distance between diene and dieneophile. The covalent radius of carbon is 7.7Å and the bond length range of a carbon-carbon bond is 1.2-1.54Å so the initial value must be somewhere in between these values. In the literature [2] there was a study involving the molecular orbitals of this reaction at varying ethylene-butadiene distances. They suggest that 2.2-2.3Å is the range for the transition state. In the following initial guess a value of 2.2Å will be used.
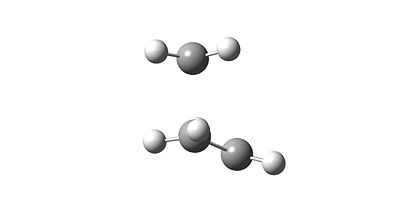
- Initially the optimisation was minimised to a transition state (Berny) using the Semi-Empirical method, AM1. Concurrent frequency analysis was also run. The results indicate a transition state (1 negative frequency).
 |
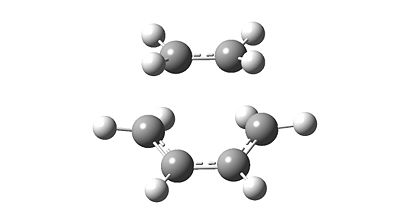 |
- The negative frequency appears at -956cm-1. This frequency does relate to the transition as the vibrational mode equates to stretching of adjacent carbon on the ethylene and butadiene.
- It is obvious from analysing the vibrational mode of the negative frequency that the formation of the bonds is synchronous as the vibration are in sync. The next mode (the first positive) frequency represent rocking of the ethylene with respect to the butadiene. This mode does not reflect the transition structure and can therefore be neglected from transition state analysis.
- In the Cope exercise it was possible to increase the accuracy of the result using the frozen coordinate method. It was hoped that this method would again help to provide a better solution that just a guess. Using the data from the literature the frozen coordinate was set-up in the Redundant Coordinate Editor as before, using bond and freeze coordinate for the adjacent carbon-carbon bond forming in the reaction. Instead of explicitly stating a bond distance, a range was entered (2.2-2.3Å) with 0.05Å increments. The optimisation calculation was again run using the Semi-Empirical AM1 method. The results were then used to optimise (and compute vibrations) to a transition state. Before the calculation was run the adjacent carbon pairs were set as derivative bonds in the Redundant Coordinate Editor. The calculation was again a AM1 method ("opt=noeigen" was also added to ensure Gaussian didn't crash when it computed the negative frequencies).
- The vibration data shows one negative frequency, as expected, at -956cm-1, the same as the original guess. Analysis of the vibrational mode is exactly the same as that shown in Figure 3. Comparison of the two structures indicates the no differences in terms of energy or dipole moment, which are 0.11163 and 0.5609 respectively.
- The molecular orbitals will originate from the initial guess as this structure is a transition state and relates to the expected transition mode.
 |
 |
| HOMO | LUMO |
- The calculation was re-run using the HF/3-21G method to see if there was any difference in structure. The resulting structure had the negative frequency at -818cm-1. This is significantly less than the frequency obtained from the AM1. This could be to do with the method employed or the actual transition state structure the method determines. If it could be assumed that the methods were comparable then the Semi-Empirical method would have a stronger force constant (imaginary bond strength) than the Hartree-Fock. This would infer that the transition state for the AM1 was closer to forming the bond than the HF because the interaction between carbons is stronger. The C-C distances between ethylene and butadiene are 2.12Å and 2.21Å for the AM1 and HF methods respectively this would confirm the suggestion that the transition state is closer to the product side of the reaction coordinate for the AM1 method than for the HF method.
- Typical C-C bond distances for sp3 and sp2 are 1.54Å and 1.35Å repectively. The intercarbon bond distance between the adjoining carbons on the ethylene and butadiene is 2.12Å. This suggests that the transition state does not reflect a state where the bond is forming as this would require the bond length to be close to the sp3 bond length. However the Van der Waals radius of carbon is 1.7Å and so for the two carbons to interact the intercarbon distance must be at the most 3.4Å (2 times VdW). The transition state computed is between the covalent radii and the Van der Waals radii. It is there plausible to assume that the carbons are interaction (inside VdW distance) but the carbon are not close to forming a bond because the intercarbon distance is too long for a bond to form (sp3 bond length is typically 1.54Å).
c) Regioselectivity of Diels-Alder (exo-/endo-)
- In this experiment the HF/3-21G method was used initially to ascertain the transition state structures for Diels-Alder reaction.
- The diene and the dieneophile were optimised separately using the HF/3-21G method and then appended into a single MolGroup to compute the transition structure. In order to ensure that the calculation was successful the two molecule were connected at the positions expected for the product structure. The structure was then cleaned using the tool in GaussView. The bonds were then removed and the pi-bonds delocalised as for the allyl groups in the Cope rearrangement. The transition state was then computed by minimising to the transition state (Berny) and computing the force constant once only. The "NoEigen" was added to ensure the stability of Gaussian whilst calculating the structure.
- The procedure was carried out for both exo- and endo- reactions and the resulting structures were obtained.
| endo-transition state. | exo-transition state. |
- Both structures have a single negative frequency at -648cm-1 for the exo-isomer and -644cm-1 for the endo-isomer. These values are relatively close and would suggest that the transition state is in roughly the same position on the reaction coordinate.
| endo-isomer | exo-isomer | |
|---|---|---|
| Energy (Hartree) | -605.610368 | -605.603526 |
| Relative Energy (Kcal/mol) | 0.00 | 4.29 |
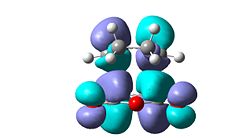
- It can be seen observed from the relative energies that the exo-isomer is higher in energy, however steric arguments suggest the exo-isomer is less strained and will be the lower energy isomer. Consideration of the frontier molecular orbitals reveals an explanation for endo-selectivity. The HOMO-1 (sym) of the endo-isomer has secondary orbital interactions between the carbonyl oxygens and the central two carbon atoms of the diene system. This is the only second order effect which is occupied, the HOMO (anti-sym) of the endo-isomer looks antibonding with respect to the oxygens. However the HOMO of the exo-isomer does show some second order interaction through the carbonyl oxygen and the CH2 group but the lobes are small and there will be no significant overlap so the stabilisation will be minimal.
| Endo-isomer | 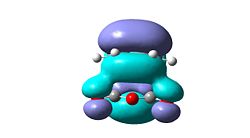 |
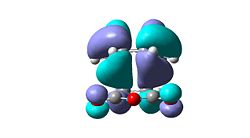 |
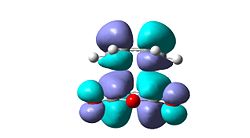 |
 |
| Exo-isomer | 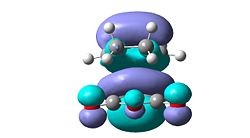 |
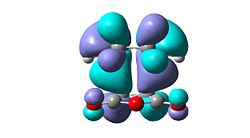 |
 |
 |
| HOMO-1 | HOMO | LUMO | LUMO+1 |
|---|
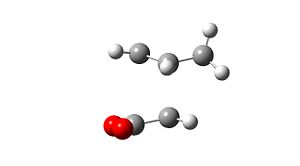
- It is these second order effects that dominate the steric clash shown below:
 |
 |
| endo-isomer | exo-isomer |
|---|
- The above figures in Table 5 indicate that the stereo-electronic clashing is reduced in the exo-isomer because there oxygen side of maleic anhydride is not eclipsed with the diene pi-system rather it is as far as possible from this. In the endo-isomer it is expected that the C=O molecular orbitals clash with those of the C=C system creating a greater stereo-electronic energy than the exo-isomer.
- Analysis of the C-C bond distances (for the soon to be adjoining carbon atoms) of the two structures shows a slight difference, 2.23Å and 2.27Å for the endo- and exo- structures respectively. This is counter-intuitive as it has already been suggest that stereo-electronic effects raise the energy of the endo-isomer relative to the exo-. It would be plausble to expect that the endo-isomer would have the longer intercarbon distance because it would reduce this clashing. A closer look at the bond angle between the bond transitional bond and the bond to the olefin group reveals that in the endo-isomer is considerably higher 97° vs. 94.5° for the exo-isomer. This is how the strain is reduced by merely adjusting the angle the diene lies with respect to the maleic anhydride.
