Rep:Mod:jhb79574592b
Computational Lab Spring 2009 - Module 2 - James H Bannock (CID:00468630)
Error Analysis
Energy - accurate to 1kJ/mol (or 3.8E-4 Hartrees)
Dipole Moment - accurate to 2dp
Frequencies (in wavenumbers) - accurate to 10cm-1
Bond Distances - accurate to approximately 0.01Å
Bond Angles - accurate to approximately 0.1°
Analysis of BCl3
BCl3 is expected to have a trigonal planar structure by VSEPR threory (Valence Shell Electron Pair Repulsion theory), however to able to measure bond lengths and angles either the molecule must be analysed by computational methods or by measuring results experimentally. In GaussView, an unoptimised BCl3 molecule was created. An optimisation calculation was then set up for Gaussian, the input file is shown below. The calculation was set up to run a DFT B3LYP/3-21G, this level of calculation is appropriate for the atom sizes in the molecule.
%chk= jban_BCl3_opt_3
%mem=6MW
%nproc=1
# opt b3lyp/3-21g geom=connectivity

J.H.Bannock BCl3 optimisation

0 1
 B
 Cl                 1              B1
 Cl                 1              B2    2              A1
 Cl                 1              B3    2              A2    3              D1

   B1             1.87000000
   B2             1.87000000
   B3             1.87000000
   A1           120.00000011
   A2           119.99999978
   D1           180.00000000

 1 2 1.0 3 1.0 4 1.0
 2
 3
 4
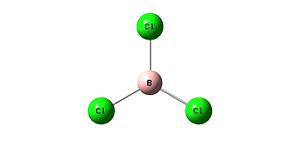
This input file is then submitted to Gaussian and processed. This produced an output file which was opened with GaussVIew producing the structure given in Figure 1. Using the query tool it was then possible to analyse the structure, the B-Cl bond distance and the Cl-B-Cl bond angle measured, Table 1 (below).
 |
The calculation was run in Gaussin and some snippets from Gaussian Output File (.log) have been shown below:
Stoichiometry    BCl3
Framework group  D3H[O(B),3C2(Cl)]
Deg. of freedom     1
Full point group                 D3H
Largest Abelian subgroup         C2V     NOp   4
Largest concise Abelian subgroup C2      NOp   2
Final structure in terms of initial Z-matrix:
B
Cl,1,B1
Cl,1,B2,2,A1
Cl,1,B3,2,A2,3,D1,0
     Variables:
B1=1.77502834
B2=1.77502834
B3=1.77502834
A1=120.
A2=120.
D1=180.
This data has been tabulated below and compared to literature:
| B-Cl bond distance / Å | 1.78 |
|---|---|
| Cl-B-Cl angle / ° | 120.00 |
These results are in rough agreement with literature data[1]. The B-Cl bond length is determined to be 1.75Å, the calculated value is therefore correct to 2sf. The bond angle is expected to be 120° both in literature and in structure models and is therefore accurate.
The Summary page of the Gaussian output provides the following information:
| File Type | .log |
|---|---|
| Calculation Type | FOPT |
| Calculation Method | RB3LYP |
| Basis Set | 3-21G |
| Final Energy (a.u.) | -1398.8 |
| Dipole Moment (Debye) | 0 |
| Point Group | D3h |
| Calculation Time | 34mins 39secs |
The summary indicates that there is no dipole moment, which is expected at the molecule has no highly polarised bonds and the molecule is highly symmetric. The D3h is assigned as expected and fully reflects the symmetry of the molecule.
Analysis of AlCl3 (D-space link: http://hdl.handle.net/10042/to-1830)
Optimisation
As for BCl3 the molecular was optimised using a B3LYP/3-11G method and basis set. The results indicates should be similar to that of the previous exercise. An extract from the output (.log) file shows the xyz coordinates of the optimised molecule:
----------------------------------------------------------------------
 Center     Atomic     Atomic              Coordinates (Angstroms)
 Number     Number      Type              X           Y           Z
 ---------------------------------------------------------------------
    1         13             0        0.000000    0.000000    0.000000
    2         17             0        0.000000    2.163558    0.000000
    3         17             0        1.873696   -1.081779    0.000000
    4         17             0       -1.873696   -1.081779    0.000000
----------------------------------------------------------------------
As before the bond lengths can be found by analysing the output file or using the query tool in GuassView.
| Al-Cl bond length / Å | 2.16 |
|---|---|
| Bond angle / ° | 120.0 |
The bond length is in accordance with literature[2], although it must be noted that comparison to so called 'Aluminium Chloride' is not valid as AlCl3 is a dimer and will show two bond lengths which will different from the standard Al-Cl bond length. The bond length, as for BCl3 has a bond angle of 120°, this to be expected as the aluminium does not have a lone pair so the chlorine atoms adopt the position where they are furthest apart, hence the planar 120° arrangement.
Guassian Output (Summary):
| File Type | .log |
|---|---|
| Calculation Type | FOPT |
| Calculation Method | RB3LYP |
| Basis Set | 3-21G |
| Final Energy (a.u.) | -1615.3 |
| Dipole Moment (Debye) | 0 |
| Point Group | D3h |
| Calculation Time | 21mins 44secs |
Vibrational Analysis of BH3
An optimised BH3 molecule, D3h point group, was analysed for any vibrations. This used the following Gaussian code:
%chk= james_bh3_opt.chk
%mem=6MW
%nproc=1
# freq b3lyp/3-21g geom=connectivity pop=(full,nbo)

BH3 Frequency

0 1
 B
 H                  1              B1
 H                  1              B2    2              A1
 H                  1              B3    3              A2    2              D1

   B1             1.19435300
   B2             1.19435272
   B3             1.19435272
   A1           119.99998016
   A2           120.00003967
   D1           180.00000000

 1 2 1.0 3 1.0 4 1.0
 2
 3
 4
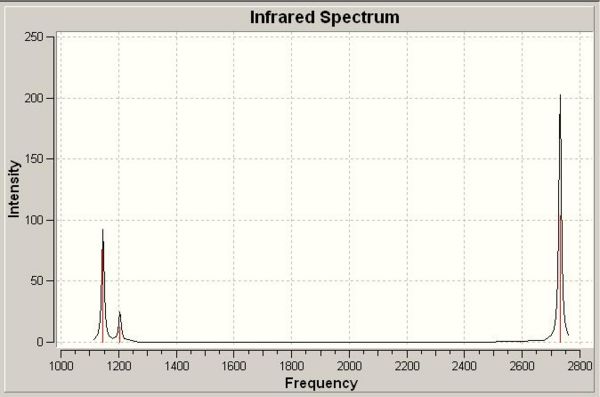
The top few lines of the Guassian Input File (above) tell Guassian what operation is required. The line beginning # describes the operation. "Freq" indicates that frequency analysis is required. B3LYP is the DFT method and 3-21G is the basis set (valid for all atoms in the range H-Xe, relatively poor basis set for molecules containing lots of atoms). "Pop=(full,nbo)" indicates the requirement for molecular orbitals. Once the calculation had run the output file was opened and the vibrations viewed. There were six vibrations, five antisymmetric and one symmetric (i.e. not IR active). Table 1 below describes each vibration and its properties.
| Vibration No. | Form of Vibration | Frequency | Intensity | Symmetry (D3h Point Group) |
|---|---|---|---|---|
| 1 | 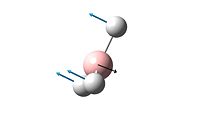 |
1146 | 92.7 | A2" |
| 2 | 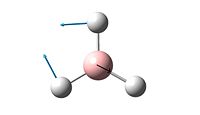 |
1205 | 12.4 | E' |
| 3 | 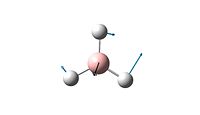 |
1205 | 12.4 | E' |
| 4 | 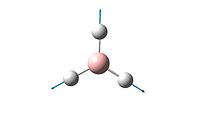 |
2593 | 0.0 | A1' |
| 5 | 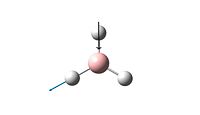 |
2731 | 103.8 | E' |
| 6 | 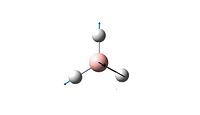 |
2731 | 103.8 | E' |
The symmetry group indicated above can be determined in one of two ways. Firstly Guassian is able to calculate these and they are in fact in the output file:
 Harmonic frequencies (cm**-1), IR intensities (KM/Mole), Raman scattering
 activities (A**4/AMU), depolarization ratios for plane and unpolarized
 incident light, reduced masses (AMU), force constants (mDyne/A),
 and normal coordinates:
                     1                      2                      3
                    A"                     E'                     E'
 Frequencies --  1145.7148              1204.6589              1204.6599
 Red. masses --     1.2531                 1.1085                 1.1085
 Frc consts  --     0.9691                 0.9478                 0.9478
 IR Inten    --    92.6991                12.3789                12.3814
 Atom AN      X      Y      Z        X      Y      Z        X      Y      Z
   1   5     0.00   0.00   0.16     0.00   0.10   0.00    -0.10   0.00   0.00
   2   1     0.00   0.00  -0.57     0.00   0.08   0.00     0.81   0.00   0.00
   3   1     0.00   0.00  -0.57    -0.38  -0.59   0.00     0.14   0.38   0.00
   4   1     0.00   0.00  -0.57     0.38  -0.59   0.00     0.14  -0.38   0.00
                     4                      5                      6
                    A'                     E'                     E'
 Frequencies --  2592.7908              2731.3088              2731.3095
 Red. masses --     1.0078                 1.1260                 1.1260
 Frc consts  --     3.9918                 4.9491                 4.9491
 IR Inten    --     0.0000               103.8370               103.8302
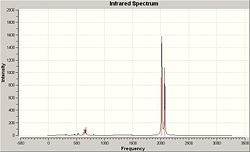
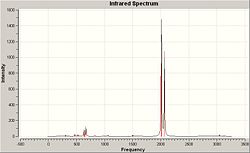
The other method is to use the character tables, this requires analysis of the stretching/bending under each of the symmetry operations in the point group, D3h. Take for example the symmetric stretch at 2593cm-1, under all operations (E, C3, C2, σh, σv, S3) the molecule remains the same (indicated by 1 in the character table, -1 would indicate a different structure after the operation. Degenerate pairs will show 2 and O in the table, these numbers are calculated by the trace of the matrix representing perpendicular orbitals). Looking at the frequency of vibrations it is clear there are two pairs of vibrations that have the same frequency. This is a clear indicator of degenerate pairs. The complete spectrum (representing both frequency and intensity) is shown below in Figure 1.
Molecular Orbitals of BH3
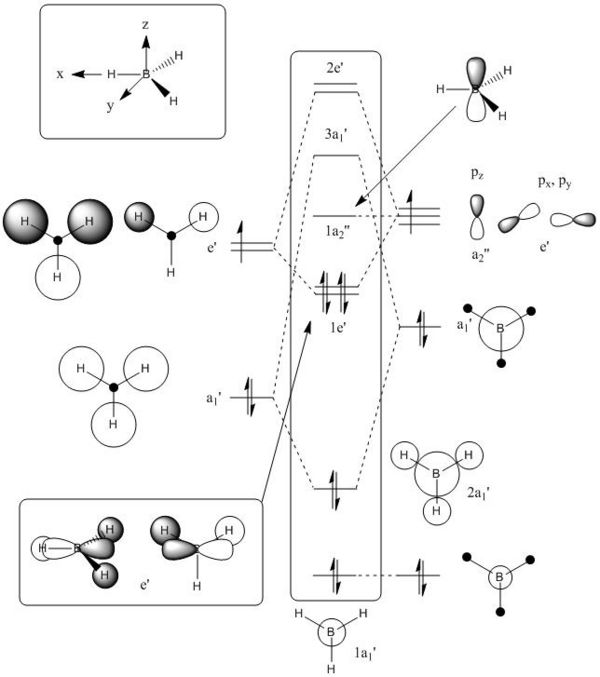
Using the pop=(full,nbo) function, whilst doing frequency analysis, allows MOs of the optimised structure to be viewed. These MOs are shown in Table 1 below, MO1 represents the lowest energy molecular orbital, MO4 and MO5 are a degenerate pair of HOMOs and MO6 is the LUMO. By considering the orbitals involved in bonding it has also been possible to draw a qualitative molecular orbital diagram, again shown in Table 1. The qualitative approach assumes the linear combination of atomic orbitals approach and makes no attempt to predict orbital energies or lobe sizes.
| Qualitative MO | Quantitative MO |
|---|---|
 |
MO 5 (LUMO)
(-0.074a.u.) 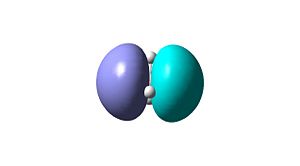 |
| MO 4 (HOMO)
(-0.356a.u.) 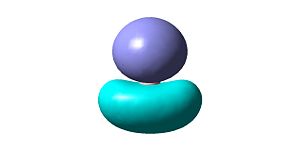 | |
| MO 3 (HOMO)
(-0.356a.u.) 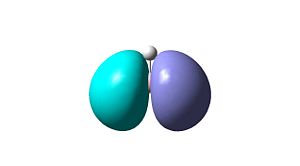 | |
| MO 2
(-0.517a.u.) 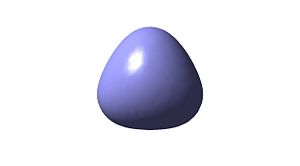 | |
| MO 1
(-6.730a.u.) 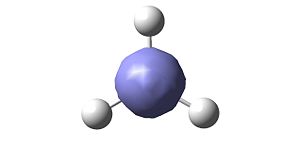 |
It is clear by comparison that the molecular orbitals computed in Gaussian are exactly the same as the qualitative ones predicted in the MO diagram. The computed MOs show a quantitative representation of orbital size and are a better representation but the qualitative approach cannot be ignored as it is a quick and non mathematical approach to finding the same answer, although as the molecule becomes larger the qualitative approach becomes a lot more challenging. The quantitative molecular orbitals also show the energy of the orbital. Note that the antibonding orbitals in the qualitative model are not approximated because they are not compared to quantitative orbitals. These orbitals will be an inverse superposition of the orbitals in the bonding MOs. (i.e. instead of additive combination there would be substitutive combination of orbitals).
Analysis of cis-/trans- isomers
Mo(CO)4(PMe3)2
D-space Identifier
Cis-isomer
Optimisation: http://hdl.handle.net/10042/to-1782
IR: http://hdl.handle.net/10042/to-1831
Trans-isomer
Optimisation: http://hdl.handle.net/10042/to-1783
IR: http://hdl.handle.net/10042/to-1832
Optimisation
Method:
Two optimisations were performed to try and attain an accurate structure of the two isomers. Initially a DFT B3LYP/LANL2MB calculation was run with the "opt=loose" addition. This basis set is suitable for these complexes as it can account for d-orbitals on the molybdenum and the p-orbitals of phosphorus thus allowing pi-donation from phosphorus to molybdenum. The "opt=loose" allows the calculation to run and find the lowest energy but RMS is not as low thus returning a structure which is roughly optimised. The basis set was then changed to LANL2DZ and the properties changed to "int=ultrafine" and "scf=conver=9", this will take the LANL2MB output and manipulate the atoms to find a lowest energy structure to high degree of accuracy. It is important that this approach is adopted otherwise processing would take too long.
Structures:
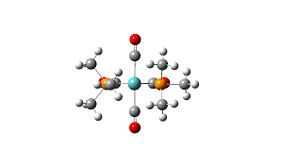
| cis-isomer | 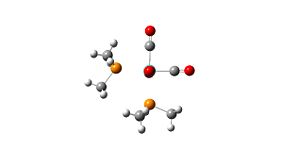 |
 |
|||
|---|---|---|---|---|---|
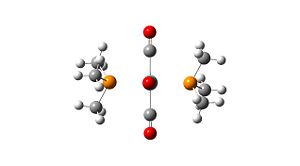
| trans-isomer |  |
 |
General observations:
Cis-isomer: adjacent PMe3 ligands have the methyl groups in a conformation with the least steric clashing.
Trans-isomer: opposite PMe3 ligands have the methyl groups gauche rather than eclipsed.
D-orbital Expansion:
The modification was carried out as described in the script however the frequency analysis of the optimised structures showed two negative peaks at -78cm-1 and -71cm-1 indicating that the structure was not fully optimised. There was not enough time to repeat this process. The optimised structures have been added to the D-space, however frequency analysis was carried out on the laptop so it was not submitted to the repository (Cis-isomer @ http://hdl.handle.net/10042/to-1927 and trans-isomer @ http://hdl.handle.net/10042/to-1928).
Comparison to Experimental Properties
cis/trans-[Mo(CO)4(PMe3)2]:
Comparison of computed results, from optimisation and frequency analysis, is important to measure the accuracy of the calculations. It was therefore required to find X-ray crystallography data and IR data for both complexes. For the cis-isomer this was easy and a paper documenting all of the experimental properties was found. However, this was not the case for the trans-isomer this was not possible despite rigourous searching of databases. Instead comparisons will be made with trans-[Mo(CO)4(PPh3)2] as this complex is the closest matching structure.
| Cis-isomer | |||
| Property | Computed Value | Experimental Value[3] | |
|---|---|---|---|
| ν(C=O) (eq) | 1849cm-1 | 1899cm-1 | |
| ν(C=O) (ax) | 1851cm-1 | 1905cm-1 | |
| ν(C=O) (ax & eq) | 1870cm-1 & 1960cm-1 | 1922cm-1 & 2019cm-1 | |
| Mo-P | 2.65Å | 2.52Å | |
| P-Mo-P | 95.3° | 97.5° | |
| Mo-C (adj) | 2.03Å | 2.02Å | |
| Mo-C (opp) | 1.98Å | 1.97Å | |
| C-O | 1.19Å | 1.14Å | |
Comparing to literature it is clear that the bond length are in good accordance, although all to varying degrees of accuracy. The stretching frequencies are quite different to literature, it must be noted that a vibration of frequency -5cm-1 was returned (within the 10cm-1 tolerance), so the values are not going to be precise. Another explanation for the difference could be the mathematical interpretation of backbonding by the quantum method and basis set. The computed C-O bond length is 0.05Å longer than the experimental which would indicate that the computed C-O bond has suffered more backbonding (as less pi structure increases the bond length). Couple this with the decrease in frequency calculated relative to experimental (indicates weaker C-O bond) can provide a plausible argument for this observation. This would then infer that the basis set does not completely describe the system (which is in fact true because it is stated in the lab script). A note on the symmetry of the carbonyl stretching modes, the calculation method declares the symmetry C1and close analysis does indicate this to be accurate, this means all vibration are labelled as A.
| Trans-isomer | |||
| Property | Computed Value | Experimental Value[4] | |
|---|---|---|---|
| ν(C=O) (IR active) | 1838cm-1(degenerate pair) | 1895cm-1(single peak) | |
| ν(C=O) (IR inactive) | 1882cm-1 & 1954cm-1 | not observed | |
| Mo-P | 2.57Å | 2.50Å | |
| P-Mo-P | 180.0° | 180.0° | |
| Mo-C | 2.03Å | 2.02Å | |
| C-O | 1.19Å | 1.16Å | |
The carbonyl stretches are again significantly different from the experimental data. This is again assumed to be a failure of the method and/or basis set as the optimisation places more backbonding to CO than that observed experimentally. All the other properties are in good accorandance with experimental values. A note on the symmetry of the carbonyl stretching modes, the calculation method declares the symmetry C1 but close analysis woud suggest C2h which means 1839cm-1 is Au, 1839cm-1 is Bu, 1882cm-1 is Bg and 1954 is Ag.
Questions
What is the energy difference between these isomers (in kJ/mol)? Which one is more stable?
The energy difference is 7.7kJ/mol (2.9×10⁻³ Hartrees). The cis isomer is more stable.
How could we alter the ligands L=P(CH3)3 or L=piperidine in order to alter the relative ordering of the cis and trans isomers? This is how we can "fine-tune" catalytic behaviour, by stabilising the structurally more efficient isomers. If you have time, test your prediction by carrying out calculations.
In the PMe3 case if the methyl group were replaced with bulkier ligands such as phenyl, iso-propyl or iso-butyl groups then there would be the expectation that the order of stability would swap over on steric grounds. There would be significant clashing between the PR3 ligands in the cis-isomer which would releaved in the trans-isomer. No calculations were carried out to prove this.
Ammonia
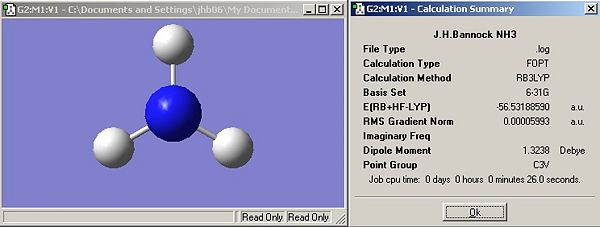
Symmetry
Results
Questions
Has the symmetry made any difference to the final structure obtained?
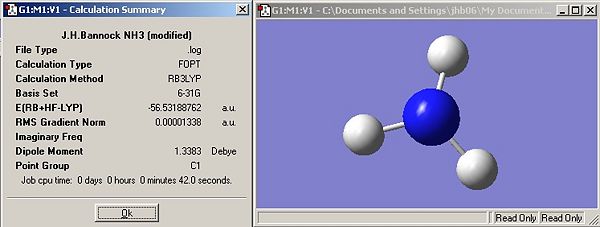
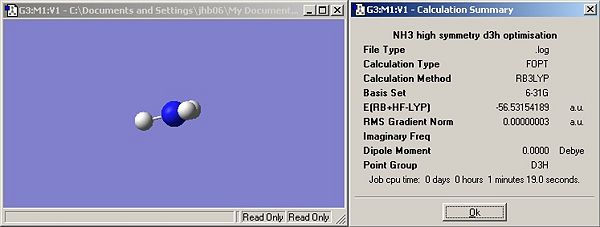
Yes, the first two structures (C3v and C1) are trigonal pyrimidal, introduction of a dummy atom on the principal axis changes the structure to trigonal planar (D3h). Changing the rotational symmetry has no effect (i.e. C3 to C1) but introducing new mirror planes and rotational axis does. Introduction of the dummy atom creates a &sigma:h plane and introduced three C2 axis perpendicular to the principal axis (criteria for D label (Cn and nC2)).
Has the symmetry made any difference to the time it took to optimise the geometry?
Yes, although there is no correlation. In order of increasing symmetry, C1 -> C3v -> D3h the time decreases (42secs to 26secs) and then increases (26secs to 1min 19secs).
What implication does symmetry have for the time it takes to do a calculation?
If symmetry is modified away from that predicted by VSEPR then the calculation time increases. C3v is the experimentally observed point group. It has been shown that C1 and D3h take a longer time to process, it is therefore plausible to suggest that processing time is more dependent on deviations from classical models for the molecule.
Can a molecule "break symmetry" during an optimisation?
Looking through the output files it is clear that symmetry is held the same during optimisation of these molecules. Each iteration clearly states the Full Point Group which constant throughout each file. However, if a poor quality input file was optimised it would be expected that optimisation would improve the structure which could lead to new symmetries.
What implications does this have if you enter a high symmetry structure to optimise?
Entering a high symmetry structure should reduce the processing time. If the symmetry is already in place then only the variables like bond lengths need optimising. In this case relative positions of the atoms need not change thus providing some convergence.
Which is the lowest energy geometry?
The C1 NH3 is the lowest energy geometry. It must be noted that all the geometry's have the same energy to 3d.p., this means lowest energy geometry is decided based on the fourth decimal place. It has previously been stated that the energy has an error of 3.8E-4 Hartree's. This means that the judgement is erroneous.
What is the energy in kJ/mol of the other two isomers above the energy of the lowest energy structure? Hint: take ΔE=E(high energy)-E(low energy), the energy units are reported in atomic units so you will need to convert the energy difference to kJ/mol.
C3v is 4.5J/mol higher in energy D3h is 0.9KJ/mol higher in energy
Is the energy differences between these structures significant? Explain why.
For the trigonal pyramidal structures there is very little difference, this is to be expected as the structure is pretty much the same except the symmetry has been lowered by changing one of the bond lengths. Whereas there is significant change for the D3h structure. Although the symmetry has been raised, the H atoms are now closer to the lone pair on the nitrogen. This means there should be a stronger repulsion energy (all be it small) hence a raising of energy is observed.
Methods
Results
Questions
How long do these calculations take compared to your lower level ones?
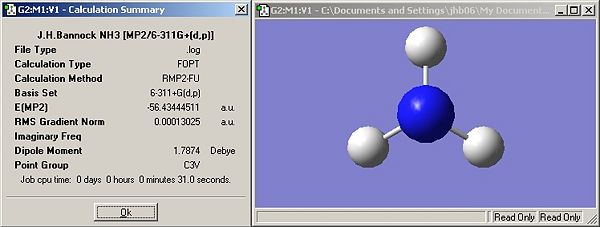
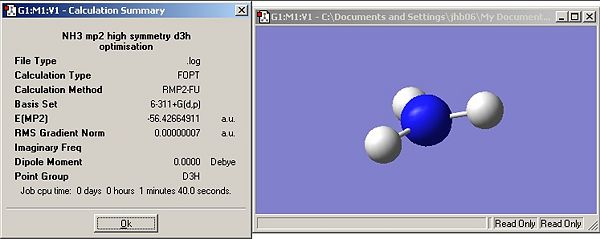
Both calculations take longer than the lower level B3LYP/6-31G calculations. This is because of the increased complexity of the basis set and method employed.
Determine the barrier height to inversion by finding the relative energy at this level of calculation ΔE=E(D3h)-E(C3v) in kJ/mol
20.52kJ/mol
Has ΔE changed much between the B3LYP/6-31G and MP2/6-311+G(d,p) sets of calculations?
Yes, using the B3LYP/6-31G method the δE was 0.896kJ/mol whereas it is 20.52kJ/mol when MP2/6-311+G(d,p) is used.
How do your results compare to the experimentally determined barrier which is 24.3 kJ/mol?
The B3LYP/6-31G is in no way reflective of experimental data whereas the MP2/6-311+G(d,p) result has the correct order of magnitude and is also correct to 1s.f. which shows that this method can provide relatively accurate results.
Inversion
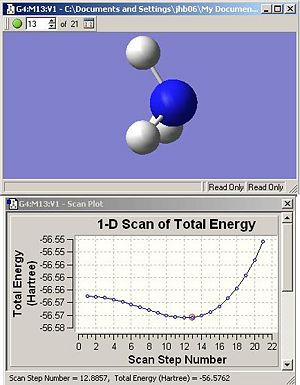
The ammonia inversion process can be modelled by Guassian using the SCAN function. Analysis of the SCAN shows a potential energy surface (PES) relative to H-N-H bond angle (or SCAN step number). Figure 1 (below) shows the PES profile and it is clear that step 13 at the minima. Measurement of the H-N-H angle at this point reveals an angle of 104.6°. This value is in good accordance, 107.5°, with the H-N-H angle measured from the MP2/6-311G(d,p) optimisation earlier. This is expected as the optimised structure reflects the equilibrium structure.
Vibrations
Results
| Point Group | Frequency | Symmetry | Spectrum |
|---|---|---|---|
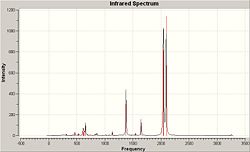
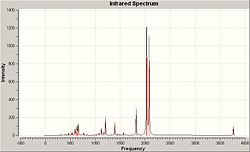
| C3v | 462 | A1 | 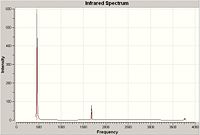
|
| 1682 | E | ||
| 1682 | E | ||
| 3567 | A1 | ||
| 3766 | E | ||
| 3767 | E | ||
| D3h | -318 | A2" | 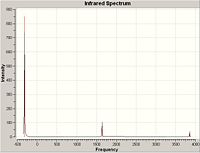
|
| 1641 | E' | ||
| 1641 | E' | ||
| 3636 | A1' | ||
| 3854 | E' | ||
| 3854 | E' |
Questions
How many positive frequencies are there for the C3v and the D3h structures?
There are six positive frequencies for the C3v structure and five for D3h structure.
Draw the vibrational modes for both structures (visualise them with gaussview) and match them up, ie which vibrational modes have the same character of motion for the C3v and D3h structures.
The vibrations of the two ammonia structures pair up in order of increasing frequency. Apart from minor changes to the displacement vectors caused by the change in H-N-H angle the vibrations are effectively the same. As C3v is a subset of D3h it is plausible to match character letters from each structure. The results table shows these characters and as expected E maps E' and the A1 maps onto A1'. However A1 should not map onto A2", this is the vibration which tracks the inversion and it may be plausible to expect that the character of vibration may change.
Compare the calculated frequencies for the C3v structure to those obtained experimentally (you will have to look them up). The C3v structure is the ground state structure, ground state structures always have all positive frequencies.
Comparing the results to those from the NIST database[5] it is clear that there are significant differences. There are five key peaks as for the computed data, however these peaks are different from the experimental data.
| Computed Data / cm-1 | Experimental Data / cm-1 |
|---|---|
| 462 | 620 |
| 1682 | 920 & 960 (rotational fine structure causes peak splitting) |
| 3567 | 1600 |
| 3767 | 3160 |
The comparison of peak suggests that ammonia is not in its ground state at room temperature, a statement which is intuitive. It is expected that ammonia is rapidly undergoing inversion and the IR represents a hybrid of the C3v and D3h structures. Although there may not be enough thermal energy to allow interconversion, the process can proceed via quantum tunnelling.
The D3h structure is a transition state structure, transition states always have only one negative frequency, what is the value of negative frequency?
The negative frequency is observed at -318cm-1.
Which vibration in the C3v and D3h structures "follows" the inversion reaction path?
The first (lowest frequency) vibration, 462cm-1 for C3v and -318cm-1 for D3h, tracks the inversion process. The displacement vectors for bending reflect the transition that must occur for inversion.
A theoretical study of (η6-C6H5R)Cr(CO)3 derivatives with a view to selective attack on benzene rings
Notes
Please ensure that the mini-project is viewed on a large screen else the results section cannot be fully observed.
Abstract
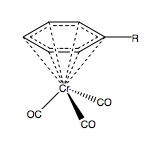
(η6-C6H5R)Cr(CO)3 derivatives all have a definitive structure with the three carbonyl groups below chromium and the arene above, Figure 1 (below). In this experiment it is hoped that variation of the R group from electron withdrawing groups (EWGs) to electron donating groups (EDGs) will show a change in the binding molecular orbital from the arene to the metal centre and also have an effect on the strength of donation. The strength of donation can be monitored by an infra-red study of the three carbonyl groups. It is expected that an EWG will reduce the donating ability of the arene and reduce the electron density around the adjacent carbon in the ring, and visa versa for EDGs.
Introduction
It is known that that addition of arene to chromium hexacarbonyl produces a η6-arene tricarbonyl species[6], Figure 1 (above). In synthetic chemistry this has applications for nucleophilic attack of the benzene ring, a reaction which would never occur with free arene. This turn in reactivity can be accounted for by effect that the three carbonyl groups have on the electron density. Carbonyls are very strong π-acceptor ligands and will effectively leach the arene of its ring density, thus rendering the ring susceptible to nucleophilic attack. This is of course reverse reactivity to that expected for an arene system so the chromium system has important applications for promoting these reactions.
If, for instance, benzene is placed on the chromium system then a nucleophile will unselectively attack the ring, although this makes no difference to the final product, but if substituents are added to the ring then there is the expectation that some directing influence would be observed. These would be a mixture of inductive and mesomeric effects causing a nucleophile to favour certain positions. This statement is true for free arenes but not necessarily true for coordinated species. However, it could be expected that there is still some favouring of these directing sites as the ring system is not completely destroyed.
Once a reaction has been carried the arene can simply be removed by exposure of the system to air or any other mild oxidising agent, the system is also very light sensitive. Exposure to light and air will rapidly remove the arene, this is restricting factor during the reaction as the complex is so sensitive.
This experiment will show the effect that five different substituent's have on the electron density donated to the chromium and also the LUMO (the orbital which is involved in nucleophilic attack). Two of these will be electron withdrawing, R=NO2 and R=COOH. NO2 is the more powerful of the two R groups and is expected to significantly reduced the donating ability of the arene and promote nucleophilic attack nearest the N2. It is expected that COOH, a milder EWG, will show similar effects but weaker than NO2. Similarly two electron donating groups will be modelled, R=OCOMe and R=NH2. NH2 is the stronger EDG and is expected show opposite character to NO2 and enhance donating into chromium and promote nucleophilic attack para to its position in the ring, likewise for R=OCOMe. These four will be referenced to R=H for comparitive purposes.
For the R=H[7] the optimisation will be run over a series of methods and basis sets to determine the most efficient method and basis set for modelling these complexes. It is important that the hypervalency of chromium be taken into account when running these calculations, this is where the (d,p) additions can help by adding an extra set of p- and d-orbitals[8]. The five variant (R) models will be optimised using a suitable method and basis set (to be found by optimisations of the R=H complex) thus allowing trends to be ascertained. Molecular orbitals and vibration data will be calculated using the same DFT B3LYP/6-31G(d,p) as for optimisation. These sets have been chosen purely to keep the processing time down.
Results
Variation of Method and Basis Set:
The reference (R=H) aryl chromium tricarbonyl species was optimised with increasing complex methods and basis sets. The results are tabulated below:
| Method/Basis Set | Energy (Hartree) | Energy (kJ/mol) | D-space Link |
|---|---|---|---|
| DFT B3LYP/6-31G(d,p) | -1616.7 | -4.24×10³ | http://hdl.handle.net/10042/to-1884 |
| DFT B3LYP/6-311G(d,p) | -1616.71 | -4.24×10³ | http://hdl.handle.net/10042/to-1885 |
| DFT B3LYP/LANL2MB | -651.20 | -1.71×10³ | http://hdl.handle.net/10042/to-1886 |
| DFT B3LYP/LANL2DZ | -658.49 | -1.73×10³ | http://hdl.handle.net/10042/to-1887 |
| MP2 LANL2DZ | -655.79 | -1.72×10³ | http://hdl.handle.net/10042/to-1888 |
Literature data[9] with more complex quantum methods indicates an energy of -1612.17 almost exactly the same as the 6-31G(d,p) and 6-311G(d,p). This shows that the higher basis sets fail to obtain accurate results and as a consquence the lower basis sets are used from here after.
Variation of R:
As defined in the Introduction R
Discussion
IR Analysis:
There are three carbonyl vibrations in each structure, all of which are asymmetric stretches. All three values decrease from R=NO2 to R=NH2 indicating a reduction in bond order, by Hooke's law (ν proportional to k, the force constant of the bond). The shift can be explained by backbonding by the metal. When R=H there are no substituent effects and the arene donates into the Cr orbitals and a mid range set of CO stretching frequencies are observed, which will involve some degree of backbonding as free CO peaks are normally observed at 2143cm-1 hence there is an decrease in bond order. Now let R be an EWG, the EWG will withdraw negative charge onto itself and thus remove electron density from the ring system, consequently the ring system cannot donate as much charge into the Cr centre. The Cr centre is now not as electron rich and will not backbond as strongly as in the R=H case. This leads to higher bond order and hence the carbonyl stretches are observed at higher wavenumbers. If the R is and EDG the effect is reversed and more electron density is donated into the metal centre and hence there is stronger backbonding. This reduces the C-O bond order and hence the stretching frequencies are lower than when R=H. Figure 3 depicts the mechanism for backbonding.

Orientation of the optimised R variants:
The structure of R=H is shown in Figure 2, if the R group is varied there is a slight trend observable for the EDG groups. With increasing EDG strength the R group tend to eclipse with the carbonyl below. When R=Me there is a slight deviation (see Jmol) and when R=NH2 the R group is almost totally eclipsed.
This can be explained by considering the state of the EDG in the system. The EDG will donate electron density and become deficient. The electron density is passed through the metal system and effectively ends up on the oxygen. It is therefore plausible to suggest that the eclipsing is a result of a long range dipole/dipole interaction leading to some degree of stabilisation.
It must be noted that for EWG the R group remains gauche to the carbonyls which would be predicted by the same theory as above. Any dipole/dipole interaction in this case would be repulsive and therefore lead to destabilisation. Staying in a gauche conformation minimises this interaction.
Molecular Orbitals:
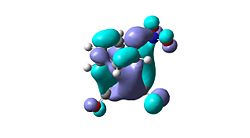
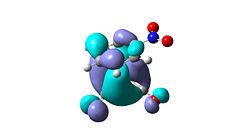
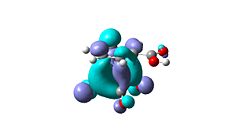
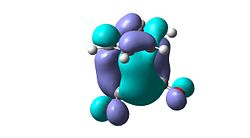
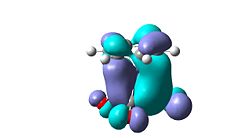
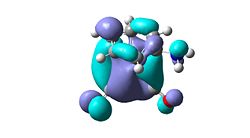
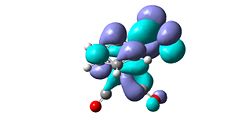
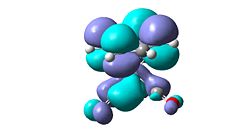
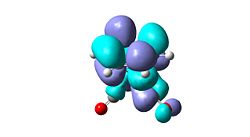
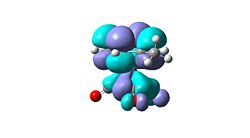
The HOMO orbitals of all variants of R show strong donation of the arene into the chromium centre, it can be observed that the MOs become increasingly inflated from EWG to EDG, an indication on the effect that the increased electron density has on the bonding. However, the HOMOs provide no useful purpose when trying to predict reactivity. This is where the LUMO is useful. It is expected that incoming nucleophiles will attack and bond with the LUMO so careful analysis of these orbitals should reveal any trends. Tabulated prediction data is provided below with a top-down snapshot (a nucleophiles perspective)
| R group | Nu attack prediction | Top-down Snapshot | Comments |
|---|---|---|---|
| NO2 | ortho, para | 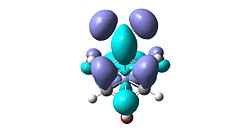 |
lobes concentrated on ortho and para sites, no density on meta postions |
| COOH | para | 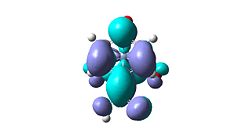 |
expectation that three membered rings could form on ortho-para double bond on either side. |
| H | un-selective | 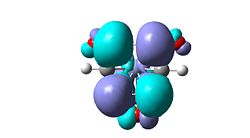 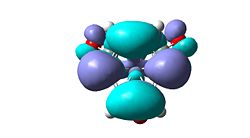 |
- |
| Me | ortho, meta | 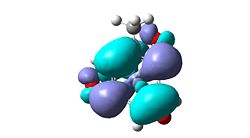 |
expectation that three membered rings could form on ipso-ortho or meta-para double bond. |
| NH2 | ortho, meta |  |
possibilites from electron rich dienes to perform Diels-Adler on the effective C=C antibonds |
Methods and Basis Sets:
Analysis of the C-C bond length in the arene give some indication to the differences between the 6-31G/6-311G basis and LANL2MB/LANL2DDZ. It is observed that the C-C bond is 0.015Å longer in the LANL2MB/LANL2DZ cases compared to the others. This would suggest the optimisation is taking more pi-density out of the ring causing the C=C character to tend toward C-C character (and as a result elongating the C-C distance). There are two C-C distances the B3LYP/6-31G returns results exactly the same as the literature [ref 9] whereas the LANL2MB/DZ are longer.
Experimental
For the R=H complex the structure was optimised using increasing complex methods and basis sets. It was hoped that applying suitable basis sets and methods to the problem would produce a trend to favour the more complex basis set. However, the optimisation results indicate that the 6-31G and 6-311G are lower in energy than the LANL2MB and LANL2DZ. The reasoning for this is unclear so the B3LYP/6-31G(d,p) was chosen based on accuracy and simplicity for comparitive purposes on the five R groups.
After optimisation of each of the five variant complexes, with the 6-31G(d,p) basis set, both frequency and molecular orbital calculations were run. The frequency calculations without any problems. However the molecular orbitals failed to produce results for the EWG and EDG systems (only R=H worked). It was decided to add the diffuse function, "+", to the calculation on the grounds that the EDG/EWG systems were manipulating the molecular orbitals and that a diffuse function would better accomodate electron density movement. All calculation subsquently worked. It must be noted that only the frontier orbitals were computed using the pop=regular function to save on unneccessary processing time as only the HOMO and LUMO need to be analysed.
D-Space References
(η6- C6H6)Cr(CO)3:
Optimisation: http://hdl.handle.net/10042/to-1884
IR: http://hdl.handle.net/10042/to-1902
MO: http://hdl.handle.net/10042/to-1903
(η6-C6H5COOH)Cr(CO)3:
Optimisation: http://hdl.handle.net/10042/to-1900
IR: http://hdl.handle.net/10042/to-1898
MO: http://hdl.handle.net/10042/to-1891
(η6-C6H5Me)Cr(CO)3:
Optimisation: http://hdl.handle.net/10042/to-1895
IR: http://hdl.handle.net/10042/to-1893
MO (same as opt): http://hdl.handle.net/10042/to-1895
(η6-C6H5NH2)Cr(CO)3:
Optimisation: http://hdl.handle.net/10042/to-1899
IR: http://hdl.handle.net/10042/to-1896
MO: http://hdl.handle.net/10042/to-1894
(η6-C6H5NO2)Cr(CO)3:
Optimisation: http://hdl.handle.net/10042/to-1901
IR: http://hdl.handle.net/10042/to-1897
MO: http://hdl.handle.net/10042/to-1892
External Reading
- L. Turker, S. Gumus, Polycyclic Aromatic Compounds, 2008, 28, 181–192
- D. Astruc, Organometallic Chemistry and Catalysis, pp. 254
- T. A. Albright, B. K. Carpenter, Inorg. Chem., 1980, 19, 3092-3097
Final Comments
This project has proved the original theory, and the results may indeed help justify reactivity. It was hoped that a disubstituted arene could be analysed but it the calculation took too long.
References
- ↑ H. Kato, K. Yamaguchi, T. Yonezawa, K. Fukui, Bulletin of the Chemistry Society of Japan, 1965, 38(12), 2144
- ↑ D. Doylea , Y. K. Gunko , P. B. Hitchcock, M. F. Lappert, J. Chem. Soc., Dalton Trans., 2000, 4093–4097
- ↑ F. A. Cotton, D. J. Darensbourg, S. Klein, B. W. S. Kolthammer, Inorganic Chemistry, 1982, 21(7), 2661-6.
- ↑ G. Hogath, T. Norman, Inorganica Chimica Acta, 1997, 254, 167-171
- ↑ NIST Chemistry WebBook (http://webbook.nist.gov/chemistry)
- ↑ M. Rosillo, G. Dominguez, J. Perez-Castells, Chem. Soc. Rev., 2007, 36, 1589–1604
- ↑ B. Rees, P. Coppens, Acta Cryst., 1973, B29, 2515
- ↑ J. Lin, K. Wu, M. Zhang, J. Comp. Chem., 2008, 0, 1 (?)
- ↑ A. A. Low, M. B. Hall, Inter. J. Quantum Chem., 1999,77(1), 156

