Rep:Mod:jgh003
Julia Gonzalez Holguera Computational Lab - Module 3
This module will focus on two chemical reactions, namely the Cope rearrangement and the Diels-Alder cycloaddition, looking at their transition state structures on potential energy surfaces. It is recognised that a quantum mechanical treatment is necessary for a rigorous description of the dynamics of a chemical reaction, even if in the 2nd year physical lab, triatomic collisions were described within the Born-Oppenheimer approximation on a potential energy surface using a simple classical model. The total energy was in this case calculated for different geometries of the triatomic systems, using an analytical function of the atomic coordinate.
This module will however be focusing on the transition state of larger molecules, meaning that simple classical mechanic treatments can no longer be used. The calculations will be performed using computational treatments of the Schrodinger equation. The geometries of the transition states, as well as the reaction pathways and barrier heights, will be determined and discussed.
Part 1: The Cope rearrangement
The first part of this module will focus on the Cope rearrangement of 1,5 hexadiene. The Cope rearrangement is an example of a [3,3] sigmatropic shift with migration of an allyl group. The electron count of the reaction is 6 (4n+2), meaning that the reaction is thermally allowed and proceeds via a Hückel transition state. This exercice will aim to show how computational methods can be used to locate the lower energy minimum and transition structure on the potential energy surface of a reaction, as well as determining the preferred reaction mechanism.
Optimization of Reactants and Products
The analysis of the reaction started by getting familiar with the optimized structure of the reactants and products (both of which have the same structure).
Using GaussView 5.0, a molecule of 1,5-hexadiene was drawn with an approximate anti-periplanar conformation for the central four atoms. The structure was cleaned, before being submitted to the Gaussian program for a structure optimization using the following method:
# opt hf/3-21g geom=connectivity
The script used refers to:
- opt: instruction for an optimization, which means searching for a minimum energy geometry.
- HF: refers to Hartree-Fock ‘Ab Initio’ calculation. Ab Initio computations are derived directly from theoretical principles, making no inclusion of experimental data. These can be seen as approximate Quantum Mechanical methods. The Hartree-Fock method, whose’s primary approximation is called the central field approximation, doesn’t include Coulombic electron-electron repulsion in the calculation. This is a variational calculation, meaning that the approximate energies calculated are all equal to or greater than the exact energy. Because of the central field approximation, the energy obtained from an Hartree-Fock calculations is always greater than the exact energy and tends to a limiting value called the Hartree-Fock limit [1].
- 3-21g: basis set for the calculation. A basis set is a mathematical description of the orbitals of a system, which is used for approximate theoretical calculations. Numerous basis sets have been developed. Minimal basis sets use one basis function for every atomic orbital required to describe the free atom. The 3-21G basis set is the smallest split-valence basis set and uses one function for orbitals that are not in the valence shell and two functions for those in the valence shell [1]. It is a relatively low accuracy basis set.
- geom=connectivity - defines the source of molecule specifications (in this case position of atoms) [2]
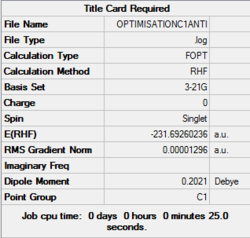
The calculation summary obtained from the Output file is reported in Figure 1. The calculation method RHF refers to the Hartree-Fock calculation for singlet molecules, and the gradient norm RMS is low enough (<0.0001) to suggest that the optimization had completed at this level of theory. The point group of the molecule is found to be C1.
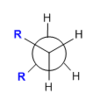
The optimization was repeated for a gauche conformation using the same computational method. From purely steric consideration, one would expect the gauche conformer to be higher in energy than the anti one, as the bulky R groups are kept further away from each other in the later conformation. This is best seen in a Newman projection of the two conformers (see Table 1).
| Conformation | Representation (from GaussView) | Newman projection | Energy | Point Group |
|---|---|---|---|---|
| Anti | 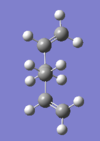 |
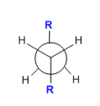 |
-231.69260 a.u | C1 |
| Gauche | 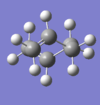 |
 |
-231.69167 a.u | C2 |
The objective of this exercice is to determine the activation energy of the Cope rearrangement of 1,5-hexadiene. In general, calculated activation energies and enthalpies are based on the lowest energy conformation of a reactant molecule. This assumes that the reaction pathway starts from the lowest energy structure (most populated structure), through the highest activation energy, and under the lowest rate of reaction. Therefore, in order to study the reaction pathway, it is necessary to find the lowest energy conformation.
The geometries of several other conformations were investigated. Their energies, symmetries and structures were reported in Table 2. These were compared to those provide in the Appendix 1 of the instructions, and good agreement were found between them.
| Conformer | Structure | Point Group | Energy HF/3-21G a.u | Relative Energy kcal/mol | Files |
|---|---|---|---|---|---|
| Gauche1 |  |
C2 | -231.68772 | 3.10 | DOI:10042/to-13422 |
| Gauche2 |  |
C2 | -231.69167 | 0.62 | DOI:10042/to-13427 |
| Gauche3 |  |
C1 | -231.69266 | 0.00 | DOI:10042/to-13431 |
| Gauche4 |  |
C2 | -231.69153 | 0.71 | DOI:10042/to-13425 |
| Gauche5 |  |
C1 | -231.68962 | 1.91 | DOI:10042/to-13430 |
| Gauche6 |  |
C1 | -231.68916 | 2.20 | DOI:10042/to-13434 |
| Anti1 |  |
C2 | -231.69260 | 0.04 | DOI:10042/to-13441 |
| Anti2 |  |
Ci | -231.69254 | 0.08 | DOI:10042/to-13442 |
| Anti3 |  |
C2h | -231.68907 | 2.25 | DOI:10042/to-13444 |
| Anti4 |  |
C1 | -231.69097 | 1.06 | DOI:10042/to-13446 |
Despite the prediction made from steric consideration that an anti conformer should lie lower in energy than a gauche conformer, the calculations performed suggest that the conformer Gauche 3 is actually the lowest in energy, at the HF/3-21G level. The relative stability of the gauche conformer has indeed be reported in the literature [4], and can probably be rationalize by second order perturbations. Three conformers (gauche 3 and anti 1 & 2) appear to be very close in energy, and to assess their relative energies, these were resubmitted to the Gaussian for an optimisation using a higher level of theory.
# opt b3lyp/6-31g(d) geom.=connectivity
- B3LYP: Density Functional Theory (DFT) calculation method. DFT is an alternative ab initio method, in which the total energy is expressed in terms of the total electron density rather than the wavefunction. This calculation uses an approximate Hamiltonian and an approximate expression for the total electron density [1].
- 6-31g(d)=6-31G*: higher level theory triply split-valence basis set (compared to the previously used 3-21g).
| Conformation | Energy B3LYP/6-31G* | ΔEnergy B3LYP/6-31G* kcal/mol | Files |
|---|---|---|---|
| Gauche3 | -234.611329 a.u | 0.29 | DOI:10042/to-13454 |
| Anti 1 | -234.611791 a.u | 0.00 | DOI:10042/to-13452 |
| Anti 2 | -234.611703 a.u | 0.06 | DOI:10042/to-13453 |
After an higher level optimisation, it appears that indeed the gauche conformer is actually higher in energy than the two lower energy anti (1 & 2).
The geometries of the anti 2 conformer after each of the two optimisations was compared and the characteristics of the structures are reported in Table 3.
| Calculation/ Method | Energies (a.u) | Point Group | C=C | C3-C4 | C2-C3 = C4-C5 | C2-C3-C4 | C1-C2-C3 |
|---|---|---|---|---|---|---|---|
| HF/3-21G | -231. 692535 | Ci | 1.316 Å | 1.553 Å | 1.509 Å | 111.3˚ | 124.8˚ |
| B3LYP/6-31G* | -234. 611706 | Ci | 1.334 Å | 1.548 Å | 1.504Å | 112.7˚ | 125.3˚ |
While the symmetry of the molecule is not changed, the geometry is non-the-less slightly modified, in terms of bond lengths and bond angles, as can be seen from Table 3. The difference between the energy values from the two methods is however much more pronounced. But these cannot be compared as they have been calculated using two different methods, and only energies obtained from the same method can be compared.
The energies reported above represent the energies of the molecules on the bare potential energy surface. These correspond to the electronic energy of the 'point structure' corresponding to the optimized geometry. However, even at 0K, the molecule has some zero point energy which needs to be taken into account. This means that to be able to compare the computed energies with experimentally measured quantities, these need to be corrected to account for a number of energy contributions. These are computed from a frequency calculation and can be accessed by looking at the thermochemistry section of the output file.
The frequency calculations are also required to characterize the critical point (ie: the structure reported as being the optimum one), by confirming it is a minimum in the potential energy surface, in which case all the vibrational frequencies should be real and positive.
The optimized B3LYP/6-31G* structure of the anti 2 conformer was submitted to the Gaussian for a frequency calculation using the same level of theory
# freq b3lyp/6-31g(d) geom=connectivity
Looking at the output file DOI:10042/to-13457 it was checked that all the frequencies were positive and real (see Figure 1 for the resulting vibrational spectrum), and looking at the file under the Thermochemistry section allowed to access the following informations.
- Thermochemistry -
Zero-point correction=                           0.142491 (Hartree/Particle)
Thermal correction to Energy=                    0.149847
Thermal correction to Enthalpy=                  0.150791
Thermal correction to Gibbs Free Energy=         0.110881
Sum of electronic and zero-point Energies=           -234.469212
Sum of electronic and thermal Energies=              -234.461856
Sum of electronic and thermal Enthalpies=            -234.460912
Sum of electronic and thermal Free Energies=         -234.500822
| Energy contribution | Values at 298.15 K | Values at 0 K | Description | Formula |
|---|---|---|---|---|
| Sum of electronic and zero-point energy | -234.469242 | -234.469212 | Potential energy at 0 K including the zero point energy | E= E0 + ZPE |
| Sum of electronic and thermal energies | -234.461887 | -234.469212 | Energy at 298.15 K and 1 atm. | ETot= E+ EVib + ERot+ ETrans |
| Sum of electronic and thermal enthalpies | -234.460943 | -234.469212 | Correction for RT | H= E0 + RT |
| Sum of electronic and thermal free energies | -234.500831 | -234.469212 | Entropic contributions to the free energy | G= H-TS |
These temperature corrections can alternatively be calculated directly by running the following method
# freq=readisotopes b3lyp/6-31g(d) guess=read
specifying the program to run the frequency calculation at 0.0001 K and 1 atm of pressure. From the output file DOI:10042/to-13521 , under the termochemistry section, the following data was obtained.
Sum of electronic and zero-point Energies=           -234.469212
Sum of electronic and thermal Energies=              -234.469212
Sum of electronic and thermal Enthalpies=            -234.469212
Sum of electronic and thermal Free Energies=         -234.469212
As expected, when the calculation is run at 0K (0.00001 K), no thermal correction is observed.
Optimizing the "Chair" and "Boat" Transition Structures
The transition state of a chemical reaction is a first order saddle point on a potential energy surface. This means that the transition state search attempts to locate a stationary point (ie: a point of the potential energy surface where the forces are zero, dV/dr=0), but which is also a maximum in one direction (reaction coordinate) and a minimum in all other directions. Therefore, the structure associated with the 1st order saddle point will exhibit one imaginary frequency, and the normal mode of vibration of this frequency should simulate the motion of the atoms along the reaction coordinate [1]. The description of the unique negative frequency can be explained by the following:
- dV/dr describes the curvature of the function. dV/dr =0 at a given geometry ⇔ this geometry is a minimum/maximum in the potential energy surface.
- d2V/dr2 describes the sign of the curvature = k where k = force constant of the harmonic oscillator (when approximating the reaction in classical terms).
Therefore, a minimum in the potential energy surface will have: d2V/dr2 = k > 0 and a maximum will have: d2V/dr2 = k < 0 Since ʋ=1/2(k/μ)½, then a transition structure, which has d2V/dr2 < 0, will have an imaginery frequency ʋ~(-|k|)½.
Optimization of the chair structure
An allyl fragment was drawn in GaussView and optimized using the following method:
# opt hf/3-21g geom=connectivity
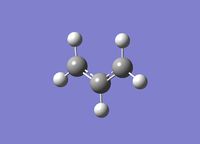
The optimized structure DOI:10042/to-13476 was copied twice and the two fragments were aligned as to come up with a first guess of the chair transition structure, setting the distance between the two allyls fragments to be roughly equal to 2.2 Å.
This first transition state structure was then optimized using two different methods: either by computing the Hessian matrix or by applying the frozen coordinate method.
The former method basically consists of computing the force constants for different geometries, searching for the structure with a zero force constant in the reaction coordinate. However, if the guessed structure is very far from the transition structure this method may not work, in which case the alternative frozen method can be used, which consists of freezing the molecule along the reaction coordinate, and minimizing the rest of the molecule.
Computing the Hessian Matrix
The guessed structure was submitted to the Gaussian for an optimization as a transition state (berny) using the following method:
# opt=(calcfc,ts,noeigen) freq hf/3-21g geom=connectivity
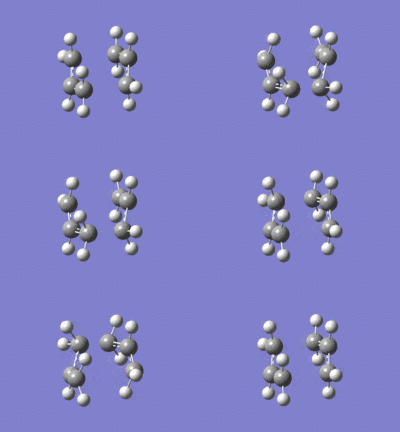
By looking at the output file DOI:10042/to-13477 , it can be seen that the frequency list features a negative (imaginary) frequency at - 818 cm-1. This frequency indeed corresponds to the Cope rearrangement, as can be seen in Animation 1.
Using the frozen coordinate method
The frozen coordinate method was run in parallel to optimize the chair transition structure. The guessed structure was reopened in GaussView, and using the redundant coordinate editor, the bond distance between the two sets of terminal carbons from the allyl fragments were frozen to a distance of 2.2 Å. The structure was submitted to the Gaussian using the following method
# opt=modredundant hf/3-21g geom.=connectivity
why is it that be looking at a minimum NOTE: optimization done like if we were looking for a minimum. Is it because the TS is a minimum in all except one (reaction coordinate) direction?
The structure obtained from this first optimization DOI:10042/to-13481 was then resubmitted for an optimization of the bond-forming distances. The frozen distances between the two allyls were removed, and the bonds were set to Derivative in the redundant coordinate editor. The structure was then resubmitted with the following method:
# opt=(ts,modredundant) freq hf/3-21g geom.=connectivity

The structure obtained features a unique imaginary vibration at -818 cm-1 and its geometry isvery similar to the one obtained using the first method DOI:10042/to-13482 .
Comparison of the results from the two methods
The main data from the two methods used are summarised in Table 5. The two methods yield exactly the same results (energies, frequencies), to the level of accuracy of the calculations performed.
| Calculation/ Method | Energies HF/3-21G (a.u) | Imaginary frequency |
|---|---|---|
| Hessian matrix | -231.61932 | -818 cm-1 |
| Frozen coordinate | -231.61932 | -818 cm-1 |
Optimization of the boat transition structure
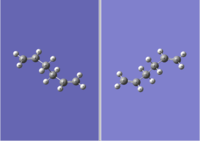
The boat transition structure was optimized using the QST2 method. This method requires to specifiy the reactants and the products of a reaction and the calculation will interpolate the two structures to try to find the transition state between them. The first step consisted in manually numbering the reactants and product in the same way (see Figure 3).
The structures were submitted to the Gausssian using the following method.
# opt=qst2 freq hf/3-21g geom=connectivity
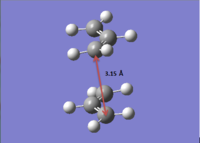
This first calculation failed DOI:10042/to-13484 . The structure generated was that of a dissociated chair transition state and nothing like the desired boat structure (see Figure 4). To ensure that the program does generate the desired structure, the geometries of the reactants and products were manually edited before submission so that they were closer to the boat transition structure DOI:10042/to-13483 .
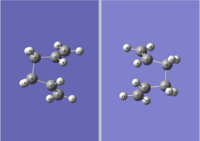
The C2-C3-C4-C5 dihedral angle was changed to 0˚and the C2-C3-C4 and C3-C4-C5 angles were reduced to 100˚(the Cn numbering refers to the reactant structure in Figure 3). The structures were resubmitted for calculation, using the same method, and this time the calculation was completed. DOI:10042/to-13483 .
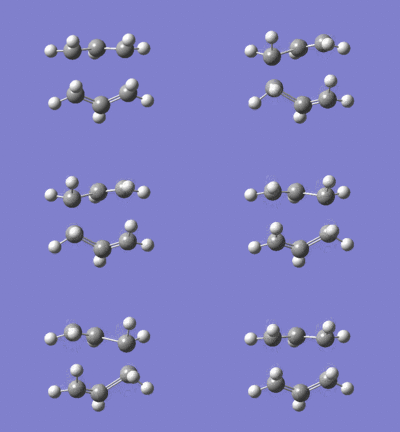
The computed boat transition structure now features a unique imaginery frequency at - 841cm-1, which confirms that a first order staddle point (transition state structure) was indeed obtained.
Table 6 summarises the differences between the chair and boat-like transition state structures. Again, the absolute values of the energies should not be considered on their own. However they do allow to determine the relative stability of the two geometries. ΔE= 10.36 kcal/mol, the chair transition structure is predicted to be lying 10.36 kcal/mol lower in energy than the boat one, at the HF/3-21G level of theory.
| Geometry | Energies HF/3-21G (a.u) | Imaginary frequency |
|---|---|---|
| Chair | -231.619322 | -818 cm-1 |
| Boat | -231.602801 | -841 cm-1 |
Intrinsic Reaction Coordinate
The last computational modelling that was performed before discussing the activation energy of the Cope rearrangement reaction was the Intrinsic Reaction Coordinate (IRC). An IRC is a type of minimum energy path connecting reactant, transition state and product. One of the use of the IRC is to check which product/ reactant the transition state that was determined connects to. An IRC is generated by computing the gradient downhill from the transition structure in either the forward, the reverse or both directions.
Mechanism via the Chair pathway
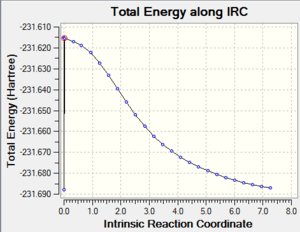
The chair transition structure obtained from the Hessian optimization was submitted to the Gaussian for an IRC calculation in the forward direction (towards products) using the following method:
# irc=(forward,maxpoints=50,calcfc) rhf/3-21g scrf=check guess=tcheck geom=connectivity
|
|
|---|
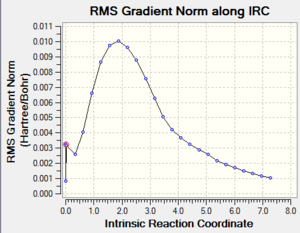
By looking at the result of the calculation reported in Table 7 DOI:10042/to-13491 , it clearly appears that the calculation hadn’t reached a minimum at this stage. The last point features a RMS gradient of 0.001, which is still too high for a completed calculation.
The last structure was therefore resubmitted for an optimization using at the HF/3-21G level of theory DOI:10042/to-13493 . The RMS gradient of the calculation was this time very close to zero after convertion of the calculation, suggesting that the structure was this time fully optimised to the level of theory used.
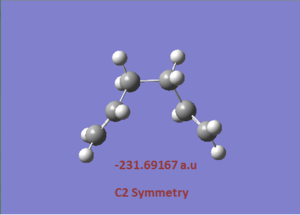
Thd product obtained was compared to the structures obtained in Table 1 and it was found that the structure obtained corresponds to the gauche 2 structure. This means eseentially means that the product formed by following the minimum energy pathway from the transition structure is the gauche 2 conformer. However, it is not the minimum energy conformer, which might only be found behind a energy barrier away from the minimum energy path.
To obtain this fully optimised structure, two alternative methods could have been used. The IRC could have been restarted after either specifying it to run for a larger number of points, or after specifying it to compute the force constants at every steps. However, the former method might not be appropriate because only 24 steps were run, when 50 had been specified. It would therefore probably be useless to specify the calculation to run for more steps.
Mechanism via the Boat pathway
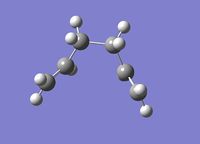
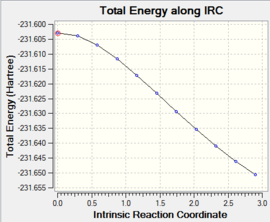
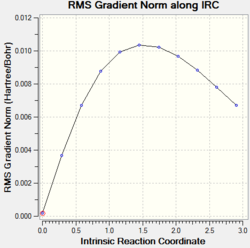
The IRC was computed from the boat transition structure using the same level of theory as above DOI:10042/to-13536 . It was again found that the calculation had not reached a minimum (see Table 8), so the last structure was therefore resubmitted for an optimisation at the HF/3-21G level of theory DOI:10042/to-13535 . The product obtained (see Figure 7) was again compared to the structures reported in Table 1, and it was found that the product obtained when going through the boat transition structure corresponded to the gauche 3 structure.
|
|
|---|
The IRC calculations therefore allowed to determine which product is obtained from the initial anti 2 conformer, when reacting via either the chair transition structure (gauche 2 product) or the boat transition structure (gauche 3 product).
Activation energy
The activation energies of the Cope rearragement via either the chair or boat transition state were finally discussed, with respect to the data computed. The chair and boat transition structures, previously optimized using an Hartree-Fock method, were however re-optimised using a higher level of theory (DFT) beforehand. Frequency calculations were carried in the same go. The structures were submitted to the Gaussian using the following script:
# opt=(calcfc,noeigen) freq b3lyp/6-31g(d) geom=connectivity
Boat transition structure: DOI:10042/to-13706
Chair transition structure: DOI:10042/to-13705
| Chair TS | Chair TS | Boat TS | Boat TS | Anti 2 | Anti 2 | |
|---|---|---|---|---|---|---|
| Method/basis set | HF/3-21G | B3LYP/6-31G* | HF/3-21G | B3LYP/6-31G* | HF/3-21G | B3LYP/6-31G* |
| Electronic energy | -231.619322 | -234.554467 | -231.602801 | -234.543093 | -231.692540 | -234.611703 |
| Sum of electronic and zero-point energies (0 K) | -231.466696 | -234.414929 | -231.450920 | -234.402342 | -231.539539 | -234.469212 |
| Sum of electronic and thermal energies (298.15 K) | -231.461337 | -234.409008 | -231.445286 | -234.396008 | -231.532566 | -234.461856 |
| Activation energy @ 0 K (Hartree) | 0.072843 | 0.054283 | 0.089339 | 0.066870 | / | / |
| Activation energy @ 0 K (kcal/mol) | 45.9 | 34.2 | 56.3 | 42.1 | / | / |
| Activation energy @ 298.15 K (Hartree) | 0.071229 | 0.052848 | 0.087280 | 0.065848 | / | / |
| Activation energy @ 298.15 K (kcal/mol) | 44.9 | 33.3 | 54.99 | 41.5 | / | / |
Experimental activation energies have been determined to be 33.5 ± 0.5 kcal/mol and 44.7 ± 2.0 kcal/mol at 0 K via the chair and boat transition structure respectively. This is in very good agreement with the data computed at the B3LYP/6-31G* level. The computational analysis of the reaction not only predicted that the chair transition structure of the Cope rearrangement of hexa-1,5-diene is lower in energy than its boat conformer, but also gives theoretical activation energies that are in very good agreement with what is observed experimentally. This first section of the module was therefore successful in showing how computational means can provide useful complementary information of the outcome of a chemical reaction.
Conclusion
This first section of Module 3 aimed to introduce us to some relatively simple computational methods, that can be used to analyze chemical reactions. The Cope rearrangement of hexa-1,5-diene was looked at. Three differents techniques were applied to pinpoint the two transition states possible for the reaction starting from the anti 2 conformer. Both the chair and boat like transition structures were located, and from these two structures, Intrinsic Reaction Coordinate calculations were run. These allowed to find out the products of the reaction via either transition state. Two levels of theory were used, and it appears that activation energies determined from the B3LYP/6-31G* level were in very good agreement with experimental values.
Part 2: The Diels Alder reaction
In this second section, the computational methods described and used in the previous section will be applied to study the Diels-Alder reaction, which is considered as a key organic synthetic reaction and the most common example of cycloaddition. The reaction involves two components which react via their π-systems, one of the two contributing with 4 electrons (diene), the other with two (dienophile). The electron count is 6 (4n+2), the reaction is therefore thermally allowed, proceeding via an Huckel transition state. This reaction will be looked at, aiming to understand some mechanistic aspects of the reaction and its characteristic regioselectivity. In the first place, the reaction of ethylene and cis-butadiene will be looked at as a general introduction to some of the properties of the Diels Alder reaction. Its regioselectivity will be further investigated by looking at the reaction between cyclohexadiene and maleic anhydride.
Ethylene & cis butadiene reaction
A molecule of cis- butadiene was drawn in GaussView 5.0 and optimised using the following method
# opt am1 geom=connectivity
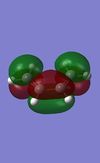
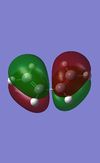
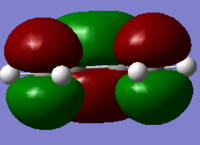
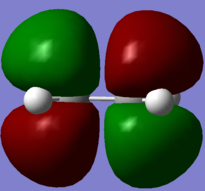
In parallel, a molecule of ethene was drawn and optimised, using the same level of theory. The HOMO/LUMO of the two molecules were visualised from the computed data, and these are reported in Table 10. These four molecular orbitals are asymmetric with respect to the plane of the molecule. And more importantly in terms of reactivity, the butadiene HOMO and the ethene LUMO are both antisymmetric with respect to the σv plane, while the butadiene LUMO and the ethene HOMO are symmetric with respect to this σv plane. Only orbitals of the same symmetry will overlap and allow to form a new bond, and this complementary relationship between the two sets of HOMO/LUMO of the diene and dienophile fragment characterises the Diels Alder reaction.
| Molecule | HOMO | LUMO |
|---|---|---|
| Butadiene | 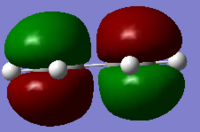 . .
|
 . .
|
| Ethene |  . .
|
 . .
|
Interestingly, it is found that while the cycloaddition of ethene and butadiene does proceed, it only does so at high temperatures (165°C), high pressure and in low yield [5]. It is indeed usualy found that the Diels Alder reaction requires the dienophile to carry an EWG substituent. The effect of this substituent on the rate of reaction has been explained by considering the frontier orbitals of the two fragments. An attempt will be made to illustrate this effect using computational methods (see section 2.1.3).
Transition state
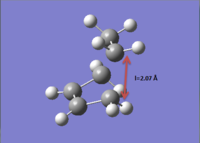
The transition state of the Diels-Alder reaction of butadiene and ethene was calculated by computing the Hessian matrix from a guessed structure. This structure was composed starting from a bicyclo system, and removing the two additional CH2-CH2 atoms. The two fragments were positioned manually to set an interfragment distance of about 2.2 Å.
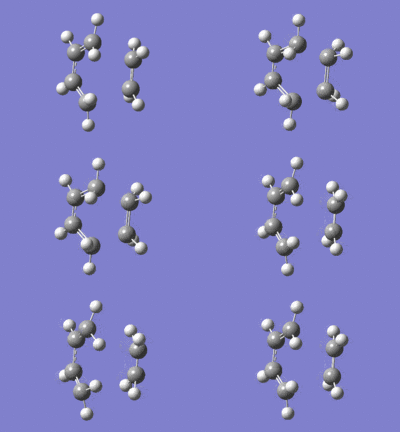
.
The structure was then submitted to the Gaussian for an transition state (Berny) optimisation at a low level of theory:
# opt=(calcfc,ts,noeigentest) freq am1 geom=connectivity
The transition structure generated DOI:10042/to-13530 features a unique imaginary frequency at -956 cm-1. The energy of the structure was computed to be 0.11165465 a.u, and the RMS gradient(0.00000989) was low enough to suggest that a stationary point was indeed found, at the corresponding level of theory. The vibration along reaction coordinate does indeed correspond to the Diels-Alder reaction of ethene and butadiene.
Because the AM1 method is not a high level of theory, the optimised transition structure obtained was resubmitted for a transition (berny) optimisation at a higher level, using the following method:
# opt=(calcfc,ts,noeigen) freq b3lyp/6-31g(d) geom=connectivity
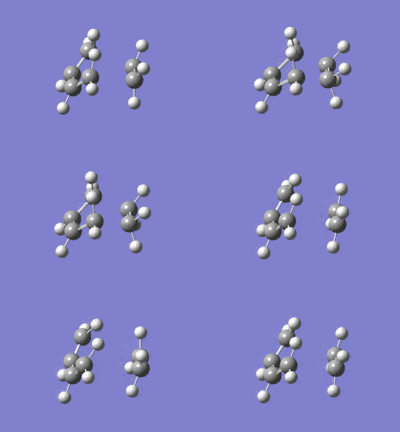
.
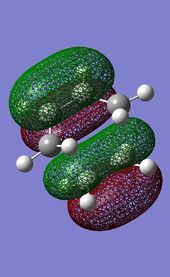
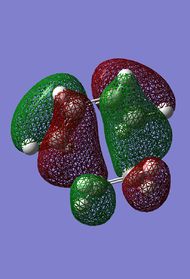
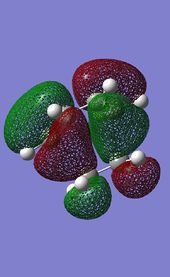
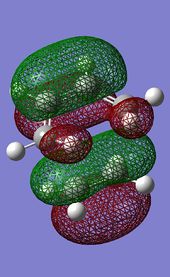
DOI:10042/to-13529 The transition structure generated at this level features a unique imaginary frequency at -525 cm-1, and an energy of -234.54390 a.u. The RMS gradient of the calculation is low enough (0.00000805) to suggest that a statioanry point was indeed found. The vibration corresponding to the imaginary frequency is very similar to that computed using the AM1 method and can be observed in Figure 2.4. The large difference in the vibration frequencies along the reaction coordinate obtained from the two methods is due to the very different level of theory programmed in the two optimisation methods used. A interesting observation can be made when comparing the HOMO/HOMO-1 molecular orbitals of the transition structure computed under the two methods.
| HOMO-1 AM1 | HOMO-1 DFT | HOMO AM1 | HOMO DFT |
|---|---|---|---|
|
 . .
|
 . .
|
 . .
|
Interestingly, it can be seen that the two methods of calculation seem to have inversed the HOMO and HOMO-1 orbitals (ie: HOMO-1 from AM1 method corresponds to HOMO of DFT method and vice versa). The HOMO-1 (DFT)/ HOMO (AM1) corresponds to the orbital overlap between the two fragments required for the Diels-Alder reaction to proceed.
Intrinsic Reaction Coordinate
An Intrinsic Reaction Coordinate calculation was run from the transition structure optimised at the B3LYP level, using the following method:

# irc=(forward,maxpoints=50,calcfc) rb3lyp/6-31g(d) geom=connectivity
The calculation stopped after 19 structures DOI:10042/to-13533 and the optimisation had not yet completed. The last structure of the IRC gradient was therefore re-optimised using the following method
# opt freq b3lyp/3-21g geom=connectivity
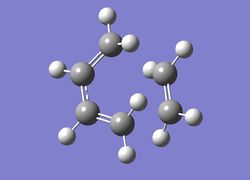
The product expected for the Diels Alder reaction between cyclodexadiene and ethene was in this way obtained (see Figure 2.4) DOI:10042/to-13534 .
This seems to confirm that the right transition geometry has been computed. Since the reaction is not symmetrical (reactants ≠ products), the IRC calculation was repeated DOI:10042/to-13538 in the reverse direction (towards reactants), again re-optimising the last structure from the IRC calculation using the same level of theory as above DOI:10042/to-13537 .
The output of the calculation generated the two reacting fragments (see Figure 2.5), the butadiene and ethene, which again seems to confirm that the right transition structure had been found. It also illustrates how useful the IRC computation can be, allowing to follow a minimum reaction pathway from the starting material(s), up to the transition state and down again to the product(s).
Further Discussion: Investigating the effect of substituents on the dienophile
An attempt was made to investigate the effect upon the activation energy of the Diels Alder reaction when placing substituents on the dienophile. It has been reported that most Diels Alder reactions require the dienophile to carry an electron withdrawing substituent to takes place at a reasonable rate [5]. This has been explained by suggesting that the presence of the electron-withdrawing group lowers the energy of the LUMO of the dienophile.
A few issues cropped up when looking at this effect. A first attempt intended to compute the molecular orbitals of ethene molecules carrying different substituents at the HF/3-21G level, and comparing the energies of the LUMO. However, this method was abandonned because it was believed that these energies were likely not to be accurate enough to be the basis of any discussion.
The second method used, aimed to illustrate the effect based upon the transition structure energies. The objective was to determine the relative activation energies of the reaction when using different dienophiles, aiming to relate the changes in activation energies to the inductive and resonance effects of the substituents. All energies were computed at the B3LYP/6-31G* level. The energies of butadiene and the substituted ethene molecules were determined and these were put in relation to the corresponding transition structure energy. All energies were corrected for the thermal vibrations: the energies were all obtained from the sum of electronic and thermal vibrations. By taking the difference between the transition energy and the energies of the butadiene and substituted ethene fragment, a value for the activation energies was obtained for the different reactions. These are reported in Table 11.
| Substituents | Transition State Energy | Dienophile Energy | Diene Energy | Activation Energy a.u | Activation Energy kcal/mol |
|---|---|---|---|---|---|
| H | - 234.396907 a.u | - 78.533189 a.u | - 155.89644 a.u | 0.032722 a.u | 20.61 kcal/mol |
| Br | - 2805.510117 a.u | - 2649.6466 a.u | - 155.89644 a.u | 0.032918 a.u | 20.74 kcal/mol |
| Cl | - 694.000297 a.u | - 538.139008 a.u | - 155.89644 a.u | 0.035151 a.u | 22.15 kcal/mol |
| F | - 333.633452 a.u | - 177.772009 a.u | - 155.89644 a.u | 0.034997 a.u | 22.05 kcal/mol |
| CN | - 326.644622 a.u | - 170.776425 a.u | - 155.89644 a.u | 0.028243 a.u | 17.79 kcal/mol |
| SiH3 | - 525.075161 a.u | - 369.212391 a.u | - 155.89644 a.u | 0.03367 a.u | 21.21 kcal/mol |
The data computed does seem to show that the substituents on the dienophile have the expected effect on the activation energy. Taking the reaction of butadiene ethene as a reference, one observes that the presence of an electron withdrawing group (CN) effectively reduces the activation energy, while the presence of an electron donating group SiH3 increases the activation energy. Rationalizing the effect of the halides on the activation energy, is somehow less straighforward, as indeed it seems that despite being strongly electronegative, the halides substituents seem to effectively increase the activation energies. However, the LUMO of the ethene based molecule is a π-type system and the inductive effect along the σ-bond expected for highly electronegative elements is quite likely not to have much of an influence on the LUMO of the molecule. However, all these molecules have is necessary to refer to the Hammett parameters of these substitutents. Indeed, if all elements have an inductive effect (σ symmetry), some and including the halogens have an additional resonance effect (π-symmetry). The inductive effect of the halogens is very powerful and more than compensates their resonance effect, which explains why they are generally considered as electron withdrawing groups. However, in this particular case, it is assumed that the relative activation energy, which is the focus of this discussion, is determined by the relative energy of the LUMOs. Therefore, the determinant factor here is the resonance effect, and this explains the increase in the activation energy computed for the reaction with the halide substituted ethene molecule. The following σR values are tabulated and reported in the literature [6] for the three studied halides:
- σRF: -0.28
- σRCl: -0.14
- σRBr: -0.16
From the Hammett parameter, it is expected that the fluorine should have the greatest resonance effect, and should therefore result in the greatest activation energy. This is indeed what was predicted computationally. The qualitative fit of the computationally predicted activation energies and the Hammett parameters however stops here, but this is not surprising considering the simple description of the reactive system (A big approximation is, for example, certainly made when assuming that the energy of the two isolated diene and dienophile fragments accounts for the energy of the starting materials. Indeed, one would expect the energy of the two fragments to be modified in each other's presence).
Note: the energy was not computed for iodine, even though would have been interesting to complete the halide serie, because the B3LYP/6-31G* method can not cope with its high molecular mass.
Cyclohexa-1,3 diene & maleic anhydride reaction
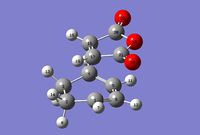
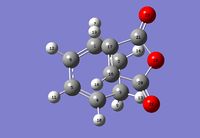
In this second subsection, the Diels-Alder reaction was studied using a different reacting system, in order to observe and rationalize the regioselectivity of the reaction when the dienophile is asymmetric. The reaction between cyclohexa-1,3 diene & maleic anhydride was looked at.
To locate the transition structure of the reaction, the first step consisted in drawing the structure of the two fragments in GaussView, and optimising it at the HF/3-21G level. The optimised structures were brought together as a guess structure of the transition state, aligning the diene and dienophile for the cylcloaddition to take place. Two alignements are possible, giving rise to the endo or exo selectivity of the reaction. An attempt was made to use the Hessian matrix method to determine the transition structure, but it rapidly became obvious that getting the right bonds to react with each other would be tricky, so the method was abandonned in favour of the frozen coordinate one.
Alignement 1: Endo product
The frozen coordinate method was used to optimise and locate the transition geometry. The two pairs of carbons forming a bond in the reaction were frozen at a bond lengh of 2.20 Å. The structure was then submitted for optimisation as a minimum using the following method
# opt=modredundant hf/3-21g geom=connectivity
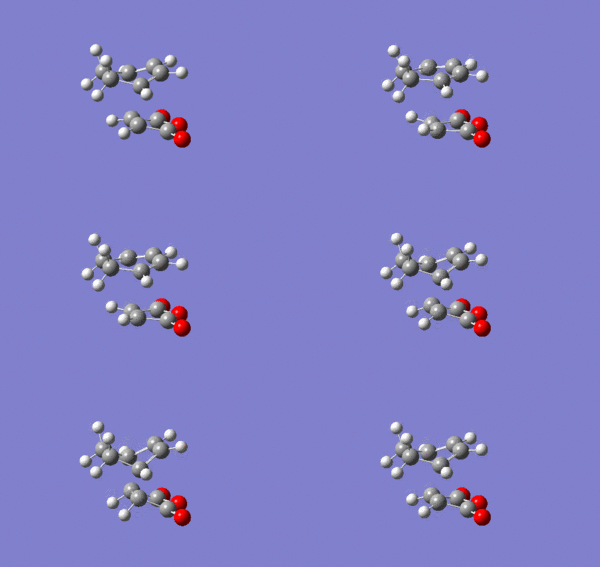
The structure generated DOI:10042/to-13542 was reoptimised by setting the two bonds forming as derivative and submitting the structure for a transition optimisation (berny) and frequency calculation.
# opt=(calcfc,ts,modredundant) freq rhf/3-21g geom=connectivity
The computed structure DOI:10042/to-13543 features a unique imaginary frequency at -645 cm-1 and has a predicted energy of -605.610368 au (see Figure 2.5) at the HF/3-21G level.
To determine which product (endo/exo) is obtained from this alignement, as well as to ensure that the transition structure does indeed correspond to the Diels-Alder reaction, an IRC was calculated DOI:10042/to-13545 using the following method
# irc=(forward,calcfc) rhf/3-21g geom=connectivity
and the last structure computed was resubmitted DOI:10042/to-13544 for an HF/3-21G optimisation. The product structure obtained can be vizualised here, and clearly corresponds to the endo product.
Alignement 2: Exo product
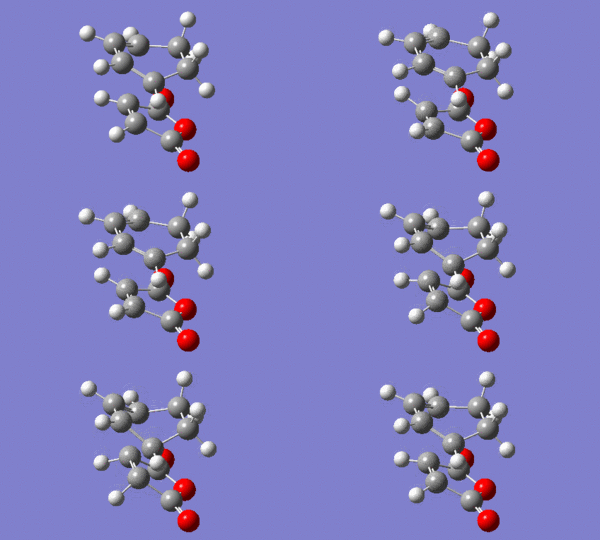
Energy -605.603591 a.u Frequency of imaginary vibration: -648 cm-1
The alternative exo transition structure was computed using the same method as described above for the endo geometry. The frozen coordinate method was used DOI:10042/to-13564 and the computed structure was resubmitted for a bond optimisation as a berny transition structure DOI:10042/to-13563 . The IRC was computed from the exo transition structure in the forward direction DOI:10042/to-13562 , and the last structure was re-optimised DOI:10042/to-13565 . All these calculations were performed at the HF/3-21G theory level. The product obtained following the exo pathway, unsurprisingly corresponds to the exo product, which can be vizualised here.
Discussion
The two transition geometries were identified, and the IRC computations has allowed to confirm that each transition geometry generates either the endo or the exo product. Table 12 summarises the main calculated results with respected to the two transition structures. Crucially, the endo structure is predicted to be lower in energy than the exo one, with a difference in energy of 4.27 kcal/mol.
| Energy HF/3-21G | Energy HF/3-21G | Imaginary frequency |
|---|---|---|
| Endo TS | - 605.603591 a.u | - 648 cm-1 |
| Exo TS | - 605.610368 a.u | - 645 cm-1 |
| Endo Product | - 605.721321 a.u | / |
| Exo Product | - 605.718735 a.u | / |
| Endo Product B3LYP/6-31G* | - 612.758290 a.u | / |
| Exo Product B3LYP/6-31G* | - 612.755785 a.u | / |
Experimentally, it has been observed that the exo product is the thermodynamically preferred isomer, as it is formed predominantly under equilibrating conditions. The exo conformation is therefore expected to be lower in energy than the endo product. This is also was is expected from steric considerations, as the endo geometry places the anhydride functional group in a more hindered environment, compared to the exo form.
This was however not predicted from the data computed at the HF/3-21G level of theory. The two product structures were resubmitted for an optimisation at a higher level at a B3LYP/6-31G* level [Exo: DOI:10042/to-13619 ; Endo DOI:10042/to-13620 ], but again, the endo conformer was predicted to be more stable than the exo one. The calculations performed therefore suggest that the endo product is both the kinetic product (lower energy transition state) and the thermodynamic product (lower energy product).
It has been observed that the Diels-Alder reaction tends to be kinetically controlled, therefore proceeding via the lowest energy transition state.
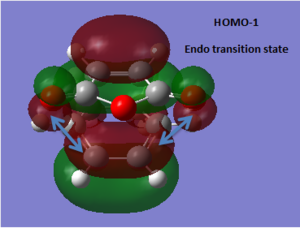
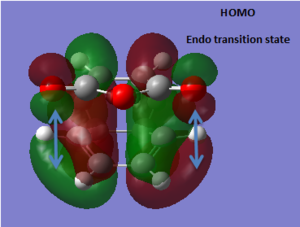
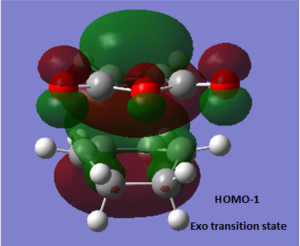
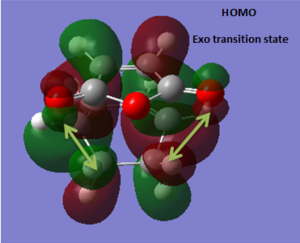
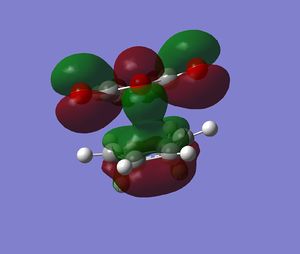
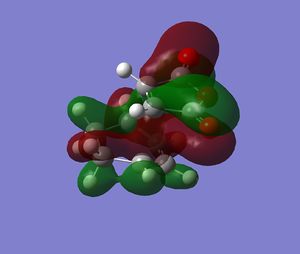
The endo transition structure is predicted, at the level of theory used, to be lower in energy than the exo one, with a difference in energies between the two structures of 4.25 kcal/mol at the HF/3-21G level. The stability of the endo transition structure has been explained by secondary orbital overlap which, even though does not lead to bond formation seems to contribute to the relative stabilisation of the endo transition structure. The HOMO orbitals (and HOMO-1) of the two transition geometries were looked at and were reported in Tables 8 & 9.
Table 13 shows the HOMO and HOMO-1 of the endo product. In both molecular orbitals (MOs) a π-type secondary interaction between the p-type orbital of the maleic anhydride fragment and a π-orbital delocalised along the diene moeity seem possible with respect to the symmetry of the orbitals concerned.
| HOMO-1 ENDO | HOMO ENDO |
|---|---|
 . .
|
|
In the other hand, looking at the corresponding orbitals in the exo transition structure, these π-type secondary interactions do not seem possible, as the diene and the anhydride moeity are no longer aligned. The later is now aligned with a σ-type orbital which doesn't have the appropriate symmetry for effective overlap. Therefore, from the purely the pictorial representation of the MOs, it seens possible to rationalize the relative stability of the endo transition structure.
| HOMO-1 EXO | HOMO EXO |
|---|---|
 . .
|
 . .
|
An attempt was however made to try to obtain slighly more quantitative understanding of these presupposed secondary orbital overlaps. The Natural Bond Orbitals (NBOs) of both structures were computed, and the interactions with significant energy E(2) / kcal mol-1 are reported below.
Endo transition structure
Second Order Perturbation Theory Analysis of Fock Matrix in NBO Basis
    Threshold for printing:   0.50 kcal/mol
   (Intermolecular threshold: 0.05 kcal/mol)
                                                                             E(2)  E(j)-E(i) F(i,j)
        Donor NBO (i)                     Acceptor NBO (j)                 kcal/mol   a.u.
 12. BD (   2) C   4 - C   5        /135. BD*(   2) C  20 - O  22            4.59    0.50    0.045
  3. BD (   2) C   1 - C   6        /137. BD*(   2) C  21 - O  23            4.59    0.50    0.045
 11. BD (   1) C   4 - C   5        /135. BD*(   2) C  20 - O  22            0.09    1.14    0.009
 12. BD (   2) C   4 - C   5        /137. BD*(   2) C  21 - O  23            0.27    0.50    0.011
The only significant second order perturbation are found between the C4-C5 & C1-C6 and C20=O22/C21=O23 respectively (E2=4.59 kcal/mol). All other interactions that are not involved in the C-C bond formation are very close to zero.
An NBO analysis was computed for the endo transition structure, but no significant second order interaction were preidtcted for the exo transition structure. The relevant section of the output file indeed does not show any interations that could potentially stabilise the exo transition structure.
 Exo transition structure
                                                                               E(2)  E(j)-E(i) F(i,j)
        Donor NBO (i)                     Acceptor NBO (j)                 kcal/mol   a.u.
From cyclohexadiene to maleic anhydride
  1. BD (   1) C   1 - C   2        /137. BD*(   2) C  21 - O  23            0.12    1.00    0.010
  8. BD (   1) C   3 - C   4        /135. BD*(   2) C  20 - O  22            0.12    1.00    0.010
From maleic anhydride to cyclohexadiene
 26. BD (   2) C  20 - O  22        /118. BD*(   1) C   3 - H   9            0.06    1.24    0.008
 26. BD (   2) C  20 - O  22        /119. BD*(   1) C   3 - H  13            0.76    1.26    0.028
 26. BD (   2) C  20 - O  22        /120. BD*(   1) C   4 - C   5            0.09    1.38    0.010
 26. BD (   2) C  20 - O  22        /121. BD*(   2) C   4 - C   5            0.07    0.71    0.007
 28. BD (   2) C  21 - O  23        /111. BD*(   1) C   1 - C   6            0.09    1.38    0.010
 28. BD (   2) C  21 - O  23        /112. BD*(   2) C   1 - C   6            0.07    0.71    0.007
 28. BD (   2) C  21 - O  23        /115. BD*(   1) C   2 - H   8            0.06    1.24    0.008
135. BD*(   2) C  20 - O  22        /118. BD*(   1) C   3 - H   9            0.12    0.54    0.024
135. BD*(   2) C  20 - O  22        /119. BD*(   1) C   3 - H  13            0.06    0.56    0.017
137. BD*(   2) C  21 - O  23        /115. BD*(   1) C   2 - H   8            0.12    0.54    0.024
137. BD*(   2) C  21 - O  23        /116. BD*(   1) C   2 - H  14            0.06    0.56    0.017
The second order perturbation reported in the NBO data for the endo structure should therefore proivde an explnation to the relative stability of the endotransition structure.
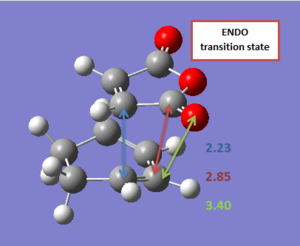
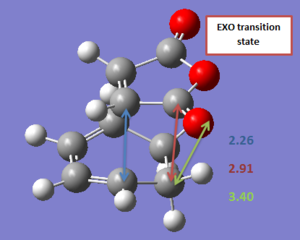
The geometry of the transition state was further described in terms of a few relevant bond lengths. These have been reported in Table 14 (for a pictorial represenation) and in Table 15 for a more concise description.
| Endo | Exo |
|---|---|
 . .
|
|
| Forming C-C bond | Anhydride C=O bond | Anhydride C-O bond | Through space anhydride CH2-CH2/CH=CH | |
|---|---|---|---|---|
| Endo | 2.23 Å | 1.19 Å | 1.39 Å | 2.85 Å |
| Exo | 2.26 Å | 1.19 Å | 1.40 Å | 2.91 Å |
Both transition structures are symmetrical, suggesting that the reaction is synchronous, which seems to be supported by the vibrations along the reaction coordinate. However the two transition structures show some slight differences in the bond lengths and through space distances between the two fragments. It seems indeed that the two fragments are brought closer to each other in the endo transition state, than in the exo one, especially when looking at the anhydride moiety and the opposite CH2-CH2/CH=CH fragment of the cyclohexadiene. This supports the idea of an orbital overlap between the π orbitals of the (C=O)-O-(C=O) and the CH=CH fragment in the endo structure. However, this difference in bond lengths (Δ=0.06 Å) is still small and any conclusion based upon it should probably be taken cautiously. It can also be observed that no difference in bond length was computed for the exo and endo C=O bond lengths. This is can seem surprising, considering that the secondary overlap observed in the endo transition structure corresponds to a transfer of electron density from the cyclohexadiene to the C=O antibonding bond of the maleic anhydride (cf. relevant NBO section). A lengthening of the bond could probably have been expected.
Endo NBO analysis: DOI:10042/to-13650
Exo NBO analysis: DOI:10042/to-13649
| HOMO-3 | HOMO-9 |
|---|---|
 . .
|
|
Further Discussion: Regioselectivity of the reaction of methoxybutadiene with acrolein
It is reported that methoxybutadiene reacts with acrolein to give more of the ortho product than the meta product [5] (see Scheme 1).
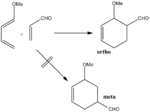
An attempt was made to try to rationalize this observation computationally. The transition structures corresponding to the two potential products (ortho / meta) were located using the frozen coordinate method, at the HF/3-21G level of theory.
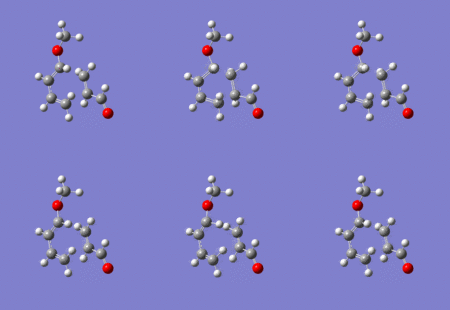
The energies (at 298.15K/ Sum of electronic and thermal energies) and the imaginary frequency of the two structures are reported in Table 17.
| Energy HF/3-21G | Imaginery Frequency | Files | |
|---|---|---|---|
| Ortho | - 456.743682 | - 692 cm-1 | DOI:10042/to-13731 |
| Meta | - 456.736977 | - 795 cm-1 | DOI:10042/to-13703 |
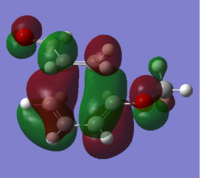
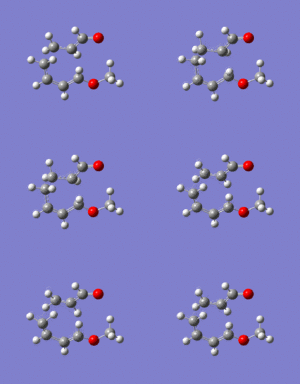
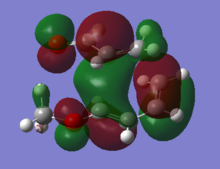
The HOMO of the two transition structures were plotted, and reported in Figures 2.10 and 2.11. The detail of the orbital overlap is different in the two cases. The HOMO of the meta product shows two medium strong interactions bringing the diene and dienophile together. The HOMO of the ortho product in the other hand shows a unique large interaction. Because of the greater stability of the ortho transition structure, it can therefore be suggested that the unique large bonding interaction is in the ortho transition structure is stronger than the two smaller ones observed in the meta transition geometry.
Second Order Perturbation Theory Analysis of Fock Matrix in NBO Basis
    Threshold for printing:   0.50 kcal/mol
   (Intermolecular threshold: 0.05 kcal/mol)
                                                                             E(2)  E(j)-E(i) F(i,j)
        Donor NBO (i)                     Acceptor NBO (j)                 kcal/mol   a.u.    a.u.
===================================================================================================
 ORTHO TRANSITION STRUCTURE
4. BD (   2) C   1 - C   4        /103. BD*(   2) C   8 - C  11          100.11    0.46    0.192
103. BD*(   2) C   8 - C  11        / 94. BD*(   2) C   1 - C   4          616.16    0.01    0.124
103. BD*(   2) C   8 - C  11        / 99. BD*(   2) C   6 - C  16           99.55    0.02    0.060
 13. BD (   2) C   8 - C  11        / 94. BD*(   2) C   1 - C   4           30.01    0.46    0.106
 13. BD (   2) C   8 - C  11        / 99. BD*(   2) C   6 - C  16           12.79    0.47    0.069
META TRANSITION STRUCTURE
 4. BD (   2) C   1 - C   4        /103. BD*(   2) C   9 - C  14           20.18    0.50    0.090
 4. BD (   2) C   1 - C   4        /107. BD*(   2) C  12 - C  16           27.05    0.49    0.103
 94. BD*(   2) C   1 - C   4        /103. BD*(   2) C   9 - C  14          179.18    0.02    0.088
 13. BD (   2) C   9 - C  14        / 94. BD*(   2) C   1 - C   4           31.55    0.48    0.111
 17. BD (   2) C  12 - C  16        / 94. BD*(   2) C   1 - C   4           43.60    0.49    0.130
Much stronger interactions are indeed observed in the NBO analysis of the ortho transition structure, compared to that of the meta transition structure. This supports the greater stability of the ortho transition structure, and therefore the major formation of the ortho product (assuming the reaction takes place under kinetic conditions).
Ortho structure NBO:DOI:10042/to-13751
Meta structure NBO:DOI:10042/to-13767
Conclusion
This second section focused on the Diels Alder reaction. The transition structures of a few reactive systems were located and analysed, in terms of relative energies and molecular interactions. The regioselectivity of these cycloadditions was discussed, and computational results were compared to experimental observations, with a general good agreement between the two.
This section was finally also used as the basis for some further investigations, applying some of the computational methods taught over the course of the entire computational lab. It is recognised that these calculations performed out of personal interest were probably not based upon a thorough understanding of the theory behind the methods used. However, even though more effective and appropriate computational methods could probably have been chosen, interesting effects were nonetheless observed and it was possible to put them in relation to experimental observations. Overall, the computed data obtained after running quick calculations, succeeded in illustrating how computational methods can provide some interesting insight into different properties of chemical reactions.
References
[1] Computational Chemistry and Molecular Modelling, K.I Ramachandran, G. Deepa, K. Namboori, Springer 2008. DOI:10.1007/978-3-540-77304-7 .
[2] Gaussian 09 User's Reference
[3] O. Wiest, K. A. Black, K. N. Houk, J. Am. Chem. Soc., 1994, 116 (22), pp 10336–10337, DOI:10.1021/ja00101a078 .
[4] B. Gung, Z. Zhu, R. Fouch, J. Am. Chem. Soc., 1995, 117 (6), pp 1783–1788, DOI:10.1021/ja00111a016 .
[5] Molecular orbitals and organic chemical reactions, I. Fleming, Wiley, 1935
[6] The Hammet Equation, C. D. Johnson, Cambridge University Press 1973
