
Rep:Mod:jfg06inorg
Introduction Module
Creating a Molecule of BH3
The molecule of BH3 was created as per the instructions, atom labels were added and rotation, translation, zooming in and out were practised. Other fragments were created one of which is the trivalent sulphur fragments shown on the left.
-
 Trivalent Sulphur Fragment
 -
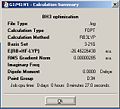 Results of BH3 Optimisation
 -
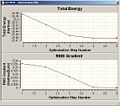 Graphs of Energy Gradient During BH3 Optimisation


The bond length of all of the B-H bonds was set to 1.5Å and the geometry optimised using the B3LYP method and a 3-21G basis set.
The optimised bond distance is 1.19435Å and the optimised H-B-H bond angle is 30.0000o. The full results are shown in a graphic but the optimisation looks like it has worked since the gradient is much less than 0.0001.
The results file was opened and examined. The output file was then opened along with the graphs showing the energies of the intermediate and final product and the optimisation gradient. The animation of the intermediate steps was examined and indeed there are no bonds present until the 4th optimisation since the B-H distances were initially too large.
Creating a Molecule of BCl3
The BCl3 molecule was created, the point group set to D3h and the tolerance set to very tight. The molecule was optimised; the B-H bond length was found to be 1.87Å and the H-B-H bond angle 30.0o. The complete results are shown on the right and reported to an appropriate level of accuracy in the adjacent table.

| File Type | Calc. Type | Method | Basis Set | Final Energy(H) +/-0.00038 | Dipole Moment(De) | Point Group | Calc. Time(s) |
|---|---|---|---|---|---|---|---|
| .log | FOPT | RB3LYP | LANL2MB1.26 | -69.43928 | 0.00 | D3h | 17 |
N.B. 1 kJ/mol = 0.00038 H
Creating My Own Small Molecule

Despite being a little unimaginative NH3 was chosen as a test molecule. The tetrahedral nitrogen fragment was selected from the "element fragment" option and the resulting NH3 molecule was minimised using a RB3LYP method and a 3-21G basis set to yield a molecule with the following properties in a calculation time of 21.0s.
xyz Coordinates
---------------------------------------------------------------------
Center     Atomic     Atomic              Coordinates (Angstroms)
Number     Number      Type              X           Y           Z
---------------------------------------------------------------------
   1          7             0        0.000000    0.000000    0.098260
   2          1             0        0.000000    0.968267   -0.229273
   3          1             0       -0.838544   -0.484134   -0.229273
   4          1             0        0.838544   -0.484134   -0.229273
---------------------------------------------------------------------
The bond angle was measured at 1.022Å to 3.sf and the HNH bond angle is 11oo with respect to the z axis and 34.9o with respect to the x and y axes. . The dipole moment of the molecule is 1.87 Debye to 3s.f. and the point group is as expected C3v. The final energy of the ammonia molecule is -56.2H to 3s.f..
The output log file can be viewed here https://www.ch.ic.ac.uk/wiki/images/8/87/JFG_NH3_OPT.LOG
Vibrational Analysis
The output file previously created from the BH3 optimisation was submitted for a frequency calculation. The addition keywords pop=(full,nbo) were added as this instructs the programme to calculate a full set of MO's. The energy was compared to the previous one and since this had not changed the next exercise was started.
The vibrational analysis window was opened and the vibrations viewed one by one with the displacement vectors displayed. The results of the frequency calculation are shown in the following table.
| No. | Form of Vibration | Frequency | Intensity | Symmetry D3h Point Group |
|---|---|---|---|---|
| 1 |  All hydrogens move downward in a concerted fashion. The B atom moves up and down slightly in the opposite direction to the hydrogens. |
1145.71 | 92.6991 | A2 |
| 2 |  The two hydrogens with displacement vectors scissor backwards and forwards whilst the other hydrogen and boron bond remains fairly rigid. |
1204.66 | 12.3789 | E' |
| 3 |  The two hydrogens towards the bottom of the graphic rock left and right whilst the other hydrogen also rocks but in the opposite direction. |
1204.66 | 12.3789 | E' |
| 4 |  | | All hydrogens move in and out whilst the boron atom remains central and stationary. |
2592.79 | 0 | A' |
| 5 |  The two bottom hydrogens stretch asymmetrically whilst the boron atom moves slightly to the left and right towards the compressed bond. The third hydrogen remains stationary. |
2731.31 | 103.837 | E' |
| 6 |  Similar to vibration 4 but the top hydrogen oscillates inward when the bottom to hydrogens oscillate outward. the boron moves slightly in the direction of the upward hydrogen bond; up when this hydrogen is compressed and down when it is stretched. |
2731.31 | 103.83 | E' |
It is worth commenting that this information can be found in the log file.
Harmonic frequencies (cm**-1), IR intensities (KM/Mole), Raman scattering
activities (A**4/AMU), depolarization ratios for plane and unpolarized
incident light, reduced masses (AMU), force constants (mDyne/A),
and normal coordinates:
                    1                      2                      3
                   A"                     E'                     E'
Frequencies --  1145.7148              1204.6589              1204.6599
Red. masses --     1.2531                 1.1085                 1.1085
Frc consts  --     0.9691                 0.9478                 0.9478
IR Inten    --    92.6991                12.3789                12.3814
Atom AN      X      Y      Z        X      Y      Z        X      Y       Z
  1   5     0.00   0.00   0.16     0.00   0.10   0.00    -0.10   0.00   0.00
  2   1     0.00   0.00  -0.57     0.00   0.08   0.00     0.81   0.00   0.00
  3   1     0.00   0.00  -0.57    -0.38  -0.59   0.00     0.14   0.38   0.00
  4   1     0.00   0.00  -0.57     0.38  -0.59   0.00     0.14  -0.38   0.00
                    4                      5                      6
                   A'                     E'                     E'
Frequencies --  2592.7908              2731.3088              2731.3095
Red. masses --     1.0078                 1.1260                 1.1260
Frc consts  --     3.9918                 4.9491                 4.9491
IR Inten    --     0.0000               103.8370               103.8302
It is also worth commenting that the point group for the molecule has changed from D3h to C3h. This is because the vibrations remove the 3C2 axes of rotation.
Molecular Orbitals of BH3
The checkpoint file created during the frequency calculation was opened and the molecular orbital’s visualised. The molecular orbital diagram for BH3 was drawn using ChemDraw and the appropriate orbitals added to the diagram. It is VERY important that the orientation of the molecule is correct in order to compare the calculated orbitals with those approximated by the H3 fragment. Indeed there is no point whatsoever just rotating the orbitals until they match the fragment orbitals.
The diagram below shows the qualitative MO diagram with the calculated orbital that most matches the predicted one.


N.B. The wavy line represents a large gap in energy. The 1s orbital of B, which lies below the line, does not overlap with any other orbital as the energy gap is too large and so this orbital alone forms the 1a1'. Also the graphic of the 1a2,, has been rotated 90o about the y axis.
There are several differences between the calculated orbitals and the qualitative ones, both in the order of the energies and the form of the orbitals.
1. In the qualitative model (calculated) the 3a1 is higher in energy the degenerate 2e'.
2. The form of the qualitative orbitals is on the whole very similar to the qualitative ones. However the 1e' are a totally different shapes.
Other people's MO have been examined and they are of a slightly different shape to mine but have the same energy. I have repeated the calculated several times and keep getting the same result. Therefore my only possible conclusions can be that I have made a mistake somewhere in setting up the calculation (perhaps in the basis set?) or that there is some sort of defect/ambiguity in the visualisation of the orbitals peculiar to my copy of Gaussian. Others that I have spoken to have seen inexplicable projections on lobes of orbitals, even for highly symmetric molecules for example benzene, which seems to favour the latter explanation.
From the results it is clear that qualitative MO theory clearly has its limitations; firstly it does not always predict the order of orbital energies correctly- indeed during the second year course it was discussed that this must often by governed by gut feeling in non trivial cases and secondly the form of the orbitals is not always correct. This having been said others 1e' orbitals bore a much closer resemblance to the quantitative ones than mine did and aside from this p, and taking this fact into account it could be said that qualitative MO theory predicts the shape of orbitals very well but is not so good at predicting their relative energies.
Isomers of Mo(CO)4L2
For the purposes of this investigation the Mo(CO)4L2 complex where L= P(CH3)3 was chosen. The cis and trans isomers were drawn in Gaussian by first selecting the octahedral Mo fragment then adding the -C=_ fragment to 4 positions on the Mo central atom Obviously in the cis case the remaining hydrogen atoms were cis to each other and in the trans case they were trans. the oxygen atom was then added tot eh end and the phosphorous fragments produced by placing the tetrahedral P fragment in place of the hydrogens and then adding methyl groups. The order this was done was unfortunately not noted (this is important and will be discussed later.
The molecules were both optimised using the B3LYP method and a basic LANL2MB pseudo potential basis set and the additional keywords field was edited by adding "opt=loose". This sets a larger numerical value for iteration convergence and the isomers submitted to the SCAN for optimisation.
The output files for the first optimisations were examined and since both molecules had converged, a new calculation was prepared using the same B3LYP method but a much more accurate LANL2DZ pseudo potential and basis set. The additional keywords were changed to "int=ultrafine scf=conver=9" which uses a pruned (99,590) grid for integration and limits the cycles to 9. The molecules were both submitted to the scan at this higher level of accuracy.
Once the calculation had reached completion and upon examination of the log files the cis isomer had easily reached convergence whereas the trans had only converged in 2 of 4 areas. This was ignored for the time being and frequency calculations set up using the same basis set and method but with the additional keyword pop=(full,nbo). This instructs the programme to calculate all MO's and the nbo refers to the NBO method by which it does this. New input files were created and submitted to SCAN.
The output files were opened and the frequencies checked. In the cis isomer all looked as expected but the trans showed 2 negative frequencies. This confirmed that the optimisation had not converged to a high enough degree. It was thought that this was probably due to the limit of 9 cycles imposed on the second optimisation, therefore the output of this second optimisation was re-imputed, using the same method and basis set , with the hope that since it was on the way to convergence it would converge during the next 9 cycles. (This is Optimisation 2b below.)
The 2b output file was examined and indeed convergence had been reached this time. The frequency calculation was repeated exactly as above but with this improved optimisation as a start point. Only one small negative frequency was observed this time around.
The results of this method are shown below.
Results and Discussion
Energy Optimisation
The results of the optimisations are shown below along with some important properties.
| Isomer | Results Optimisation 1 | Results Optimisation 2 | Cis- P-Mo-P Angle(o) Trans- P-Mo-C Angle(o) |
Mo-P1(Å) | Mo-P2(Å) |
|---|---|---|---|---|---|
| cis | 
|

|
92.87 (97.54) |
2.648 (2.522) |
2.648 (2.522) |
| trans |
|
|
- | - | - |
| trans ctd. | - |
|
91.10, 91.13 (93.30, 98.12) |
2.573 (2.4256) |
2.573 (2.4256) |
N.B. The reference data for the trans compound is NOT for the Co(CO)4(P(CH3)3) complex but for an analogous complex Co(CO)4(P(OCH3)3).
As discussed above there is an extra set of data for the trans isomer since additional optimisation was required in order to compute the frequencies detailed in the following section. A quantitative assessment of the all of the geometrical data is not necessary since it very clear that although the calculated data does not match exactly with the literature it deviates by a minimal amount with respect to the accuracy of the calculations. Indeed bond lengths differ by less than 0.2Å in all cases and the angles also correlate well, although in the cis isomer there is a -4.87o degree difference.
The energies of the isomers differ by 0.00285355 a.u. or 7.49kJ/mol, with the trans isomer being of lowest energy presumably due to the decreased steric clash between the bulky phosphine groups.
IR
The data revealed many stretching and bending frequencies from the two isomers. The carbonyl stretching frequencies are discussed in detail however all frequencies are tabulated, assigned and compared with the reference material below.
Trans Isomer
By assigning a pseuodo symmetry to the two compouds we can predict the number of carbonyl stretches in each isomer beofore the data is examined. The trans isomer has a pseudo-symmetry of D2h. Considering the C=O bonds the following irriducile representaiton can be drawn up.
| D2h | E | C2(z) | C2(y) | C2(x) | i | σh | σv(xz) | σv'(yz) |
|---|---|---|---|---|---|---|---|---|
| Γ(C=O) | 4 | 2 | 0 | 2 | 0 | 2 | 4 | 2 |
Considering all of the Mulliken symblos of the group a reducible representation can be found for each. The first one of these is worked through but the rest are stated in order to save space and masses of tedous working.
n(Ag)=Σgχr =1/8(4+2+0+2+0+2+4+2) =2 =2Ag
Continuing through all of the symmetries thee following result is obtanied.
Carbonyl vib modes= 2Ag+B1u+B3u
Now to be IR active ther must be change in dipole moment of the moleule and this only occurs if the vibration shares its symmerty with one of teh axes. Thus we expect 2 active IR vibrations at B1u+B3u.
The spectrum is shown below along with a blown up area of the carbonyl peaks.
![]()
![]()
The first thing to remark is that there are 2 peaks (2 red lines in blown up graphic) as predicted from the theory and these peaks are located at wavenumbers that are fairly consistent with witht the literature value of 1876cm-1 at 1838-1+/-20cm-1. The literatre only reports one stretching frequncy but if the frequency table is examined in detail we see that ther are 2 vibrations that merge to give the very intense peak at 1836cm-1, and these vibrations corrspond to the B1u and B3u mentioned earlier. Indeed by examining the vibrations themselves we could work out exactly which one is which. this will be done if there is time.
![]()
A second point worthy of note is the C=O stretching frequencies at 1882cm-1 and 1954cm-1. These should correspond to the IR inactive 2Ag hence their zero or extrreemly small intensity.
In order to confirm this and assign the other vibrations their symmetry must be considered. The results of this are tabulated below.
| Frequency | Form of Vibration | Intensity | Symmetry |
|---|---|---|---|
| 1849 |  |
A1 Fully symmetric | |
| 1850 |  The two carbonyls shown stretch and bend in opossition to each other whlst the other 2 carbonyls oscillate slowly with a very small displacement. |
653 | B1 (Antisymmetric in σv(yz)) |
| 1870 |  Pairs of carbonyls osscilate in opposition to teh otehr pair. |
652 | A1 Fully symmetric |
| 1960 |  Al C=O bonsd stretch simultaneously in phase. |
336 | B2 (Antisymmetric in σv(xz)) |
The vibrations match the theoretical prediction and have now been fully asssigned.
The last interesting point concerns the prescense of a negative vibration. This is discussed bellow.
![]()
It is curious that the trans isomer converged upon optimisation after 2 attempts but then still exhibited a negavtive IR frequency at around -5cm-1. This is becasue the energy profile for this molecule must confain maany local minima and mamxima around the lower frequency range. The method is only accurate +/-1 20cm-1 so it may be that the negative vibration is mearly an error aassociated with accuracy limits of the calculation and by that argument the basis set and method. It is however important to comment that as the viration is very low in energy it will not couple to any appreciable extent wih the carbonyl stretching frequencies and so effect their vibrations very little and this is the reason it can be ignored.
Even more curiously after discussions with others, who have all poisitve frequencies for their trans isomer (lucky them!) and after making several manual geometry modifications myself (involving ecliping and staggerd PMe3 rotars) it appears that the only explaination of this phenomenon lies with the order in which the molecule fragments are added, right at the begining of the procedure. This is possibly an area for further investigation.
Cis isomer
In an analogous fashion the number of expected carbonyl vibrations can also be calculated for the cis isomer, whos pseudosymmetry is C2v. Thankfully ther are far fewer symmetries to deal with here!
The irriducible representaion for the C=O stretches is
| D2h | E | C2(z) | σv(xz) | σv'(yz) |
|---|---|---|---|---|
| Γ(C=O) | 4 | 0 | 2 | 2 |
Now again the (A1) will be worked thoruh but the results of the other irriducible representations will merely be stated.
n(A1)=Σgχr =1/4(4+0+2+2)=8/4 =2 =2A1
This gives the result:
C=O Vib modes= 2A1+1B1+B2
Since all of these modes are consistent wit cartesian axes they should all be IR active and we should therefore expect 4 C=O stretches.
If the IR spectum is examined we indeed see 4 stretches (this is clearer inthe blown up version).


If the table of frequencies is exmined we can see that the frequencies match fairly closely with the literature the literature frequencies being 2000, 1890, 1876, 1858cm-1.

Again is should be noted that there are 4 vibrations present at the expected C=O stretching frequency,as predicted by the theory. The vibrations can now be assgned if their symmetry is considered.
| Frequency | Form of Vibration | Intensity | Symmetry |
|---|---|---|---|
| 1849 | The two carbonyls shown stretch and bend in opossition to each other whlst the other 2 carbonyls oscillate slowly with a very small displacement. |
1951 | A1 Fully symmetric |
| 1850 | The two carbonyls shown stretch and bend in opossition to each other whlst the other 2 carbonyls oscillate slowly with a very small displacement. |
653 | B1 (Antisymmetric in σv(yz)) |
| 1870 | Pairs of carbonyls osscilate in opposition to teh otehr pair. |
652 | A1 Fully symmetric |
| 1960 | Al C=O bonsd stretch simultaneously in phase. |
336 | B2 (Antisymmetric in σv(xz)) |
The vibrations match the theoretical prediction and have now been fully asssigned.
Using A Better Basis Set
Since I was interested in the effect that a better basis set would have I continued with the optimal section of the optimisation.
| Isomer | Results Optimisation 1 | Results Optimisation 2 | Cis- P-Mo-P Angle(o) Trans- P-Mo-C Angle(o) |
Mo-P1(Å) | Mo-P2(Å) |
|---|---|---|---|---|---|
| cis | 
|

|
93.99(97.54) | 2.589(2.522) | 2.589(2.522) |
| trans |
|
|
89.02,88.68 (93.30, 98.12) | 2.52530 (2.4256) | 2.52530 (2.4256) |
In the cis isomer the geometric parameters are closer to the literature and for the trans isomer the bond lengths are closer to the literature but the bond angles are not. This is not surprising since there are 4 possible P-Mo-C angles for each phosphorous atom and it is not entirely clear from the literature which angle they are quoting. Ideally a mean angle would be taken but there is no time for this. It is sufficient to comment that using the improved basis set yields geometric parameters that are closer to the literature apart from the angles in the trans case.
References
Cis Isomer
Optimisation 1 http://hdl.handle.net/10042/to-1926
Optimisation 2 http://hdl.handle.net/10042/to-1924
Frequency Calculation http://hdl.handle.net/10042/to-1925
Optimisation Better Basis Set 1 http://hdl.handle.net/10042/to-1923
Optimisation Better Basis Set 2 http://hdl.handle.net/10042/to-1922
Frequency Calculation Better Basis Set http://hdl.handle.net/10042/to-1921
Full geometric data including bond angles is available from the following journal http://dx.doi.org/10.1021/ic00137a026
Trans Isomer
Optimisation 1 (Unable to publish on D space) https://www.ch.ic.ac.uk/wiki/images/9/95/Jfg_MoPMe3trans_opt1.out
Optimisation 2 http://hdl.handle.net/10042/to-1944
Optimisation 2b http://hdl.handle.net/10042/to-1946
Frequency Calculation 2 FAIL http://hdl.handle.net/10042/to-1947
Frequency Calculation 2b http://hdl.handle.net/10042/to-1945
Optimisation 3 Better Basis Set http://hdl.handle.net/10042/to-1948
Optimisation 4 Better Basis Set http://hdl.handle.net/10042/to-1949
Frequency Calculation Better Basis Set http://hdl.handle.net/10042/to-1950
Full geometric data including bond angles is available from the following journal http://journals.iucr.org/c/issues/1996/04/00/issconts.html doi:10.1107/S010827019501479X
Both
IR stretching frequencies http://dx.doi.org/10.1021/ic50058a026
Ammonia
Symmetry and Structure
Procedure Results & Discussion
The ammonia molecule was generated in GaussView by selecting the trigonal based pyramidal Nitrogen structure and it was optimised on the laptop by using a 6-31G basis set and the B3LYP method. This gave the following result.

The bond distances are all 1.00591Å however on examination of the bond angles two are found to be 116.25108o and one 116.25113o. This is not consistent with the C3v point group since the molecule clearly only possesses a single σv not the 3 required by this symmetry.
A new molecule of ammonia was then created using the same type of fragment and one of the NH bonds set to a length of 1.01Å. The optimisation was repeated for this molecule, again with a B3LYP method and 6-31G basis set but the symmetry was ignored thus the keyword "nosymm" was added to the calculation. This produced the following result

It should be noted that thee symmetry has now changed to C1 and the energy of this later optimisation is slightly higher. Also the NH bond pointing upward is slightly longer than the other two at 1.00594Å as opposed to 1.00595Å. All of the HNH bond angles are also different at 116.16326o, 116.15838o and 116.16216o.
The following pre prepared text file was then saved as a *.com, the file opened in GaussView and the optimisation run again on a .gjf version of this file.
%chk=nh3_b3lyp_d3h.chk
%mem=1000MB
%nproc=1
#opt b3lyp/6-31G
NH3 high symmetry d3h optimisation
0 1
N
X  1   2.0
H  1   RH1   2   AHNX1
H  1   RH1   2   AHNX1   3   THNXH1
H  1   RH1   2   AHNX1   3   -THNXH1
RH1     1.01
AHNX1   90.0
THNXH1  120.0
This produced the following result.


N.B. The first is a graphic of the input molecule in order to see the pink dummy atom.
The bond distances are now all 1.00037 and angles are 120.00002o, 120.00002o and 119.99997o. Again strictly speaking the molecule only possesses one σv not the 3 required by the D3h point group. Most importantly though, the molecule is planar and therefore possesses a σh unlike either of the other two models. This allows it access to a higher symmetry group.
The energies of the molecules are compared in the following table.
| Symmetry | Energy (a.u.) | Energy (kJ/mol) | Energy Difference wrt C1 (kJ/mol) |
|---|---|---|---|
| C1 | -56.53188762 | -1.484244709x10⁵ | - |
| C3v | -56.53188590 | -1.484244664x10⁵ | +0.45 |
| D3h | -56.53154189 | -1.484235632x10⁵ | +9.1 |
Conclusion
Several conclusions can readily be reached. Firstly the symmetry has a profound difference on the geometrical properties of a system. The symmetry of the above molecule increases C1 -> C3v -> D3h and so the bond angles become closer to 120o, the bond lengths become shorter and the molecule becomes more planar. Secondly when the symmetry is constrained the optimisation calculation time is increased greatly (roughly fourfold in this case). The energies of the system decrease with increasing symmetry from C1 to D3h indeed this is expected the number of possible states in the high symmetry system is lower and so therefore is the entropic contribution to the energy S=klnW. The magnitude of the energy difference may seem a lot in a.u. but converting to kJ/mol we find it is insignificant even in the high symmetry case. Since ammonia must pass through this planar state during inversion the energy difference between C1/3h and D3h may represent an activation energy barrier to this conversion. Thus considering the thermal energy at room temperature(298K) is KbT = 2.48kJ/mol the difference in energy between the symmetry forms is insignificant and does not present a significant barrier to inversion.
References
Ammonia Optimisation https://www.ch.ic.ac.uk/wiki/images/1/19/JFG_NH3.LOG
Ammonia 1.01Å Optimisation https://www.ch.ic.ac.uk/wiki/images/5/5e/JFG_NH3B.LOG
Ammonia High Symmetry Optimisation https://www.ch.ic.ac.uk/wiki/images/9/98/Jfg_NH3_B3LYP_D3H.LOG
Methods
Introduction
Two additional methods with beter basis sets will now be used to examine the ammonia molecule. The first, the MP2 method, used a 6-311G+(d,p) basis set with a B3LYP method and the calculation was run in anlogous method to the previous calcultions. The second method used an input text file that constrains the symmetry to D3h. The text for pre-prepared file is hsown below and clearly limits the HNH angle to 120o (last line) and t keeps the molecule planar by limiting the HN angle to 90o.
%chk=nh3_mp2_d3h.chk
%mem=1000MB
%nproc=1
#opt mp2=full/6-311+g(d,p)
NH3 mp2 high symmetry d3h optimisation
0 1
N
X  1   2.0
H  1   RH1   2   AHNX1
H  1   RH1   2   AHNX1   3   THNXH1
H  1   RH1   2   AHNX1   3   -THNXH1
RH1     1.01
AHNX1   90.0
THNXH1  120.0
Results
The reults fo the two new calulations are shown below and the energies compared in the table.


| Basis Set | Symmetry | Calculation Time | Energy (a.u.) | Energy (kJ/mol) | Barrier Height ΔE= E(D3h)-E(C3v) (kJ/mol) |
|---|---|---|---|---|---|
| B3LYP/6-31G | C3v | 30s | -56.53188590 | -1.484244664x10⁵ | - |
| MP2/6-311+G(d,p) | C3v | 35s | -56.43444511 | -1.481686355x10⁵ | - |
| B3LYP/6-31G | D3h | 2min 20s | -56.53154189 | -1.484235632x10⁵ | 9.0 |
| MP2/6-311+G(d,p) | D3h | 1min 41s | -56.42664911 | -1.481481672x10⁵ | 20.5 |
Conclusions
From the table it can be seen that in both cases the better basis set decreases the energy of the molecule. Indeed this is as expected since the bais set used ithe MP2 method is much more realistic. Explicitly the 6-331 improves the flexibility of the basis set, the +G adds diffuse functions and the (d,f) improves the polarisation. With all of these impovements we would expect a lower energy to be achieved. In the case of the MP2/6-311+G(d,p) method the barrier height (explained in the previous section), is 20.5kJ/mol. This compares much better to the expeimental value of 24.3 kJ/mol?, than the 9.1 kJ/mol found by the B3LYP/6-31G method.
References
Ammonia MP2/6-311+G(d,p) Optimisation https://www.ch.ic.ac.uk/wiki/images/7/77/JFG_NH3_MP2.LOG
Ammonia MP2/6-311+G(d,p) High Symmetry Optimisation https://www.ch.ic.ac.uk/wiki/images/7/76/JFG_NH3_MP2_D3H.LOG
Vibrational Analysis
The C3v and D3h ammonia, optimised at with the B3LYP/6-31G method from the first part of this investigation were taken and a frequency calculation run on each of the optimised molecules by changing the calculation method to frequency and running the calculations as before. The resulting spectra were then visualised and are shown below.
Ammonia C3v


There are 6 positive vibrations for the C3v ammonia. These are compared with the literature in the table below.
| C3v (cm-1) | Experiemnt (cm-1) | Difference (cm-1) | % Difference |
|---|---|---|---|
| 3776 | 3444 | +332 | +8.8% |
| 3776 | 3444 | +332 | +8.8% |
| 3575 | 3337 | +238 | +6.7% |
| 1680 | 1627 | +53 | +3.2% |
| 452 | 950 | -498 | -110% |
It is obvious by examining the percentage difference that the B3LYP/6-31G method overestimates the experimental results at the higher frequecies and significantly underestimates it at the lower frequencies this is becasue the basis set it so poor and p elctrons are not represented very well.
Ammonia D3h


It can be seen that there are 6 vibrational frequencies of which is one negative at -318cm-1.
These vibrations can be matched up with those of C3v that have a similar motion. This is done in the table below.
| C3v (cm-1) | D3h (cm-1) |
|---|---|
| 452 | -318 |
| 1680 | 1640 |
| 1680 | 1640 |
| 3575 | 3636 |
| 3776 | 3854 (Vib 6) |
| 3776 | 3854 (Vib 5) |
The vibrations that correspond to the transition state change are those at 452 and 318cm-1 sine they involve vibration from the pyramidal to trigonal planar sructures and into a slightly inverted pyramidal conformation.
References
IR frequencies http://scitation.aip.org/getpdf/servlet/GetPDFServlet?filetype=pdf&id=JCPSA6000084000004002262000001&idtype=cvips
C3v Ammonia Frequency Calculation https://www.ch.ic.ac.uk/wiki/images/e/e4/JFG_NH3_C3V_FREQ.LOG
D3h Ammonia Frequency Calculation https://www.ch.ic.ac.uk/wiki/images/9/94/JFG_NH3_B3LYP_D3H_FREQ.LOG
Miniproject
Introduction
The reactivity of metal tricarbonyl arenes has been of interest for the past half century due to the profound influence of the metal fragment. In particular chromium tricarbonyl metal arenes have been studied. The aim of this Miniproject is to illustrate the origins of some of these properties.
Conformational Determination
To start with it must be explained that monosubstituted carbonyl arenes can exist in several conformers, although the arene exhibits free rotation at room temperature and so the conformers are easily interchangeable.
Taking the following fluorobenzene molybdenum tricarbonyl as a test case, these conformers were probed and the results analysed to find the conformer of lowest energy with which the molecular properties should be investigated.

Before the detail of the calculations are discussed is should be mentioned that drawing these conformers in Gaussian proved a challenge in itself.
The eclipsed conformers were easy to draw, by selecting the trigonal planar Mo fragment adding the carbonyls, rotating the molecule into the plane of the page and then adding the arene before fluoronating it in the appropriate place. The programme always ensured the correct eclipsed geometry. Conversely the staggered conformer required several different attempts before it was drawn successfully. In the end the arene was added first then the Mo atom and CO ligands were added using separate atoms not fragments. Bonds were drawn between these atoms by clicking the "modify bond button selecting two atoms and then creating a bond by selecting the single bond button. Mo-C bond lengths were adjusted to around 1.5 and C-Mo-C angles near to 120o.
The conformers were subjected to a optimisation using a B3YLP method and LANL2MB basis set, followed by a more rigorous optimisation using the same method but a LANL2DZ basis set and finally to a frequency and full MO determination. The results of each step and links to the respective .log files are detailed below.
| Conformer | Results Optimisation 1 | Results Optimisation 2 | Frequency Calculation |
|---|---|---|---|
| Eclipsed 1 | 
|

|

|
| Eclipsed 2 | 
|

|

|
| Staggered | 
|
- | - |
N.B. It was found that the staggered conformer coalesced into an eclipsed one and therefore no further calculations were run on this molecule.
Conclusion
The results show that the eclipsed conformer, with the halide syn-periplanar to the CO group, was preferred since it is 0.0025449 a.u. or 6.68kJ/mol lower in energy than the eclipsed conformer with the halide gauche. This is further confirmed by examining the frequencies, indeed eclipsed conformer 1 has a single negative frequency showing that is not an energy minimum. The eclipsed 2 conformer was therefore used for any further investigations.
Before the next part of the project some of the results will first be examined in more detail.
References
Eclipsed 1 Optimisation (unable to publish to D-space) Please Click here to Read Output file
Eclipsed 1 Optimisation 2 http://hdl.handle.net/10042/to-1910
Eclipsed 1 Frequency Calculation http://hdl.handle.net/10042/to-1908
Eclipsed 2 Optimisation http://hdl.handle.net/10042/to-1904
Eclipsed 2 Optimisation 2 http://hdl.handle.net/10042/to-1906
Eclipsed 2 Frequency Calculation http://hdl.handle.net/10042/to-1907
Staggered Optimisation http://hdl.handle.net/10042/to-1905
Results for Fluorobenzene Chromium Tricarbonyl
IR'
The IR spectrum can be predicted by considering the pseudosymmetry of the molecule and the carbonyl stretches under this symmetry. The complex in its eclipsed 2 form has a symmetry of Cs since its only symmetry operation is a σv. The reducible representation for the carbonyl stretches is calculated in the following table.
| Cs | E | σv |
|---|---|---|
| Γ(C=O) | 3 | 1 |
Considering all of the Mulliken symblos of the group a reducible representation can be found for each. The first one of these is worked through but the rest are stated in order to save space.
n(A')=Σgχr =1/2(3+1) =2 =2A'
Continuing with the A" symmetry the following result is obtanied.
Carbonyl vib modes= 2A'+A"
Since both A' and A" are coinsident with the ordiante axes we should expect 3 active IR vibrations of 2xA' and 1xA" symmetry.
The IR spectrum is shown below along with a blown up picture of the carbonyl peaks.


Sicne there are clearly three peaks present, as predited by the theory, we shall now consider their symmetries and check if these are 2A' + 1A" as expected.
| Frequency | Form of Vibration | Symmetry |
|---|---|---|
| 1886 |  The carbonyl to the far right remains stationary but curisously does roate about its axis. The two other carbonyls stretch and bend in an asymetric fashion. |
A" (Antisymmetric in σv) |
| 1894 |  The carbonyl to the far right stretches whiltst the other two carbonyls compress. |
A' (Symmetric in σv) |
| 1950 | All carbonyls stretcha dand bendd together in a concerted fashion. |
A' Fully symmetric |
The vibrations match the theoretical of 2A' + 1A" prediction and have now been fully asssigned. Intensities can be related qualitatively to the change in dpole moment if there is time.
Another interesting geometrical find is that the carbonyl underneath the C-F is longer than the others. **Data** This is presumable due to donation of a lone pair of the F into teh C=O π*, thus weakening and lengthening the C=O double bond. This observation is confirmed by the literature and if the appropriate MO is examined it can indeed be shown that donation from the C-F does occur.
Effect of halide monosubstitution
Introduction
In free benzene the electron donating power of a single halide substituent favours electrophonic substitution at the ortho and para positions. This phenomenon is explained at a qualitative level by drawing resonance forms of the substituted ring.

Although there are many reviews on chromium tricarbonyl compounds the directing effect of the halide has been discussed on the grounds of an NMR study however as yet I cannot find any orbital based arguments. It is hoped that consideration of the metal orbitals will result in a more quantitative explanation and also offer some insight into how the metal orbitals interfere with this effect.
Experimental
Fluorobenzene was used as the complexed arene to be investigated since it uses the least number of orbitals possible from a halogen substituted benzene and therefore should require less computing time. Never the less, the results should be pertinent to all of the halides and this will be discussed at the end of the investigation.
Since it is clearly the MO's that we wish to consider, the complex was subjected to minimisation using a B3YLP method and LANL2MB basis set followed by further optimisation using a LANL2DZ basis set for greater accuracy. Finally the full MO diagram was computed from this output.
Results & Discussion
It must be emphasised that the full MO diagram for this system is very complex with 149 orbitals. To help understand from where the diagram and specifically the HOMO and LUMO originate the fluorobenzene fragment was considered in isolation.
Fluorobenzene MO's
The molecule of fluorobenzene was drawn in ChemDraw3D, minimised using the MM2 method and then the energy minimised again using an ab-intio method. This was done by selecting Calculation-->Gaussian-->Gaussian Interface-->Minimise (Energy/Geometry) and then selecting the HF method and a 6-31G basis set along with ticking the "molecular surfaces" box. This resulted in the following diagram of the occupied states, LUMO and LUMO+1.
The symmetry of the fragment is C2v since there is a σh in the plane of the ring and both a σv and C2 axis in line with the C-F bond. From this the symmetries of the relevant orbitals have been assigned and can be seen in the MO diagram below. It is complete for the occupied orbitals but not for the unoccupied ones.

The syyemtries of the highlighed orbitals have been assigned.
Now let us returen to the molcular orbiatl diagram for the complex.
Cr(CO)4(C3H5F1)