Rep:Mod:jem2i
Jenifer Mizen: Inorganic Computational Chemistry
BH3 Optimisation

First, a molecule of BH3 was made then optimised in Gaussview. A DFT calculation was done using method B3LYP and basis set 3-21G. This meant that the calculation was not very accurate, but it was fast. BH3 was found to have a B-H bond length of 1.21A and a H-B-H bond angle of 120o.
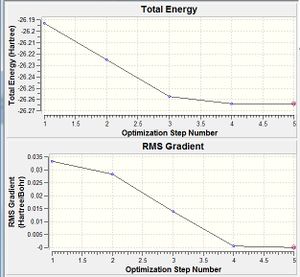
Since the gradient was less than 0.001, it was thought to have optimised. This gradient is that of the energy vs optimisation step graph - as the molecular structure is optimised, the energy is calculated after each change made, and Gaussview completes its calculation after the energy change between optimisation steps becomes small enough. This is shown more clearly in the optimisation energy gradient graph to the right.
Next the "real" output was opened, at it was checked that the forces had really converged.
The energy gradient was opened and the molecule animated to show its appearance at each step of the optimisation. For the first 3 steps, no bonds were shown, and the B-H length decreased from 1.5 to 1.4 to 1.3A. On the fourth step it reached 1.2A and bonds were shown.
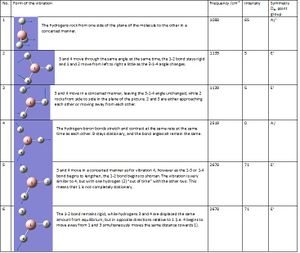
Next, a frequency analysis was done. The program uses the energy gradient to work out when the graph of the energy of the molecule has a gradient of zero and presumes that this is a minimum. However this may not be the case, as gradient will be zero for a maximum too. For this reason, the second derivative i.e. frequency anaysis was taken. If all frequency values computed are positive, the minimum energy has been found and the optimisation has worked (likewise, if all the values are negative, a maximum has been found, and if the values are mixed, a transition state has been found).
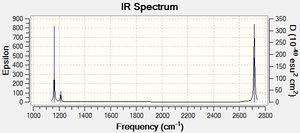
Only three peaks can be seen on the IR spectrum, since there are two sets of degenerate vibrations (two different forms of the vibration at both 2678 and 1139 cm-1, so these peaks are for four different motions), and one non-IR visible motion, 4, as the motion does not cause its dipole to change.
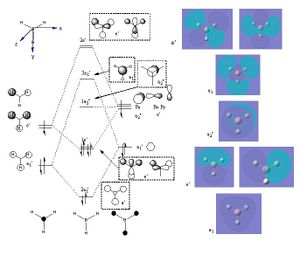
Next, MOs were calculated, and compared to those drawn on paper using MO theory and character tables. The predicted contribution from the hydrogens for the 3a1' MO was less than that calculated, and one of the 2e' orbitals was more symmetrical than predicted, however the qualitative pen and paper predictions are remarkably accurate considering the method used! (N.B the MOs from the 1s orbital was not included on the diagram as it does not participate in the chemistry of the molecule). A link to the MO calculation can be found on "D-space": http://hdl.handle.net/10042/to-5713
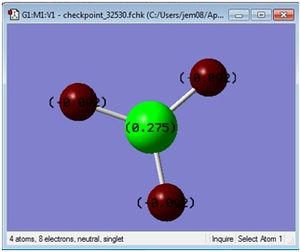
An NBO anaylsis was also done. This gave data such as the charge distribution, and also, interestingly, information about s and p character of bonds (for example the orbitals or boron are one third s character and two thirds p, as it formed 3sp3 hybrid orbitals on bonding with the three hydrogens).
TlBr3 Optimisation
Similarly, TlBr3 was optimised.This time the LANL2DZ basis set (this means that pseudopotentials were used for heavier elements, and a mid-level basis set used on smaller ones) was used with the RB3LYP method. The symmetry was also constrained to D3h before the calculation was carried out. The optimisation was confirmed by looking at the energy gradient graph, checking that the RMS Gradient Norm in the summary was less than 0.001, and checking for convergence in the "real" output. All these affirmed the fact the molecule had been optimised. The real output is attached here:
File:TlBr3optimisationfile.txt
And the relevent part shown below:
Item               Value     Threshold  Converged?
Maximum Force            0.000002     0.000450     YES
RMS     Force            0.000001     0.000300     YES
Maximum Displacement     0.000022     0.001800     YES
RMS     Displacement     0.000014     0.001200     YES
Predicted change in Energy=-6.102959D-11
Optimization completed.
  -- Stationary point found
The following parameters were found:
Tl-Br bond length: 2.65A Br-Tl-Br bond angle 120o
A frequency analysis was done to check that the mimium energy had really been found (for the same reasons as stated in the previous section). The same method and basis sets were used so that the same level of accuracy was used and so the data was comparable. The low frequency was small enough to support the idea that the energy minimum was found by the optimisation:
Low frequencies ---   -3.4226   -0.0026   -0.0004    0.0015    3.9361    3.9361
Low frequencies ---   46.4288   46.4291   52.1449
Frequencies --    46.4288                46.4291                52.1449
The lowest "real" normal mode was 46.4 cm-1.
A literature bond length of 2.52A is in the same ballpark as the calculated result, also supporting the idea that the optimisation worked.[1]
Bonds are not always included in Gaussview, although this does not mean there is not really a bond. A bond can be seen as an interaction between two atoms or molecules which is strong enough to hold them together. For a bond to be strong, there must be considerable overlap of orbitals, and the overall energy of the system must be lower (i.e. bonding orbitals stabilised), in the bonded product than in the seperate starting materials. Generally, the fewer nodes in the molecular orbitals, the lower the energy.
Isomers of Mo(CO)4L2
First Optimisation
Cis and trans complexes of Mo(CO))4(PCl3)2 were optimised with the B3LYP method and LanL2MB basis set using loose convergence criteria.
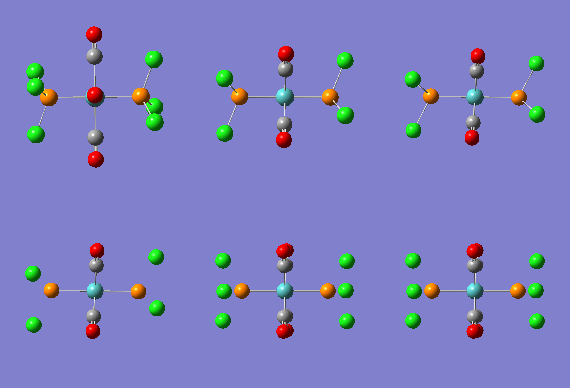
Initially, an optimisation was done and the P-Cl bonds had disappeared. This did not mean that the bonds would not be present in reality, however they are longer than the limit set down by Gaussview. Bond lengths tend to be longer in inorganic complexes, so Gaussview may have been programmed with organic chemistry in mind.
Trans optimisation results:
http://hdl.handle.net/10042/to-5738
Cis optimisation results:
http://hdl.handle.net/10042/to-5741
Second Optimisation
Since it was a rather low level optimisation, the dihedral angles were not very accurate, so the molecules were re-optimised using a given geometry, increasing the electronic convergence and using LANL2DZ.
2nd optimisation results:
Trans complex optimisation results: http://hdl.handle.net/10042/to-5781

Item               Value     Threshold  Converged?
Maximum Force            0.000119     0.000450     YES
RMS     Force            0.000038     0.000300     YES
Maximum Displacement     0.001720     0.001800     YES
RMS     Displacement     0.000511     0.001200     YES
Predicted change in Energy=-6.047289D-07
Optimization completed.
   -- Stationary point found.
The summary, energy gradient and real ouput file all suggest that the optimisation was successful.
Cis complex optimisation results: http://hdl.handle.net/10042/to-5782

Item               Value     Threshold  Converged?
Maximum Force            0.000007     0.000450     YES
RMS     Force            0.000002     0.000300     YES
Maximum Displacement     0.001651     0.001800     YES
RMS     Displacement     0.000444     0.001200     YES
Predicted change in Energy=-2.274165D-09
Optimization completed.
   -- Stationary point found.
Again, the optimisation appears to have been successful.
Frequency Analysis
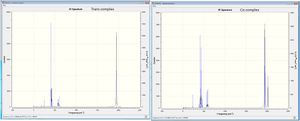
Next, the frequency analysis was done to check that the minima had been found.
Trans complex: http://hdl.handle.net/10042/to-5846
The real output showed the first line of low frequencies as lower than the lowest real frequency:
Low frequencies ---   -1.9405   -0.0001    0.0002    0.0003    2.1825    2.4983
Low frequencies ---    4.0124    5.8004   38.0077
Frequencies --     2.9269                 5.6593
Cis complex: http://hdl.handle.net/10042/to-5847
Low frequencies ---   -1.7820   -0.0007    0.0001    0.0005    1.0330    1.4918
Low frequencies ---   10.7465   17.6213   42.0564
Frequencies --    10.7289                17.6213                42.0564
C=O stretching frequencies:
| Frequency/cm-1 | Stretch 1 | Stretch 2 | Stretch 3 | Stretch 4 |
|---|---|---|---|---|
| Trans | 1951 | 1951 | 1977 | 2031 |
| Cis | 1945 | 1949 | 1958 | 2023 |
| Experimental trans | 1890 | 1901 | 2014 | |
| Experimental cis | 1778 | 1834 | 1889 | 2012 |

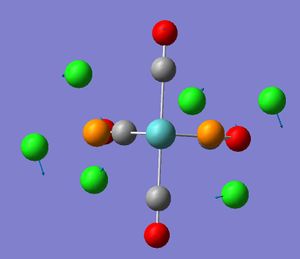
The trans complex was predicted to have one C=O stretching frequency because all its CO groups were thought to be in identical environments (D4h symmetry) and therefore all stretch in the same manner.
The trans complex does have one main peak for the C=O stretch, at 1951 cm -1, however when this is investigated in Gaussview, it is made up of four different motions:
1. 1951 cm-1 - one pair of C=Os trans to each other move simulatneously and in the same direction, so that one C=O is stretching whilst the other is contracting. The other pair of trans C=O also undergo the same movement, but a very small amount.
2. As above, however the pairs of trans C=Os swap motions (i.e. the pair undergoing only a small motion previously now has a large one and vice versa).
3.1977cm-1 - C=Os trans to each other mirror each others movements. One pair begin the strech by the C-Mo bond shortening and the other pair begins by the C-Mo bond stretching. All C and O atoms are displaced by the same amount.
4.2031 cm-1 - All C=Os stretch in the same manner, symmetrically and concertedly.
Two C=O stretching frequencies were expected from the cis complex as there appear to be two different CO environments (C2v symmetry), however the same four different motions were found in Gaussview as were found for the trans complex, this time at 1945, 1949, 1958 and 2023 cm-1.
The experimental values were taken from a second year experiment on Mo(CO)4(PPh3)2, so the frequencies are expected to be a little different as the ligand is different. The second stretch for the trans isomer was difficult to see, and was possible present in a small shoulder on the main peak between stretches 1 and 2. This is similar to the computed data in that for the trans complex, the first two stretches were effectively degenerate. The cis frequencies were less than the trans for all the data, hence the CO was weaker in the cis complexes.
Some of the frequncies reported were very low, for example 2.93 cm-1 was the lowest for the trans complex, and 10.73 cm-1 for the cis. These correspond to the PCl3 groups rotating concertedly in one direction, and the CO groups doing the same in the other direction, and the CO groups rocking whilst the Cl3 rotate around the P. Since there is such a low energy barrier to these occuring, the molecule is presumed to be vibrating at room temperature.
Comparison of the Cis and Trans complexes
1. Energy: both isomers appear to be the same energy (see summary files - the cis complex is 0.00104211 au higher energy, which was thought to be negligable), which was unexpected. It was expected that, for steric reasons, the trans complex would be lower in energy, since in the cis, the PCl3 groups would clash. This idea was supported by a second year lab experiment in which a cis [Mo(CO)4(PPh3)2] complex was heated and isomerised to the trans complex, suggesting that the trans complex was the most thermodynamically stable of the two. In this case, Mo-C bonds were much shorter in the trans complex than in the cis, implying that favourable interactions were stronger. Next, therefore, the bond lengths will be compared.
2. Bond lengths:
| Bond lengths /A | Cl-P | P-Mo | Mo-C | C-O |
|---|---|---|---|---|
| Trans | 2.24 | 2.44 to 2.45 (a.) | 2.06 | 1.17 |
| Cis | 2.24 | 2.51 | 2.06 and 2.01 (b.) | 1.17 and 1.18 |
a. Note, Gaussview reports these as 2.44492 and 2.44508, giving a difference of 0.00016A. Since the accuracy can only be read to about 0.01A, it is akward that the distances sit across the borderline for rounding - they are effectively the same.
b. The two that are trans to each other (with C-Mo-C angle 178.4o)have the same bond distance as in the trans complex, the other two (at 87.1o to each other) are shorter, at 2.01A. The C=O groups with the same Mo-C bond lengths as in the trans complex have the same C-O bond distances, but the other two are a very small amount longer at 1.18A (a difference of 0.01A with the techniques used does not seem to be very conclusive).
Literature vales for the cis complex (if Me was substituted for Cl) Mo-C bond lengths were 1.97 and 2.02A.[2]
The difference is 0.05A for both literature and computed values, however the literature ones are a little lower, though in the same ballpark. This suggests that the calculation reflects reality reasonably well.
3.Bond angles:
| Bond angles /o | P-Mo-P | opposite CO groups: C-Mo-C | adjacent CO groups: C-Mo-C |
|---|---|---|---|
| Trans | 177.5 | 179.4 and 179.3 | 89.3, 90.0, 90.2 and 90.6 |
| Cis | 94.2 (a.) | 178.4 and 87.1 | 89.7 and 89.1 |
a. The P-Mo-P angle from the same literature was 97.54o due to steric interaction between the PMe3 ligands.
Conclusions:
The P-Mo bond length is longer in the cis complex, supporting the idea that steric hindrance from the closeness of the PCl3 groups disfavours the cis isomer. However two of the Mo-C bonds were shorter in the cis complex (the two at 87.1o to each other). This means a more favourable interaction between the C and Mo which may account for the equal energies computed for both complexes. It has been found that back bonding causes cis isomers to be favoured for certain complexes.[3]
Since CO is a weak sigma donor and a strong pi acceptor, it could be assumed from the smaller Mo-C bond length when CO is trans to PCl3, that the trans effect is larger for the CO ligand and the extra stabilisation of the cis complex from this source balances out any steric effects. It would be interesting to investigate different ligands, their trans effects and the C=O stretching frequencies to see how back bonding and steric effects are balanced, and when cis complexes predominate over trans (and vice versa).
The computed bond angles were not as expected either (equal angles for the trans complex and two different ones for the cis were expected), however they do begin to explain the IR results. The four separate C-Mo-C angles for the trans complex show that the CO groups are not all in exactly the same environment. The two values for the cis complex support that result of two peaks in the IR, however does not yet explain the four stretches found in Gaussview.
The two lower stretching frequencies of 1945 and 1949cm-1 are for the CO groups at 87.1 and 178.4o to each other respectively, showing clearly that these COs are in two different environments. This suggests that the groups closer to each other have weaker C=O bonds (this is supported by the fact that the bond distance was found to be a little longer). The other two frequencies were due to a completely symmetrical concerted pattern of stretching, and to the stretches of the CO groups opposite each other mirroring each other's motion but not that of the group adjacent. The two peaks observable on the IR are actually due to a conglomeration of the first three vibrations, and then the last one a little apart from the others in wavenumber.
For the trans complex, the lower two vibrations were calculated to be virtually degenerate as there is virtually no difference between the two pairs of COs that are trans to each other. This therefore gave one IR peak. The higher two vibrations have very low intensities, because if the molecule were perfectly symmetrical there would be no change in dipole (i.e. not IR visible). However as not all the bond angles are identical 90o these vibrations have been calculated by Gaussview, although they are not large enough to appear on the main IR spectrum show. This explains the single peak for the trans complex.
- ↑ J Blixt, J Glaser, J Mink, I Persson, P Persson, M Sandstrom, J. Am. Chem. Soc, 1995, 117, 5089-5104. DOI:[https://doi.org/10.1021/ja00123a011 10.1021/ja00123a011 ]
- ↑ F. Cotton, D. Darensbourg, S. Klein, B. Kolthammer, Inorg. Chem., 1982, 21, 2661-2666. DOI:10.1021/ic00137a026
- ↑ D. Marynick, S. Askari, D. Nickerson, Inorg. Chem., 1985, 24, 868-870. DOI:10.1021/ic00200a014
